



0 引言
印度洋俯冲带作为印度-澳大利亚板块与亚欧板块的斜向汇聚边界,沿NW—SE向延伸,是研究板块俯冲动力学的天然实验室。作为全球90%以上大地震的发源地[1-3],该区域频繁发生的俯冲型逆冲地震(如2006年Mw 7.7爪哇地震)给东南亚沿海地区造成了深重的灾难。地质演化方面,该地区地质构造复杂,不仅处于自白垩纪以来重新活跃的印澳板块向巽他岛弧俯冲系统之中[4-5],还受到了古老岩石圈与相邻板块几何差异的影响[4]。作为全球俯冲系统的代表,印度洋俯冲带对于研究海沟外侧岩石圈挠曲与板块俯冲机理具有重要的科学与现实意义,而在南苏门答腊-爪哇海沟这一关键区段,前人研究大都集中在地质和构造演化上[6-7],在挠曲特征方面的研究相对较少。在印度洋俯冲带体系中,不同海沟区段的地震机制呈现出显著差异[8-9]。苏门答腊俯冲带以板块斜向俯冲引发的大规模逆冲地震为主,尤其集中在俯冲界面上,释放的挤压应力占据主导;而沿着向东延伸的爪哇海沟,在其弧前隆起区频繁出现以正断层为主的地震活动,这种弧前正断层活动与该段海沟的岩石圈挠曲、外缘隆起及由此产生的拉张应力场密切相关。印度-澳大利亚板块在向亚欧板块俯冲时,其前缘在南苏门答腊-爪哇海沟区域经历了显著的挠曲变形,并伴随着外缘隆起构造的形成[10]。海沟的挠曲不仅改变了应力传递路径,也为海水沿断裂和裂隙向深部渗入、蛇纹岩化和地震孕育创造了条件,使得正断层构造在该带域内能够集中发育。量化南苏门答腊-爪哇海沟岩石圈弯曲幅度和隆起位置的空间分布,对于理解该俯冲带的应力演化以及地震机制分布具有关键意义。
已有研究从不同角度探讨过南苏门答腊-爪哇海沟岩石圈的挠曲[11-13]。从最早通过弹性薄板模型揭示海沟岩石圈挠曲的基本特征,到采用布格导纳技术计算苏门答腊-爪哇俯冲带的岩石圈强度,均发现其岩石圈的有效弹性厚度(Te)沿走向呈现显著空间分异,即沿海沟岩石圈力学性质存在非均质性。继而RAGHURAM等[13]选择可变有效弹性厚度板块弯曲模型模拟东南亚俯冲带洋坡岩石圈的挠曲,在揭示前隆幅度与弯矩空间差异性的基础上,重点论证了巽他海沟沿线板块弯曲力矩、水平应力与板块深度之间的负相关关系。然而,这类研究大多将苏门答腊和爪哇段置于统一的区域分析框架中,而对南苏门答腊-爪哇海沟这样一个具有构造和热结构过渡特征的独立单元,缺乏具有针对性的、系统的挠曲特征研究,且尚未从大地水准面角度出发对该段开展系统研究。
通过大地水准面起伏模拟岩石圈挠曲的方法最早由 MCADOO等[14]提出,揭示了海洋岩石圈有效弹性厚度与岩石圈年龄的平方根存在近似线性关系,并指出弯曲强度主要受温度场控制。2004年,陈美等[15]为研究西太平洋边缘沟-弧-盆体系的动力学演化提供流变学约束,利用此方法模拟了琉球海沟的挠曲变形。本文拟在前人工作的基础上,基于大地水准面起伏模拟南苏门答腊-爪哇海沟段外缘隆起带的挠曲,定量计算其东、中、西各区段内15条剖面(图1)的岩石圈有效弹性厚度和挠曲特征;进一步依据岩石圈有效弹性厚度与岩石圈年龄之间的经验关系,对研究区岩石圈年龄进行估算,并分析其年龄-强度关系。研究结果可为评估南苏门答腊-爪哇海沟岩石圈力学参数的空间分布特征提供参考。
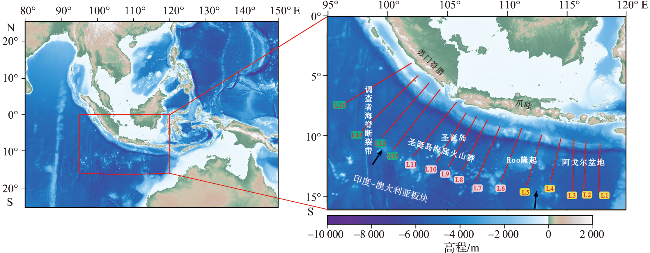
图1 南苏门答腊-爪哇海沟区域位置和水深地形图[底图数据来源于全球水深数据(www.gebco.net)。图b中的红线代表剖面位置,箭头表示板块俯冲方向。] Fig.1 Regional location and depth topographic map of South Sumatra-Java Trench [The base map data comes from global water depth data (www.gebco.net). The red lines in the Fig.b represent the position of the profiles,arrows indicate the subduction direction of tectonic plates.] |
1 数据与方法
1.1 数据
1.2 模拟方法
大地水准面的起伏变化源自岩石圈挠曲作用导致的密度异常分布。研究表明,通过将岩石圈简化为弹性薄板模型,并基于其挠曲变形特征进行数学表征,可有效实现海沟-洋坡过渡带岩石圈挠曲形态的数值模拟。MCADOO等[14]基于弹性薄板理论,采用数值积分方法构建了由弹性薄板挠曲产生的大地水准面起伏模型,积分表达式如下:
$\begin{array}{c} \Delta N(x)=\frac{-2 G}{g} \int_{-x_{0}}^{\infty}\left[\int_{d-w(\xi)}^{d}\left(\rho_{\mathrm{c}}-\rho_{\mathrm{w}}\right) \ln R \mathrm{~d} z+\right. \\ \left.\int_{d+h-w(\xi)}^{d+h}\left(\rho_{\mathrm{m}}-\rho_{\mathrm{c}}\right) \ln R \mathrm{~d} z\right] \mathrm{d} \xi+L(x) \end{array}$
其中:R= ${\left[{(x-\xi )}^{2}+{z}^{2}\right]}^{1/2}$
式中:ΔN(x)为大地水准面起伏量;x为垂直海沟轴部的水平坐标;x0为岩石圈的挠曲位置;ξ为沿垂直海沟轴方向的水平坐标变量;w(ξ) 为岩石圈在ξ处的垂向位移量;R为观测点与岩石圈挠曲所产生的密度异常体微元之间的空间距离;z为密度异常体微元的垂向坐标,用于表示地下质量分布在垂直方向上的位置; G为万有引力常数;g为重力加速度;d为未发生变形的海底面深度;h为地壳厚度(或莫霍面深度);ρc、 ρw和ρm分别为地壳、海水和地幔密度;L(x)为与局部岩石圈挠曲无关的区域尺度长波大地水准面背景项,用于补偿积分计算中未包含的深部质量异常及参考势面的影响。
积分结果为:
$\begin{array}{l} \Delta N(x)=\frac{\left(\rho_{\mathrm{m}}-\rho_{\mathrm{w}}\right) G w_{0} \alpha}{g} \cdot\left\{-2 \exp \frac{x_{0}}{\alpha} \cos \frac{x_{0}}{\alpha}-\sin \frac{x_{0}}{\alpha} \cdot\right. \\ \ln \frac{x+x_{0}}{L^{\prime}}-\exp \left(\frac{-x}{\alpha}\right)\left(\cos \frac{x}{\alpha}-\sin \frac{x}{\alpha}\right) \cdot\left\{\pi+\operatorname{Im}\left[E_{i} \cdot\right.\right. \\ \left.\left.\left(\frac{\left(x+x_{0}\right)(-1+i)}{\alpha}\right)\right]\right\}-\exp \left(\frac{-x}{\alpha}\right)\left(\cos \frac{x}{\alpha}+\sin \frac{x}{\alpha}\right) \cdot \\ \operatorname{Re}\left[E_{i}\left(\frac{\left(x+x_{0}\right)(-1+i)}{\alpha}\right)\right]+\exp \left(\frac{2 x_{0}+x}{\alpha}\right)\left(\cos \frac{2 x_{0}+x}{\alpha}+\right. \end{array}$
$\begin{array}{l} \left.\sin \frac{2 x_{0}+x}{\alpha}\right) \cdot \operatorname{Im}\left[E_{i}\left(\frac{\left(x+x_{0}\right)(1+i)}{\alpha}\right)\right]-\exp \left(\frac{2 x_{0}+x}{\alpha}\right) \cdot \\ \left.\left(\cos \frac{2 x_{0}+x}{\alpha}-\sin \frac{2 x_{0}+x}{\alpha}\right) \cdot \operatorname{Re}\left[E_{i}\left(\frac{\left(x+x_{0}\right)(-1+i)}{\alpha}\right)\right]\right\}- \\ \frac{2 \pi G}{g} w_{0} \sin \frac{x}{\alpha} \exp \left(\frac{-x}{\alpha}\right)\left[\left(\rho_{\mathrm{m}}-\rho_{\mathrm{w}}\right) d+\left(\rho_{\mathrm{c}}-\rho_{\mathrm{w}}\right) h\right] \end{array}$
Ei(ξ)= ${\int }_{\xi }^{\infty }\frac{{\mathrm{e}}^{-u}}{u}$ du
式中:Ei(ξ)为指数积分式;Im(x)和Re(x)分别为对变量x求取的虚部和实部;复数单位i无具体物理意义,用于描述由岩石圈挠曲引起的波动效应;u无直接物理意义,用于描述由于岩石圈挠曲产生的密度异常对大地水准面的远场积分效应;L'为无量纲常数,取值1 000;挠曲振幅w0= $\sqrt{2}$ exp(π/4)wb,其中wb为挠曲幅度;挠曲波长α=[4D/(ρm-ρw)g]1/4,其中挠曲刚度D=E· ${T}_{\mathrm{e}}^{3}$ /[12(1-v2)],Te为岩石圈有效弹性厚度,E为杨氏模量,v为泊松比。计算时各参数的取值见表1。
表1 计算所用参数Tab.1 Parameters used for calculation |
| 参数 | 定义/单位 | 数值 |
|---|---|---|
| ρm | 地幔密度/(kg·m-3) | 3 300 |
| ρc | 地壳密度/(kg·m-3) | 2 700 |
| ρw | 海水密度/(kg·m-3) | 1 030 |
| G | 万有引力常数/(m2·s-2·kg-1) | 6.67×10⁻¹¹ |
| E | 杨氏模量/Pa | 6.5×10¹⁰ |
| v | 泊松比 | 0.25 |
| g | 重力加速度/(m·s-2) | 9.8 |
由板块挠曲引起的大地水准面起伏的表达式(3)可作为前向模型,与经过去除长、短波长成分处理后的卫星测高大地水准面剖面在相同空间位置上进行定量比较。通过最小化理论计算值与观测值之间的残差平方和,实现对挠曲模型参数的反演约束。待定模型参数包括挠曲波长α(或岩石圈有效弹性厚度Te)、挠曲振幅w0、岩石圈挠曲位置x0以及地壳厚度h。
构建最小二乘法的正规方程时,需要获得参数α、w0、x0和h对N(x,w0,x0,α,h)的偏导数解析表达式,这些表达式是通过公式(3)对各个待定参数进行微分获得的。在参数估计过程中,要求残差平方和S达到最小,其计算公式如下:
ri=Ni-N'i
S= ${\sum }_{i=1}^{n}{r}_{i}^{2}$ = ${\sum }_{i=1}^{n}$ [(Ni-N'i(x,w0,x0,α,h)]2
式中:Ni为观测值,N'i为拟合值,ri为残差,S为残差平方和。
采用参数反演方法进行计算时,首先给定待反演参数的初始估计值集合,随后引入信赖域拟合算法,构建参数优化框架。在此框架下,各参数值通过迭代不断调整,直至残差函数达到预设收敛阈值。具体数学实现流程为:建立目标函数与约束条件的量化关系,采用非线性最小二乘准则驱动参数更新,当相邻迭代步的拟合优度变化量小于指定容差时终止计算。
在模型拟合优度评估中,定义回归平方和(SSR)与总平方和(SST)为关键量化指标。SSR的计算公式如式(7)所示,表征模型对观测系统变异的解释能力;SST的计算公式如式(8)所示,为观测数据总变异的数学度量。基于方差分析框架,构建如式(9)所示的决定系数(R2)的统计量表达式,其数学本质为SSR与SST的标准化比值。该无量纲参数的理论取值范围严格限定于[0,1]闭区间内,且与模型精度呈严格正相关:当R2趋近于1时,表明模型对观测数据的解释能力趋于完备;反之则反映拟合效能显著降低。
SSR= ${\sum }_{i=1}^{n}$ (N'i-N″)2
SST= ${\sum }_{i=1}^{n}$ (Ni-N″)2
R2= $\frac{\mathrm{S}\mathrm{S}\mathrm{R}}{\mathrm{S}\mathrm{S}\mathrm{T}}$
式中:N″表示卫星测高大地水准面的平均值。
2 模拟结果
本文基于板块弹性挠曲模型,采用非线性最小二乘反演方法,对垂直于南苏门答腊-爪哇海沟方向的15条剖面进行了大地水准面起伏模拟与参数反演。卫星测高获得的大地水准面数据经相应波长处理后,用于约束模型参数并评估模拟结果的拟合效果。剖面位置覆盖整个爪哇海沟(图1),其中剖面L1~L5位于海沟东段,剖面L6~L11位于海沟中段,剖面L12~L15位于海沟西段。为避免海山对挠曲振幅w0取值造成影响而导致挠曲模拟精度降低,剖面选取时尽量避开了大型海山,从而有效防止w0取值过大或过小而影响模拟结果精度。除海山的影响外,剖面长度对模拟结果也有一定影响:剖面太短会使模拟结果精度下降,而剖面太长会使残差平方和S不能很好地收敛。根据前人研究经验[13],本研究选择的剖面长度为约300 km。
表2 南苏门答腊-爪哇海沟岩石圈弹性薄板模拟挠曲参数Tab.2 Simulated flexural parameters of the lithospheric elastic plate model across the South Sumatra-Java Trench |
| 剖面 | 有效弹性厚度Te/km | 挠曲幅度wb/m | 挠曲位置x0/km | 等效年龄/Ma | R2 | |
|---|---|---|---|---|---|---|
| 东段 | L1 | 20.761 | 68 | 18.061 | 53.063~66.283 | 0.985 |
| L2 | 19.655 | 69 | 15.894 | 47.560~59.409 | 0.977 | |
| L3 | 21.824 | 97 | 22.547 | 58.640~73.249 | 0.997 | |
| L4 | 21.914 | 107 | 18.431 | 59.123~73.853 | 0.973 | |
| L5 | 22.572 | 124 | 35.825 | 62.728~78.356 | 0.992 | |
| 中段 | L6 | 33.998 | 151 | 73.467 | 127.307~147.760 | 0.977 |
| L7 | 27.309 | 129 | 37.180 | 91.815~114.689 | 0.984 | |
| L8 | 32.950 | 125 | 72.051 | 123.663~146.964 | 0.988 | |
| L9 | 25.821 | 81 | 34.765 | 82.085~102.535 | 0.926 | |
| L10 | 24.269 | 86 | 29.073 | 72.512~90.577 | 0.973 | |
| L11 | 30.608 | 192 | 76.497 | 115.343~126.079 | 0.991 | |
| 西段 | L12 | 23.391 | 111 | 25.834 | 67.361~84.143 | 0.976 |
| L13 | 24.845 | 101 | 32.064 | 75.993~94.926 | 0.998 | |
| L14 | 15.263 | 41 | 4.594 | 28.680~35.825 | 0.856 | |
| L15 | 21.160 | 69 | 31.833 | 55.125~68.858 | 0.972 | |
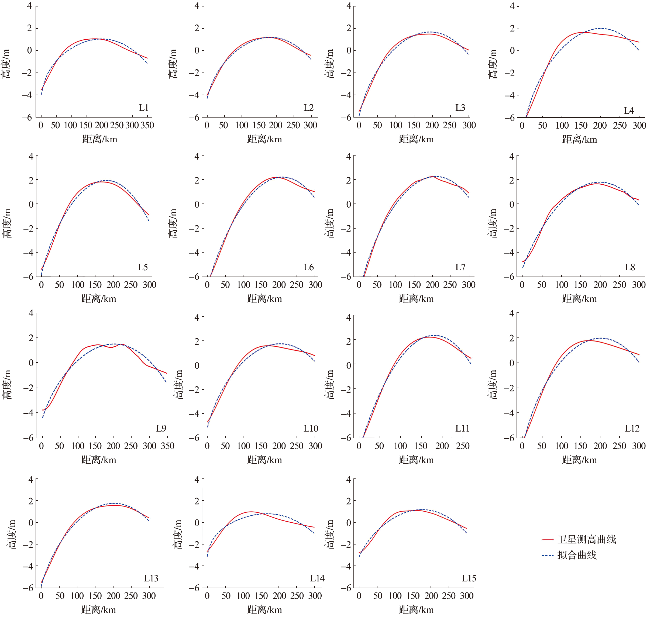


此外,研究区内不同构造区域的模型参数呈现明显差异。海沟东段的挠曲幅度约为68~124 m,中段约为81~192 m,西段约为69~111 m;海沟东段的挠曲位置距俯冲轴约为16~36 km,中段约为29~76 km,西段约为26~32 km(表2)。通过模型反演获得各剖面的岩石圈有效弹性厚度(Te),东段约为20~23 km,中段约为24~34 km,西段约为21~25 km(表2)。反演得到的 Te值与前人的研究结果基本一致[12-13],表明本研究方法具有较好的可靠性。在此基础上,根据岩石圈有效弹性厚度(Te)和岩石圈年龄(t)之间的关系式:Te =(2.70±0.15)t1/2(Te的单位为km , t 的单位为Ma)[18],对研究区岩石圈年龄进行了反演估计,结果约为48~148 Ma(表2)。
3 分析与讨论
南苏门答腊-爪哇海沟构造体系受控于印度-澳大利亚板块向亚欧板块的持续俯冲作用,其构造演化过程与两板块间构造活动的起始时间具有对应关系。南苏门答腊-爪哇海沟洋壳平均年龄约为90 Ma[19],而本研究反演得到与岩石圈强度分布相关的等效年龄范围为48~148 Ma。值得注意的是,海沟东段剖面的反演年龄大多集中在48~78 Ma,明显低于MÜLLER等[19]根据全球洋壳年龄模型给出的该区域洋壳平均年龄(约为120 Ma)。这种差异可能反映了板块撕裂带活动与地幔上涌流体对局部热结构及岩石圈强度的影响。板块撕裂形成的薄弱带为深部高温地幔物质上涌提供了通道,这些上涌的流体显著加热了上覆岩石圈,导致其局部热结构发生改变,从而降低了岩石圈的有效弹性厚度,使其力学行为上表现为较“年轻”的特征。模拟结果显示,海沟中段的岩石圈有效弹性厚度较大(约为24~34 km),而东、西两侧相对较小(约为20~25 km),推测与周围地质构造演化过程的差异有关。
3.1 海沟东段
海沟东段的挠曲幅度(wb)约为68~124 m,挠曲位置(x0)约为16~36 km,岩石圈有效弹性厚度(Te)约为20~23 km。海沟东段1~5号剖面的洋坡以典型的深海盆地地貌为主,近海沟区域缺乏大型海山或海底高地等显著局部地形体,该区海沟前缘受到的局部附加载荷相对较弱。因此,东段各剖面的wb与x0整体变化不大,挠曲形态表现出相对平缓的特征。
3.2 海沟中段
海沟中段的挠曲幅度(wb)约为81~192 m,挠曲位置(x0)约为29~76 km,岩石圈有效弹性厚度(Te)约为24~34 km,明显大于海沟东段。中段各剖面的 Te值普遍较大,表明该区板块在区段尺度上具有较强的整体刚性。但不同剖面的wb和 x0值仍存在明显差异,表明海沟挠曲特征受到局部构造因素的显著影响。在海沟中段,板块未受地幔热上涌影响,且不存在板块缺口,加之海山或海底高原的侵入增强了板块整体稳定性,从而形成较大的Te值;与此同时,当海山或海底高原接近海沟时,其较大的浮力和刚性会改变板块前缘的应力分布和弯曲形态[21-22]。海沟中段邻近 Roo 隆起,该隆起的存在进一步加强了海沟前缘的局部应力集中,使部分剖面(P6、P8、P11)出现更大的挠曲幅度和更向洋侧偏移的挠曲位置,而其他剖面(P9、P10)则表现较弱。
3.3 海沟西段
海沟西段的挠曲幅度(wb)约为69~111 m,挠曲位置(x0)约为26~32 km,岩石圈有效弹性厚度(Te)约为21~25 km。整体上,西段各剖面的挠曲参数变化较小,表明该区海沟前缘挠曲形态较为稳定。与中段相比,西段的 Te、wb和x0值整体均偏小,表明该区岩石圈整体力学强度较弱,且海沟前缘挠曲变形相对有限。
海沟西段属于南苏门答腊海沟,板块俯冲方向由垂直于爪哇海沟的近垂向俯冲逐渐转为沿苏门答腊走向的斜向俯冲[23]。该区域俯冲板块较东段明显较年轻(约为60 Ma[24]),根据岩石圈热演化规律,较年轻板块通常具有较高的温度和较小的岩石圈有效弹性厚度,这可能是其Te值偏低的重要原因之一。此外,该处板块俯冲速率仅57 mm/a[20]。较慢的俯冲速率使得板块前缘所受的整体弯曲变形较弱,这造就了西段较小的wb和x0值。同时,西段所处的斜向俯冲构造环境较为复杂,区域断裂构造和构造分段性发育。持续的构造活动可能促进岩石圈内部破裂累积,并伴随流体参与对板块力学性质的改造,从而使该区表现出较低的Te值。总体来看,海沟西段表现出整体刚度较弱、挠曲响应偏弱、构造影响较复杂的特征。其较小的 Te值可能与年轻板块及构造改造有关,而较小的 wb和x0值则反映出该区板块前缘弯曲作用总体较弱。
4 结论
本文基于水深、地壳厚度及大地水准面数据,利用弹性薄板理论推导的大地水准面起伏公式,结合最小二乘法对南苏门答腊-爪哇海沟的大地水准面进行拟合,模拟其挠曲特征与岩石圈有效弹性厚度,并探讨导致海沟东、中、西段差异的主要地质构造因素。结果表明,南苏门答腊-爪哇海沟的挠曲位置约为16~76 km,挠曲幅度约为68~192 m,岩石圈有效弹性厚度约为20~34 km。本研究为准确评估南苏门答腊-爪哇俯冲带岩石圈力学参数的空间分布提供了参考。基于模拟结果,得出以下三点认识。
1)海沟东段表现为相对稳定但局部弱化的挠曲特征,挠曲幅度(68~124 m)和挠曲位置(16~36 km)参数变化范围较小,岩石圈有效弹性厚度(20~23 km)整体偏低。推测是下地幔的热上涌导致了岩石圈软化,显著削弱了其抵抗挠曲变形的能力。
2)海沟中段表现出显著的挠曲响应,挠曲幅度(81~192 m)和挠曲位置(29~76 km)变化范围较大,岩石圈有效弹性厚度(24~34 km)相对较高。中段较大的 Te 值表明该区岩石圈在区段尺度上具有较强的整体刚性;同时,不同剖面之间 wb和 x0 值的变化较为明显,说明其挠曲几何形态还受到邻近海山、海底高地及 Roo 隆起等局部构造条件的影响。总体上,中段较大的 Te 值主要反映岩石圈整体弯曲刚度较强,而局部挠曲差异则更多受局部加载和应力分布变化控制。
3)海沟西段表现为相对较弱的挠曲响应,挠曲幅度(69~111 m)、挠曲位置(26~32 km)参数变化范围较小,岩石圈有效弹性厚度(21~25 km)相对较低。该段较低的 Te 值可能与较年轻板块的热状态、斜向俯冲背景下的构造活动以及可能的流体改造有关,但由于该段板块下沉较浅、拉张作用有限,其整体挠曲幅度仍相对较小。