Seasonal variability and its influencing factors of ocean bottom pressure in the Arabian Sea

  • ZHANG Kun , 1, 2 ,
  • ZHANG Tao 1, 2 ,
  • WU Binjie 1, 2 ,
  • ZHANG Deng 1, 2 ,
  • ZHENG Hua 1, 2 ,
  • DING Ruibin 1, 2
Expand
  • 1 Second Institute of Oceanography, MNR, Hangzhou 310012, China
  • 2 Technology Innovation Center for Marine Intelligent Observation, MNR, Hangzhou 310012, China

Received date: 2025-07-01

  Revised date: 2025-10-25

  Online published: 2026-03-03

Abstract

The study of ocean bottom pressure (OBP) is great significance for understanding the mechanisms of sea level budget changes and deep ocean circulation. Based on 23 years of OBP data observed by the Gravity Recovery and Climate Experiment (GRACE) satellites, this study systematically reveals the spatiotemporal characteristics and mechanism of OBP variations in the Arabian Sea. There is a strong OBP oscillation center in the central area of the Arabian Sea. The OBP changes throughout the region are unified in space and time. It has significant seasonal variation features, showing a double-peak structure of negative anomalies in winter (January to March) and positive anomalies in summer (July to September). Combining the reanalysis data of ERA5, it is found that there is a dynamic divergence mechanism of OBP oscillation between the northern and southern areas of the Arabian Sea. The southern area is dominated by wind stress curl, with a negative correlation response leading OBP by 30° (about 1 month). The northern area is regulated by the wind-driven Ekman process, with Ekman pumping/suction leading by 1 month to trigger a positive correlation. This divergence mechanism is attributed to the boundary constraint effect of the meridional mean atmospheric pressure standard deviation. The impact of the Indian Ocean Dipole (IOD) on OBP shows seasonal asymmetry: in summer, OBP is significantly correlated with the dipole mode index (DMI) leading by 6 months, while in winter, the correlation between the mean OBP and the DMI in each mounth is not significance.

Cite this article

ZHANG Kun , ZHANG Tao , WU Binjie , ZHANG Deng , ZHENG Hua , DING Ruibin . Seasonal variability and its influencing factors of ocean bottom pressure in the Arabian Sea[J]. Journal of Marine Sciences, 2026 , 44(1) : 83 -92 . DOI: 10.3969/j.issn.1001-909X.2026.01.007

0 引言

海底压强(ocean bottom pressure, OBP)是海洋学的基本物理量之一[1-2],其定义为单位面积上海底至水面的垂向水柱与上方大气的质量负载总和[3-5],是诊断海平面收支、水循环及气候系统能量平衡的关键指标[6-7]。海底压强变化与海平面变化密切相关,全球范围内海底压强变化对全球平均海平面上升的贡献率约占60%[8]。通过锚系在海底的压力计观测可以得到海底压强定点数据[9-11],而2002年发射的重力恢复与气候实验卫星(Gravity Recovery and Climate Experiment, GRACE),通过监测地球重力场变化(可等效为全球水层厚度变化),首次实现了全球海底压强的直接反演[12-13]。
海底压强变化反映了海水质量负载对外界驱动的正压响应[14-16]。国内外海洋学者基于模式或观测数据[17-21]发现,在南大洋[7]、南印度洋[17]和南太平洋[18]等海域,海底压强均呈现较强的季节变化特征,但其影响因素各不相同。高分辨率的现场观测表明,部分海域的海底压强存在近5天[10]、近13天[20]等短周期振荡性变化,并且该变化还能够反映海洋中的波动信号[14]。
根据前人的研究,海底压强时空变化主要受风生环流、全球水文循环(冰川消融/陆地径流)以及海面气压等三大动力因素驱动[8,22-23]。例如,太平洋海底压强的年际变化主要受风驱动埃克曼输运导致的水体辐合所控制,而局地风变化源于大气遥相关[24-26];南半球环状模(Southern Annular Mode,SAM)和厄尔尼诺-南方涛动(El Niño-Southern Oscillation,ENSO)对南太平洋海底压强的影响显著[18];南印度洋海底压强的季节变化与埃克曼输运导致的水体辐合有关[27-28],并且受到南半球环状模、南方涛动(Southern Oscillation,SO)和印度洋偶极子(Indian Ocean Dipole,IOD)的重要影响[17]。
印度洋可分为阿拉伯海、孟加拉湾和南印度洋三大海域,其整体海底压强不仅具有显著的季节变化特征,并且在赤道两侧存在显著差异[17,27]。阿拉伯海地处南亚大陆与非洲大陆之间,既是全球航运枢纽海域之一,也是重要的海洋研究区域。目前针对阿拉伯海海底压强的相关研究较少,其主要特征和动力机制尚不清晰。本文基于为期23年的GRACE卫星观测海底压强数据,研究阿拉伯海海底压强的变化特征和影响因素,并探讨其动力机制。

1 数据和方法

1.1 数据

本文使用的海底压强数据来自GRACE卫星,数据版本为RL06,该数据经新型马斯康网格、卫星重力优化方法处理,时间范围为2002年4月—2024年12月,时间分辨率为1个月,空间分辨率为0.25°×0.25°。
本文使用的海表面大气压和风场数据来自ECMWF(European Centre for Medium-range Weather Forecasts)发布的ERA5再分析资料(http://www.ecmwf.int/),该数据集包括海表面大气压和10 m高度风速,空间分辨率为0.25°×0.25°,时间分辨率为1个月。
印度洋偶极子指数(dipole mode index, DMI, https://psl.noaa.gov/data/timeseries/month/DMI/)是衡量印度洋东西部海表温度差异的一个重要气候指标,本文将利用该指标研究IOD对阿拉伯海海底压强的影响。

1.2 方法

为分析风对阿拉伯海海底压强变化的影响机制,本文基于ERA5风场数据计算了研究区的风应力旋度和埃克曼抽吸,相关公式[29-30]如下:
$\nabla \times \vec{\tau}=\frac{\partial \tau_{y}}{\partial x}-\frac{\partial \tau_{x}}{\partial y}$
$\overrightarrow{\tau }$=Kz·ρair· ${\overrightarrow{v}}_{10}$· $\left|{\overrightarrow{v}}_{10}\right|$
式中:Ñ×为二维旋度算子; $\overrightarrow{\tau }$为风应力矢量;τx和τy分别为纬向和经向风应力;Kz表示海-气界面的粘性系数,受风速大小、海表粗糙度等因素影响,本文取大洋海-气界面粘性系数值,为1.5×10⁻³ m2/s;ρair为海表大气密度,取常数1.225 kg/m3; ${\overrightarrow{v}}_{10}$为10 m高度风速矢量, $\left|{\overrightarrow{v}}_{10}\right|$为10 m高度风速标量,数据来自ERA5再分析资料。
根据TALLEY等[31]的计算方法,本文计算了阿拉伯海埃克曼层内各网格点的单位埃克曼输运及埃克曼抽吸垂向速度:
$\begin{array}{c}{\overrightarrow{U}}_{E}=\int \overrightarrow{v}\left(z\right)dz=\frac{1}{\rho f}(\overrightarrow{\tau }\times \overrightarrow{z})\end{array}$
$\frac{\partial U_{\mathrm{E}}}{\partial x}+\frac{\partial V_{\mathrm{E}}}{\partial y}=\nabla \cdot \vec{U}_{\mathrm{E}}=-\left(w_{\text {surface }}-w_{\mathrm{E}}\right)=w_{\mathrm{E}}$
式中: ${\overrightarrow{U}}_{E}$表示单位埃克曼输运;ρ为海水密度,取常数1 024 kg/m3; f为科氏参数; $\overrightarrow{\tau }$为风应力矢量; $\overrightarrow{z}$为海面所在平面的单位法向量; $\overrightarrow{v}$为埃克曼层的水平埃克曼流速;UE和VE分别是东向和北向的埃克曼输运分量;wsurface为海表面的垂向流速,取值0 m/s;wE为埃克曼抽吸垂向速度。
本文采用功率谱分析方法,对海底压强信号在各个频段上的能量分布特征进行定量分析,进而提取反映海底压强变化的关键周期波动信号及相关特征信息。能谱密度,也称作功率谱密度(power spectral density, PSD),其定义如下:
S(ω)= ${\left|Y\left(\omega \right)\right|}^{2}$
式中:S(ω)表示能谱密度,Y(ω)为离散傅里叶变换(discrete-time Fourier transform, DTFT)的谱系数。能谱密度的大小反映海底压强信号在不同频率下的波动强度;而海底压强的相位变化速率与波动周期成反比,其相位在一个完整周期内变化 360°。
利用交叉谱分析海底压强观测数据(GRACE)和再分析资料(ERA5)两组时间序列之间的相关度、相位差和增益。首先对两组时间序列进行去趋势处理,采用长度为64个数据点的滑动窗,以50%的重叠率进行分段计算,再根据NAYAK等[32]的方法对计算结果进行平滑处理。

2 结果与分析

2.1 海底压强变化的时空特征

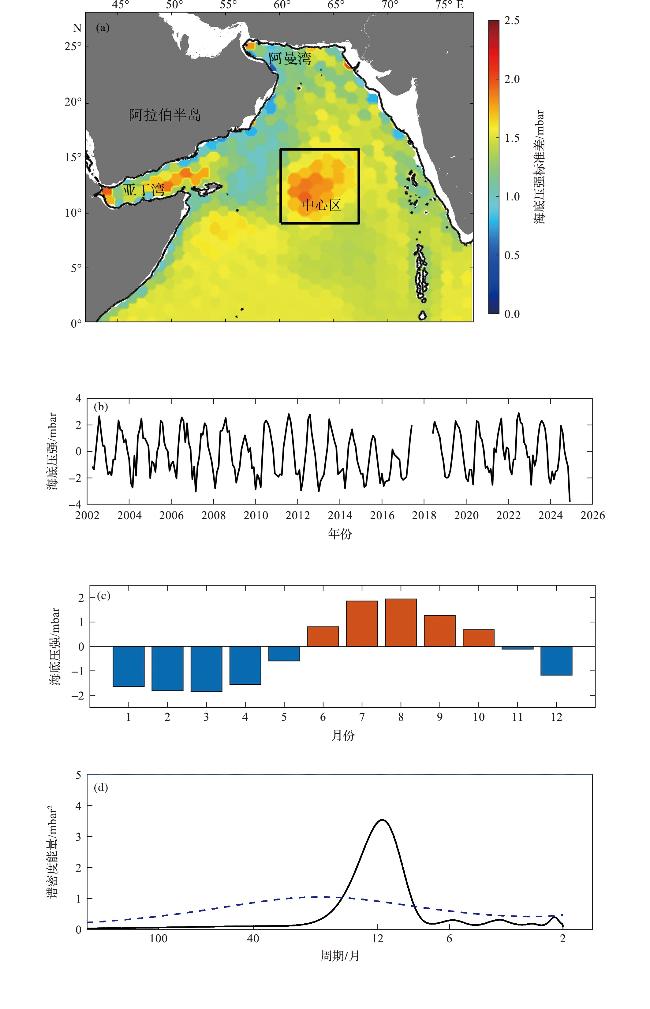
阿拉伯海海底压强多年(2002—2024年)标准差的空间分布如图1a所示。阿拉伯海全海域海底压强的多年平均标准差约为1.3 mbar;中心区(60°E—67°E, 9°N—16°N)波动较强,最大标准差约为2 mbar;中心区至阿拉伯半岛沿岸海域之间存在一个低振幅海底压强变化带;中心区以南海域的标准差值变化幅度较小,基本等于该海域的平均值。
图1 GRACE卫星观测的海底压强多年(2002—2024年)标准差(a),中心区平均海底压强的时间序列(b)、逐月平均值(c)和能谱密度(d)

(图a中的黑色等值线为200 m等深线;图b中缺失的数据采用线性插值法补全,其中2017年7月至2018年5月段的缺失数据未作插值处理;图d中的蓝色虚线表示95%置信区间。)

Fig.1 The multi-year (2002-2024) standard deviation of ocean bottom pressure observed by GRACE satellites at the Arabian Sea (a), time series of the mean ocean bottom pressure (MOBP) (b), multi-year monthly average variation (c), and power spectral density (d) in the central area

(The black contour lines in Fig.1a represent the 200 m isobaths; the missing data in Fig.1b are filled by linear interpolation, except for the missing data from July 2017 to May 2018,which is not interpolated; the blue dotted line in Fig.1d indicates the 95%confidence interval.)

中心区内平均海底压强(mean ocean bottom pressure,MOBP)具有较显著的季节性特征,其在6月—10月呈正异常,12月—次年5月呈负异常,即在阿拉伯海所处的北半球,夏季和冬季分别对应着显著的正、负异常振荡(图1b和1c)。能量谱分析结果显示(图1d),在周期为12个月时,谱密度能量值最大(通过95%置信水平的显著性检验),并且除此之外无其他显著谱峰。
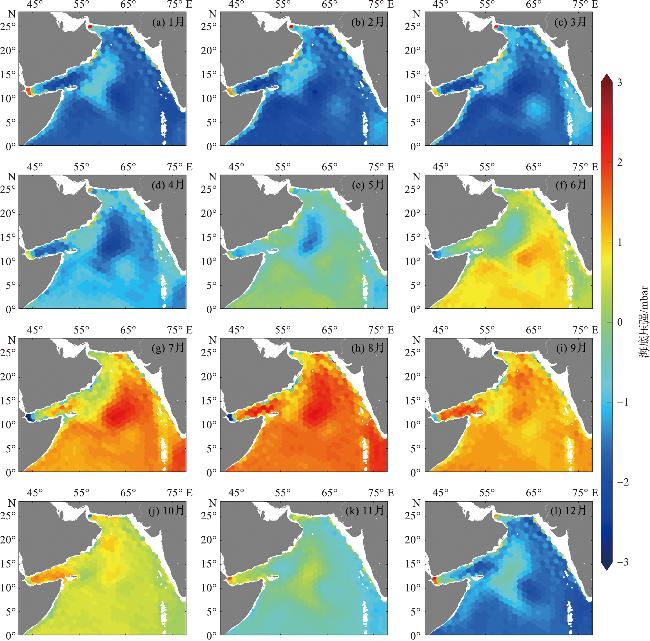
图2显示,海底压强的月际变化特征与图1c一致:1月—3月(冬季),海底压强呈负异常,最大值为-3.3 mbar,高值区随时间从中心向西北方向偏移;7月—9月(夏季),海底压强呈正异常,最大值为3.4 mbar,高值区稳定,随时间无明显移动趋势。阿拉伯海海底压强的时间演变在空间上具有一致性,中心海区的振幅较大,冬季平均值约为-1.65 mbar,夏季平均值约为1.54 mbar;中心区至阿拉伯半岛之间的海底压强变动振幅较小。该空间格局与海底压强标准差分布(图1a)高度吻合。
图2 海底压强逐月平均空间分布(2002—2024年)

Fig.2 The spatial distribution of the monthly mean OBP (2002-2024)

此外,在亚丁湾和阿曼湾的边界区域,海底压强信号相较于阿拉伯海开阔海域表现出明显的相位差异(图2)。这一现象可能部分源于GRACE卫星在近岸区域的反演精度限制。特别地,亚丁湾海底压强信号呈现出的不连续特征,推测可能受到局地复杂的风应力旋度及埃克曼抽吸过程的调控,其具体机制将在下文进一步分析。

2.2 海底压强季节变化的动力机制

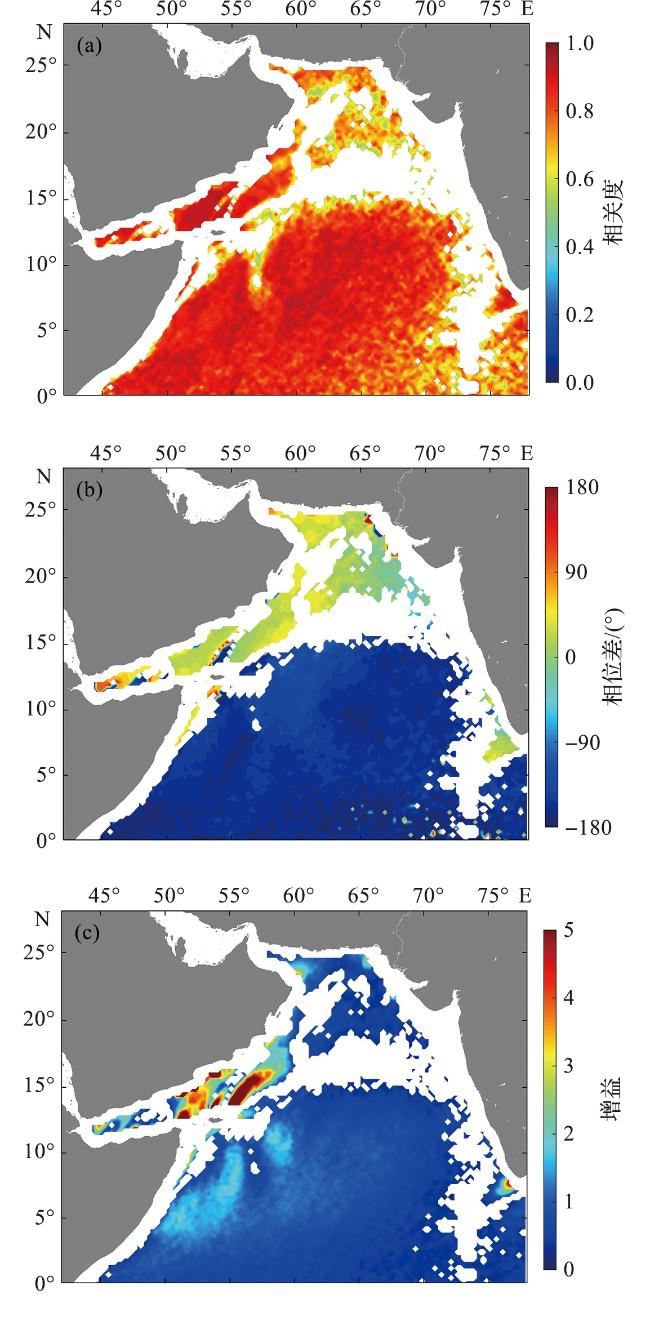
为研究阿拉伯海海底压强季节变化的动力机制,本文计算了区域的风应力旋度,并采用交叉谱分析方法解析了海底压强与风应力旋度的耦合特征。在阿拉伯海大部分海域,海底压强与风应力旋度的相关度显著(超过95%置信水平,图3a)。在阿拉伯海的中南部海域,海底压强与风应力旋度的相位差约为-150°,印证了二者间的负相关关系[7,20],且风应力旋度领先海底压强约30°相位(相当于周期上超前1个月)。在阿拉伯海北部海域,海底压强与风应力旋度的相位差约为40°,与中南部海域明显不同(图3b)。除亚丁湾外,阿拉伯海海底压强对风应力旋度的增益响应基本一致(图3c)。
图3 海底压强与风应力旋度的相关度(a)、相位差(b)以及风应力旋度对海底压强的增益(c)

(填色区域的数据通过95%置信水平的显著性检验。)

Fig.3 Correlation between OBP and wind stress curl (a), phase difference (b), and gain of OBP by wind stress curl (c)

(The data in the shaded area passes the significance test at the 95%confidence level.)

值得关注的是,阿拉伯海中北部存在SW—NE走向的条带,其海底压强与风应力旋度的相关性未达到95%置信水平(图3),本文将该条带的平均中轴线定义为BL线。该线南北两侧的风应力旋度相位呈现约180°突变,暗示BL线两侧可能存在截然不同的风-压耦合过程。
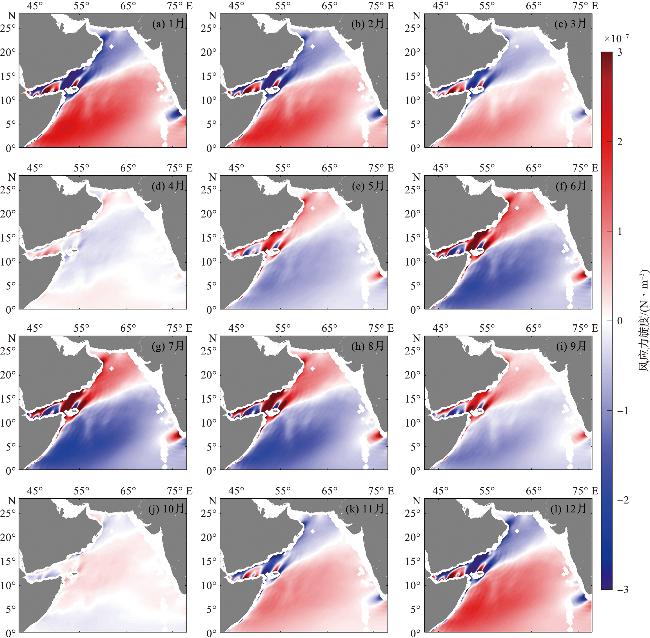
图4显示,阿拉伯海风应力旋度呈南、北反相位空间分布,其零值线的月际摆动幅度小,且位置始终邻近BL线,尤其是在夏季和冬季,与BL线高度重合。风应力旋度值在12月—次年2月(冬季)和6月—8月(夏季)较大,与海底压强的振幅峰值相比(图2),其峰值出现时间约超前1个月。在BL线南侧,冬季风应力旋度正异常对应海底压强负异常,夏季风应力旋度负异常对应海底压强正异常,表现出明显的反位相耦合特征。该现象不仅印证了风应力旋度与海底压强之间的超前负相关关系,也与两者相位差所揭示的物理机制一致,进一步证实了BL线作为阿拉伯海多尺度动力过程分界带的关键调制作用。
图4 阿拉伯海风应力旋度月平均空间分布图

Fig.4 The monthly mean spatial distribution maps of wind stress curl

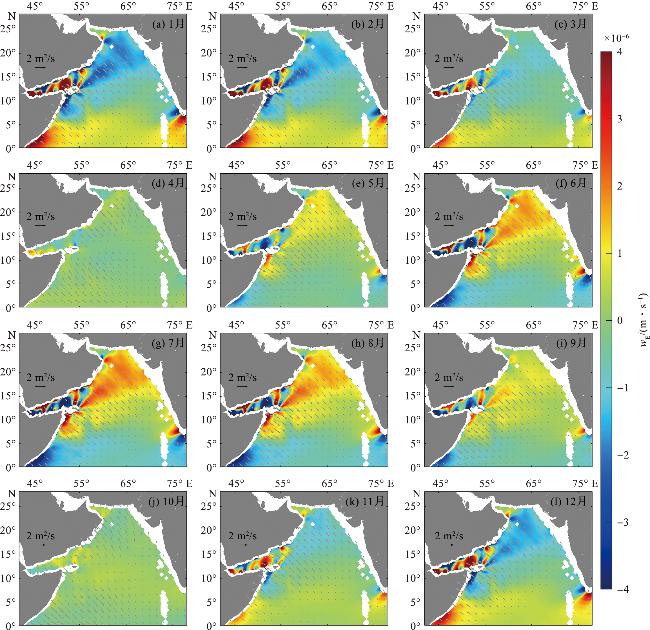
为深入探究阿拉伯海北部海底压强的动力驱动机制,本文根据公式(1)~(4),计算得到埃克曼输运和埃克曼抽吸垂向速度(wE,向下为正)。图5显示,在阿拉伯海北部,wE在12月—次年2月(冬季)和6月—8月(夏季)出现峰值,其峰值时间超前海底压强峰值约1个月。具体表现为:冬季埃克曼输运呈西北向辐聚,伴随wE负异常,同步引发海底压强负异常;夏季埃克曼输运呈东南向辐散,伴随wE正异常,驱动海底压强正异常。该过程表明,wE的变化超前海底压强变化约1个月(相当于30°相位),这与风应力旋度的相位特征一致(图4)。
图5 埃克曼输运和埃克曼抽吸垂向速度(wE)的月平均空间分布

(埃克曼输运以矢量箭头表示;wE以颜色等值表示,向下为正。)

Fig.5 The monthly mean spatial distribution of the Ekman transport and Ekman pumping/suction vertical velocity(wE)

(Ekman transport is represented by vector arrows; wE is represented by color contour, downward showing positive values.)

图5显示,在BL线以北(北部海域),wE的月际变化与海底压强(图2)一致,其中12月—次年2月负异常最强,6月—8月正异常最强,且wE的变化超前海底压强约1个月。wE变化强振幅区的南边界与BL线高度重合,证实了风生埃克曼抽吸对该区域海底压强变化的主导作用。BL线以南海域的wE与海底压强的相关性显著减弱,表明该区域的海底压强变化受其他动力机制调控。此外,亚丁湾海域的wE呈现复杂的非均匀空间分布,与风应力旋度分布特征相似,进一步佐证了该海域海底压强变化受多因子耦合驱动。
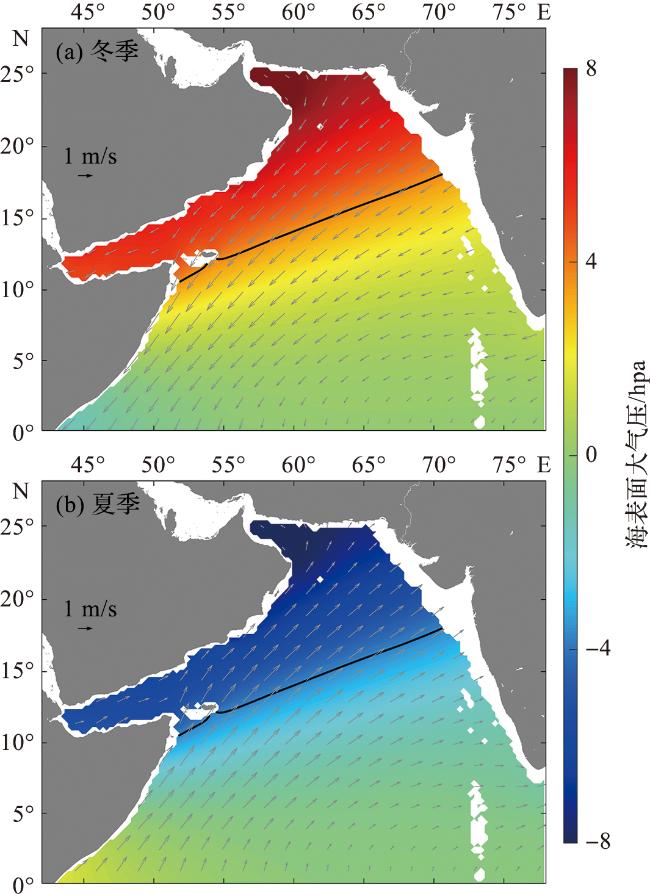
在理想海洋流体静力平衡状态下,海平面通过逆气压效应(inverted barometer effect,简称 IB效应)可完全抵消大气压负载变化:大气压每增/减1 hPa,海面高度相应降/升1 cm,从而使海底压强变化趋于零。图6显示,阿拉伯海冬季盛行东北风,北部海域海表面大气压呈显著正异常;夏季盛行西南风,北部海域海表面大气压转为显著负异常。虽然阿拉伯海海底压强与风应力旋度显著相关(图3a),但其与大气压无显著相关性,这表明海底压强并未随大气压产生正压响应,符合开阔大洋IB效应规律。然而,由于大气压梯度与风场存在显著耦合,当海底压强与风场相干性较高时,大气压梯度会通过调制风应力方向与旋度间接影响海底压强。值得注意的是,经向平均大气压标准差等值线(±3.7 hPa)与BL线高度吻合,风应力旋度在该动力边界线的南、北两侧呈现反相位分布(图4)。BL线以北受半封闭陆海边界约束,冬季的东北风引发埃克曼输运辐聚与wE负异常,夏季的西南风导致埃克曼输运辐散与wE正异常;BL线以南的开阔海域,风生埃克曼输运能量易耗散,难以形成显著埃克曼抽吸效应。这种边界调控下的动力分异,从根本上解释了BL线南、北两侧海底压强响应机制的异质性。
图6 2002—2024年阿拉伯海多年平均的冬季(12月—2月)和夏季(6月—8月)海表面大气压和风场空间分布

[填色表示海表面大气压,箭头表示风速矢量,黑色等值线表示经向平均大气压标准差 (±3.7 hPa)。]

Fig.6 The spatial distribution of the multi-year average sea surface atmospheric pressure and wind field in the Arabian Sea during winter (December to February) and summer (June to August) from 2002 to 2024

[The colors indicate sea surface atmospheric pressure and the arrows indicate wind velocity vectors. The black contour represents the standard deviation of meridional mean sea surface atmospheric pressure (±3.7 hPa).]

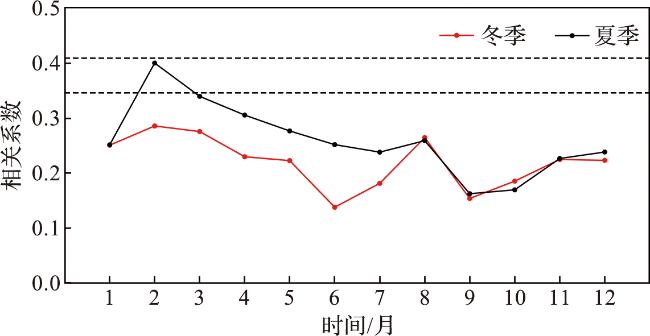
印度洋偶极子与印度洋的许多动力过程对区域和全球的气候变化都有着重要影响。印度洋偶极子通过罗斯贝波促进了南印度洋异常反气旋的生成,从而导致海底压强在冬季异常增强[17]。如图7所示,夏季平均海底压强与2月的DMI存在较强相关性(相关系数为0.40),而冬季平均海底压强与各月DMI的相关性均未通过90%置信水平的显著性检验,表明印度洋偶极子对阿拉伯海海底压强的影响呈现季节不对称性,且DMI显著相关月份超前夏季平均海底压强约6个月。这一结果与印度洋偶极子对南印度洋海底压强影响的特性相反[17],凸显了区域动力响应的独特性。
图7 冬/夏季平均海底压强与各月DMI的相关系数

(夏季平均海底压强指7月—9月的平均值,冬季为1月—3月的平均值。其中上下两条黑色虚线分别表示95%和90%置信水平。)

Fig.7 The correlation coefficients of the averaged MOBP in winter and summer with the DMI for each month

(The average bottom pressure in summer refers to the mean value of July to September, and that in winter is the average of January to March. The upper and lower black dashed lines represent the 95%and 90%confidence levels, respectively.)

3 总结

本文基于2002—2024年GRACE卫星观测的海底压强数据,分析了阿拉伯海海底压强的时空变化特征及其动力机制。在阿拉伯海的中心海区,存在一个较强的海底压强振荡中心,最大标准差约为2 mbar,而阿拉伯海全域的海底压强平均标准差约为1.3 mbar。全海域海底压强的时间变化具有空间一致性。研究海域海底压强的季节变化特征显著,冬季(1月—3月)负异常变化幅度最大,夏季(7月—9月)正异常变化幅度最大。海底压强能量谱分析证实,12个月的周期为唯一通过95%置信水平检验的显著振荡模态。在亚丁湾等边界区,受局地复杂风应力旋度、埃克曼抽吸及GRACE近岸反演精度限制等因素的共同影响,海底压强呈现相位偏移与数据不连续现象。
阿拉伯海海底压强的季节变化主要受风场驱动,但南、北海域动力驱动机制不同,南部主要受风应力旋度主导,北部受控于风生埃克曼抽吸的影响。这条分割了阿拉伯海南、北海域的分界线(即BL线),与海区经向平均大气压标准差等值线(±3.7 hPa)高度重叠。在BL线南侧,冬(夏)季风应力旋度正(负)异常对应海底压强负(正)异常,并且风应力旋度超前海底压强约30°相位(相当于周期超前1个月),揭示了风应力旋度与海底压强存在超前负相关关系。而在BL线北侧,冬季埃克曼输运呈西北向辐聚,伴随wE负异常,同步引发海底压强负异常;夏季则转为埃克曼输运东南向辐散和wE正异常,对应引发海底压强正异常。并且,wE同样超前海底压强约30°相位,揭示了埃克曼抽吸wE与海底压强间的超前正相关关系。
与南印度洋海底压强振荡机制相较,阿拉伯海与其均受到埃克曼过程的影响,但南印度洋海底压强同时受南方涛动、印度洋偶极子及南半球环状模等多因子调控,而阿拉伯海则呈现出独特的BL线双侧异质耦合模式。另外,印度洋偶极子对阿拉伯海海底压强的影响呈现季节不对称性:夏季平均海底压强与超前6个月的偶极子指数呈显著相关,而冬季的相关性则不显著。
[1]
EBLE M C, GONZALEZ F I. Deep-ocean bottom pressure measurements in the northeast Pacific[J]. Journal of Atmospheric and Oceanic Technology, 1991, 8(2): 221-233.

DOI

[2]
QUINN K J, PONTE R M. Estimating high frequency ocean bottom pressure variability: High frequency ocean bottom pressure[J]. Geophysical Research Letters, 2011, 38(8): L08611.

[3]
PONTE R M. A preliminary model study of the large-scale seasonal cycle in bottom pressure over the global ocean[J]. Journal of Geophysical Research: Oceans, 1999, 104(C1): 1289-1300.

[4]
GILLA E, NILLER P P. The theory of the seasonal variability in the ocean[J]. Deep Sea Research and Oceanographic Abstracts, 1973, 20(2): 141-177.

DOI

[5]
STEPANOV V N, HUGHES C W. Propagation of signals in basin-scale ocean bottom pressure from a barotropic model[J]. Journal of Geophysical Research: Oceans, 2006, 111(C12): 2005JC003450.

[6]
CHENG X H, LI L J, DU Y, et al. Mass-induced sea level change in the northwestern North Pacific and its contribution to total sea level change[J]. Geophysical Research Letters, 2013, 40(15): 3975-3980.

DOI

[7]
XIONG X Q, CHENG X H, OU N S, et al. Dynamics of seasonal and interannual variability of the ocean bottom pressure in the Southern Ocean[J]. Acta Oceanologica Sinica, 2022, 41(5): 78-89.

[8]
CHAMBERS D P, CAZENAVE A, CHAMPOLLION N, et al. Evaluation of the global mean sea level budget between 1993 and 2014[J]. Surveys in Geophysics, 2017, 38(1): 309-327.

DOI

[9]
BROWN W, MUNK W, SNODGRASS F, et al. MODE bottom experiment[J]. Journal of Physical Oceanography, 1975, 5(1): 75-85.

DOI

[10]
LUTHER D S. Evidence of a 4-6 day barotropic, planetary oscillation of the Pacific Ocean[J]. Journal of Physical Oceanography, 1982, 12(7): 644-657.

DOI

[11]
DONOHUE K, WATTS D R, TRACEY K, et al. Program studies the Kuroshio Extension[J]. Eos, Transactions American Geophysical Union, 2008, 89(17): 161-162.

[12]
SAVE H, BETTADPUR S, TAPLEY B D. High-resolution CSR grace RL05 mascons[J]. Journal of Geophysical Research: Solid Earth, 2016, 121(10): 7547-7569.

DOI

[13]
SAVE H, BETTADPUR S, NAGEL P, et al. Mascon estimation strategies for CSR GRACE RL06 and GRACE-FO gravity fields[J]. Geophysical Research Abstracts, 2019, 21: EGU2019-11963.

[14]
MATHERS E L, WOODWORTH P L. Departures from the local inverse barometer model observed in altimeter and tide gauge data and in a global barotropic numerical model[J]. Journal of Geophysical Research: Oceans, 2001, 106(C4): 6957-6972.

[15]
FU L L. Wind-forced intraseasonal sea level variability of the extratropical oceans[J]. Journal of Physical Oceanography, 2003, 33(2): 436-449.

DOI

[16]
HIROSE N, FUKUMORI I, ZLOTNICKI V, et al. Modeling the high-frequency barotropic response of the ocean to atmospheric disturbances: Sensitivity to forcing, topography, and friction[J]. Journal of Geophysical Research: Oceans, 2001, 106(C12): 30987-30995.

[17]
NIU Y T, CHENG X H, QIN J H, et al. Mechanisms of interannual variability of ocean bottom pressure in the southern Indian ocean[J]. Frontiers in Marine Science, 2022, 9: 916592.

DOI

[18]
QIN J H, CHENG X H, YANG C C, et al. Mechanism of interannual variability of ocean bottom pressure in the South Pacific[J]. Climate Dynamics, 2022, 59(7): 2103-2116.

DOI

[19]
PARK J H, WATTS D R. Response of the southwestern Japan/East Sea to atmospheric pressure[J]. Deep Sea Research Part II: Topical Studies in Oceanography, 2005, 52(11-13): 1671-1683.

DOI

[20]
NA H N, PARK J H, WATTS D R, et al. Near 13 day barotropic ocean response to the atmospheric forcing in the North Pacific[J]. Journal of Geophysical Research: Oceans, 2012, 117(C12): 2012JC008211.

[21]
PARK J H, WATTS D R, DONOHUE K A, et al. A comparison of in situ bottom pressure array measurements with GRACE estimates in the Kuroshio Extension[J]. Geophysical Research Letters, 2008, 35(17): 2008GL034778.

[22]
CAZENAVE A, CABANES C, DOMINH K, et al. Present-day sea level change: Observations and causes[J]. Space Science Reviews, 2003, 108(1): 131-144.

DOI

[23]
CHAMBERS D P. Evaluation of new GRACE time-variable gravity data over the ocean[J]. Geophysical Research Letters, 2006, 33(17): 2006GL027296.

[24]
SONG Y T, ZLOTNICKI V. Subpolar ocean bottom pressure oscillation and its links to the tropical ENSO[J]. International Journal of Remote Sensing, 2008, 29(21): 6091-6107.

DOI

[25]
MO K C. Relationships between low-frequency variability in the southern hemisphere and sea surface temperature anomalies[J]. Journal of Climate, 2000, 13(20): 3599-3610.

DOI

[26]
LEE T, HOBBS W R, WILLIS J K, et al. Record warming in the South Pacific and Western Antarctica associated with the strong Central-Pacific El Nio in 2009-10[J]. Geophysical Research Letters, 2010, 37: 1-6.

[27]
景雪懿, 程旭华. 印度洋海底压强的季节和长期变化[J]. 热带海洋学报, 2019, 38(5):10-17.

DOI

JING X Y, CHENG X H. Seasonal and long-term variability of ocean bottom pressure in the Indian Ocean[J]. Journal of Tropical Oceanography, 2019, 38(5): 10-17.

DOI

[28]
CHENG X H, OU N S, CHEN J J, et al. On the seasonal variations of ocean bottom pressure in the world oceans[J]. Geoscience Letters, 2021, 8(1): 29.

DOI

[29]
BATCHELOR G K. An introduction to fluid dynamics[M]. London: Cambridge University Press, 1970.

[30]
吴望一. 流体力学[M]. 北京: 北京大学出版社, 1983.

WU W Y. Fluid mechanics[M]. Beijing: Peking University Press, 1983.

[31]
TALLEY L D, PICKARD G L, EMERY W J, et al. Dynamical processes for descriptive ocean circulation[M]//Descriptive Physical Oceanography. Amsterdam: Elsevier, 2011.

[32]
NAYAK M R, EMERY W J, THOMSON R E. Data analysis methods in physical oceanography[J]. Estuaries, 1999, 22(3): 728.

Outlines

/

〈 〉