
0 引言
潮滩是陆地和海洋的过渡地带,位于平均大潮高潮线和平均大潮低潮线之间[1]。潮滩受到海洋和陆地的双重影响,具有重要的经济、社会和生态价值,是多种生物的栖息地,抵御风暴的海岸屏障以及海水免受陆地污染物污染的缓冲区[2]。此外,潮滩还具有极高的固碳效率,对全球碳循环和气候变化都具有十分重要的影响[3]。潮滩可以分为有植被的盐沼湿地和无植被的滩涂,其中盐沼湿地具有很高的固碳效率[4],而滩涂的固碳能力也不容忽视。相关研究表明,我国滩涂的碳埋藏速率仅次于盐沼湿地,远大于红树林[5]。因此,潮滩是全球“蓝碳”的重要组成部分。然而,潮滩生态系统极为脆弱[6],受到人类活动和自然因素的双重干扰,如海岸开发、海平面上升和河流泥沙减少等[7]。已有研究表明,1984—2020年全球潮滩面积已经减少了16%左右[8]。因此,监测潮滩变化对海岸保护和可持续发展至关重要。
监督、非监督分类方法和基于对象分类的方法已被广泛应用于土地覆盖变化遥感监测。潮滩是比较特殊的土地覆盖类型,它只有在退潮时才完全暴露,这妨碍了对其进行全面的遥感提取[14]。仅利用特定影像和单一合成影像进行潮滩提取的方法往往不能获得水面以下的潮滩信息,导致潮滩面积被低估。目前,大部分的潮滩遥感研究没有充分考虑潮位信息,有些也只是假定潮位信息统一,或选择相同季节的卫星数据,以避免季节性影响[15]。为了绘制潮滩范围,有研究利用传统的潮位数据和遥感影像,将潮位基准点在海岸线内插值,绘制潮滩数字高程模型(digital elevation model, DEM),再将潮滩DEM与卫星瞬时水边线相结合,获取潮滩范围。例如,韩倩倩 等[16]利用潮位插值建立潮汐校正模型,对1995—2015年中国潮间带变化进行了监测;WANG et al[10]利用长期遥感数据结合DEM模型构建了24个阶段的历史拓扑数据集,研究了江苏沿海潮滩近40年的变化;SALAMEH et al[17]将非监督分类的K-means聚类算法与主动轮廓法相结合,基于Sentinel-1和Sentinel-2影像提取水边线,并利用反距离加权和克里金法对潮位进行插值,反演潮滩DEM。然而,对于大面积海岸带来说,其地形是起伏多变的。这些方法在很大范围内,特别是在变化迅速、复杂的沿海地区,构建的潮滩高程存在很大的不确定性。
综上所述,潮位对卫星遥感提取潮滩范围具有重要影响,非低潮时的卫星影像在潮滩面积提取和分析中的不确定度较大。针对该问题,本文提出利用5天重访周期的Sentienl-2卫星影像构建乐清湾潮滩面积的潮位校正模型,并将其应用于长时间序列的Landsat卫星影像,从而实现对潮滩演变的遥感监测。该方法无需获取最低潮位数据,也不依赖于DEM模型,可对任意潮位遥感提取的潮滩面积进行校正,为特定区域潮滩面积的长时序变化监测提供了新思路。
1 数据与方法
1.1 研究区域
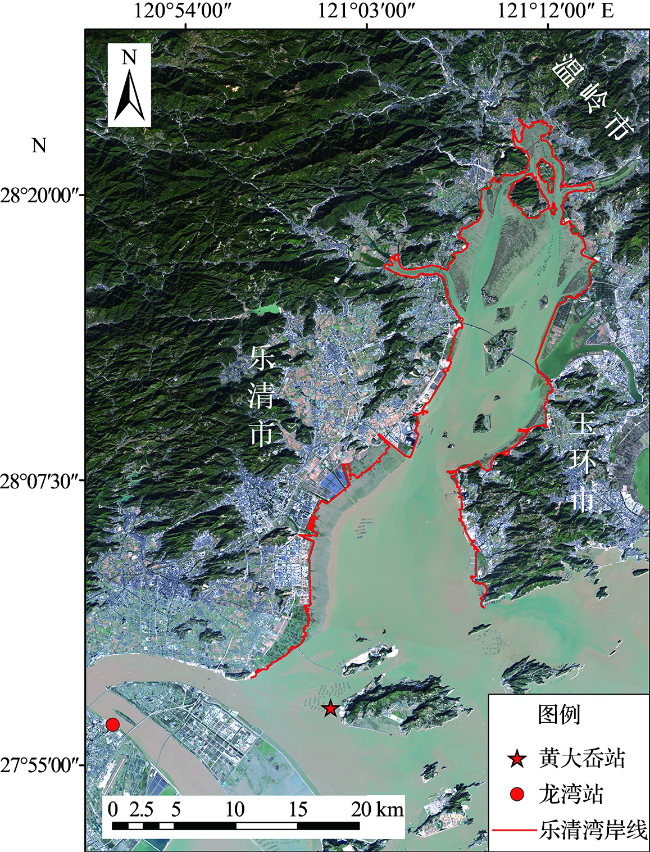
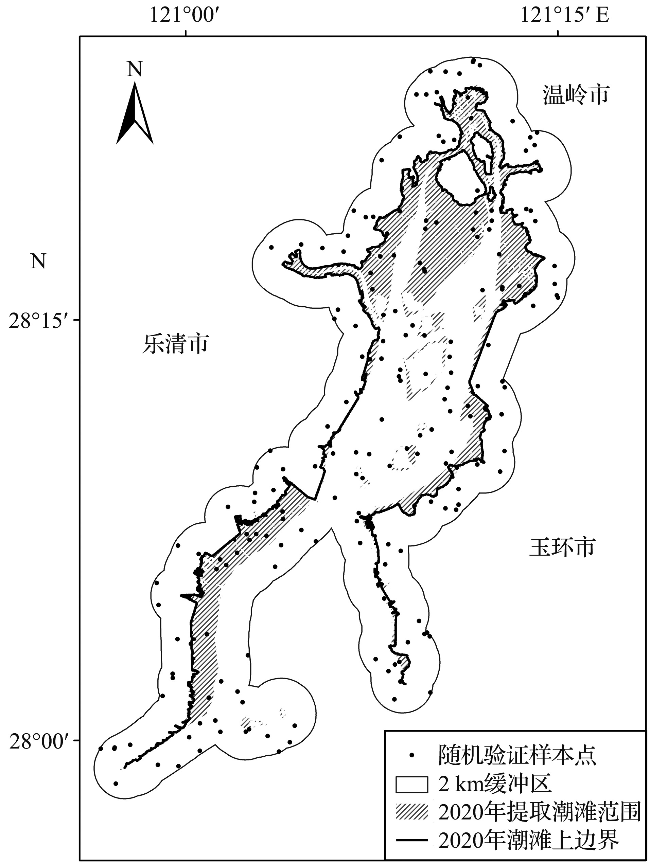
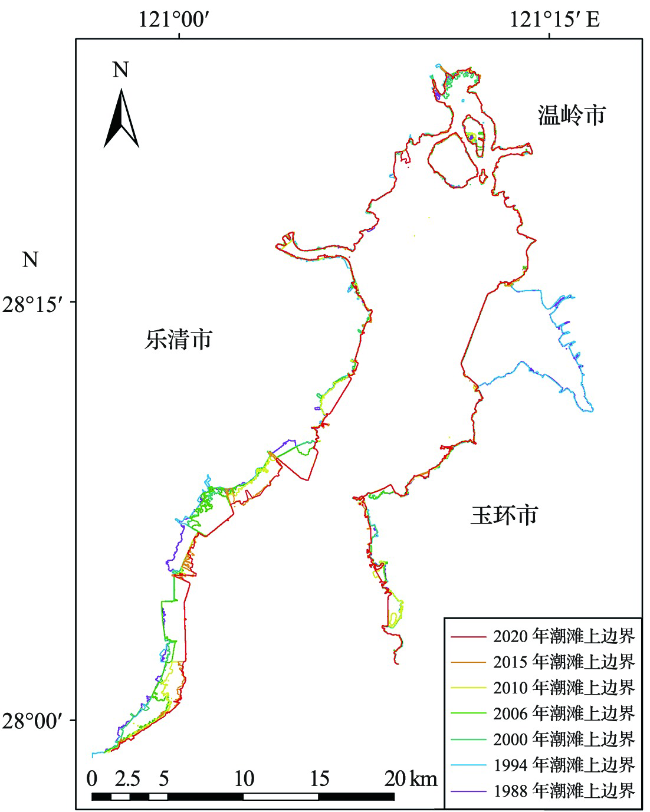
乐清湾(27°55'30″—28°23'35″N,120°58'00″—121°14'36″E)位于浙江省中南部沿海,三面被乐清市、温岭市和玉环市所围(图1),湾口宽21 km,纵深达42 km,海域总面积达463.6 km2,是一个与东海相通,呈葫芦状的半封闭海湾[20]。湾内潮滩分布广阔,潮滩总面积约占整个海湾面积的一半[21]。近年来,随着环乐清湾“浙南经济圈”的飞速发展,乐清湾内水环境质量下降[22],也给潮间带环境带来威胁。受工农业污水排放、围塘养殖、围垦造地等综合影响, 许多潮间带区域破碎景观[23],这一系列变化影响着乐清湾岸线和潮滩冲淤的演变。乐清湾属于强潮海湾,平均潮差在4 m以上,最大潮差超过7 m[24]。因此,遥感监测乐清湾潮滩面积受潮位影响较大。
1.2 数据源
1.2.1 卫星数据
Sentinel-2卫星回访周期为5天,其中Sentinel-2A于2015年6月23日发射,Sentinel-2B于2017年3月7日发射。Sentinel-2影像是新一代多光谱影像,具有高时空分辨率等优势,包括13个波段,空间分辨率为10 m、20 m和60 m。
Landsat系列卫星采用了TM、ETM+、OLI传感器,时间分辨率为16天,空间分辨率为30 m。本文所用Landsat数据来源于美国地质调查局(United States Geological Survey,USGS,https://earthexplorer.usgs.gov)。其中下载的Landsat系列数据均为Level-1 TP级别产品,该级别数据已经过系统辐射校正和地面控制点几何校正,并且通过DEM进行了地形校正,几何校正的误差小于12 m。下载的Sentinel-2系列卫星数据为Level-1C级别产品,该产品是经过了正射校正和亚像元级几何精校正后的大气顶表观反射率产品。
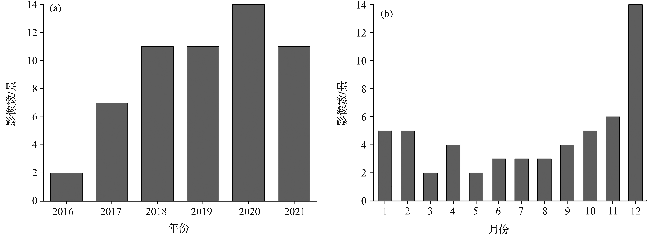
图2 Sentinel-2影像数量随年份(a)及月份(b)的分布Fig.2 The number of the Sentinel-2 images in each year(a) and month(b) |
表1 研究中选用的Landsat影像数据信息Tab.1 Landsat satellite data used in this study |
| 卫星名称 | 成像日期 | 成像时刻 | 瞬时潮高/cm | 分辨率/m |
|---|---|---|---|---|
| Landsat 5 | 1988-07-07 | 09:56 | 184.54 | 30 |
| Landsat 5 | 1988-11-12 | 09:56 | 637.99 | 30 |
| Landsat 5 | 1994-05-05 | 09:45 | 291.12 | 30 |
| Landsat 5 | 1994-07-24 | 09:43 | 618.52 | 30 |
| Landsat 7 | 2000-05-13 | 10:17 | 242.70 | 30 |
| Landsat 7 | 2000-09-18 | 10:16 | 573.47 | 30 |
| Landsat 7 | 2006-08-18 | 10:15 | 188.33 | 30 |
| Landsat 5 | 2006-08-26 | 10:19 | 589.55 | 30 |
| Landsat 7 | 2010-11-01 | 10:14 | 191.05 | 30 |
| Landsat 5 | 2010-11-09 | 10:15 | 621.41 | 30 |
| Landsat 8 | 2015-04-13 | 10:25 | 243.67 | 30 |
| Landsat 8 | 2015-08-03 | 10:25 | 654.55 | 30 |
| Landsat 7 | 2020-09-25 | 09:51 | 210.99 | 30 |
| Landsat 8 | 2020-04-10 | 10:25 | 652.99 | 30 |
1.2.2 潮汐数据
1.2.3 辅助数据
1.3 数据处理方法
1.3.1 卫星数据预处理
Sentinel-2 L1C级数据通过专门用于实现Sentinel-2 L1C级到L2A级产品制作的Sen2Cor工具软件处理,获得经过辐射定标和大气校正的地表反射率数据,再利用Sentinel-2数据应用平台(SNAP, v8.0)软件对数据进行重采样、波段合成及图像剪裁。
Landsat系列卫星数据利用ENVI 5.3工具进行辐射定标、大气校正、条带修复、波段合成、图像剪裁和图像镶嵌。
1.3.2 潮位计算
本文所用的潮位数据为根据国家海洋信息中心出版的黄大岙潮汐站数据计算获得。卫星成像时刻潮位的计算方法为:首先从卫星数据的头文件查得卫星成像的具体时间;再从《潮汐表》查得成像当天的潮汐情况,包括最高潮和最低潮的时间和潮位;最后利用公式(1)计算出卫星成像时刻的瞬时潮位[28]:
h1=H1- ×
式中:h1为计算得到的瞬时潮位, H1为当日潮汐表中最高潮时的潮位,h为当日的潮差,T为落潮历时,t为最高潮时至图像获取时的时间间隔。
1.3.3 水边线提取
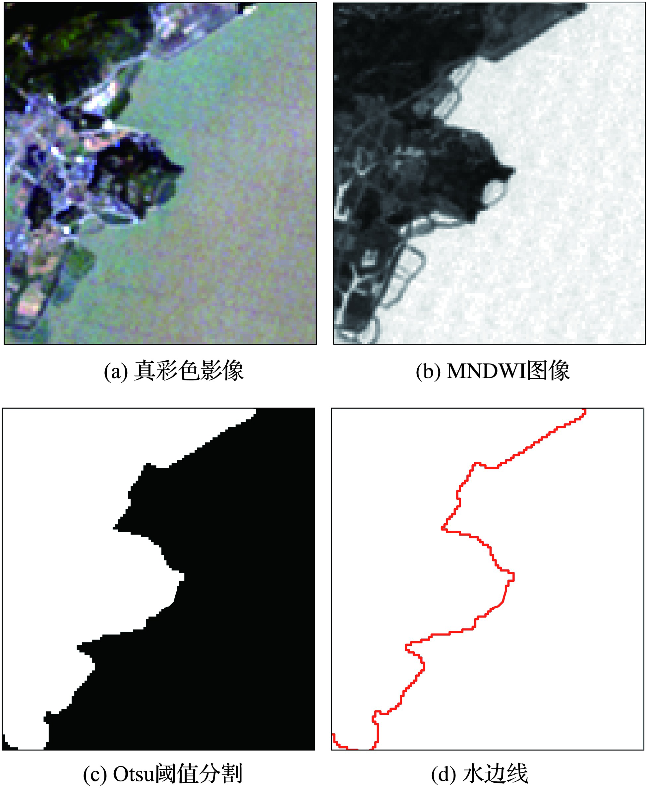
采用阈值分割法对水边线进行半自动提取。首先基于ENVI 5.3平台,对预处理后的图像进行改进的归一化水体指数(MNDWI)提取[29]:
MNDWI=
式中: ρgreen表示绿光波段的反射率,对应Sentinel-2的B3波段反射率、Landsat TM的B2波段反射率以及Landsat OLI的B3波段反射率;ρswir表示短波红外波段的反射率,对应Sentinel-2的B11波段反射率、Landsat 5 TM的B5波段反射率以及Landsat 8 OIL的B6波段反射率。
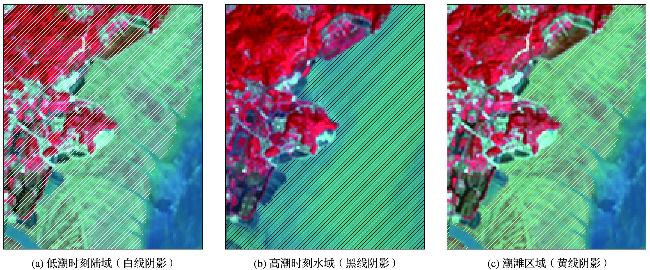
1.3.4 瞬时潮滩面积提取
1.3.5 潮位校正
利用Sentinel-2影像建立潮位校正模型,将从2020年4月10日的高潮位影像中提取的水边线作为潮滩上边界(高于多年平均高潮线),提取其余55幅影像中的水边线作为潮滩下边界,得到55个瞬时潮滩面积样本。根据公式(1)计算每幅遥感影像的瞬时潮位,分别对应55个瞬时潮滩面积样本,然后利用最小二乘法线性拟合建立潮滩面积-潮位定量关系,得到潮滩面积校正模型。最后,将模型应用于1988—2020年的7期Landsat影像提取的瞬时潮滩面积,获得校正后的潮滩面积。
1.3.6 精度评价
2 结果与分析
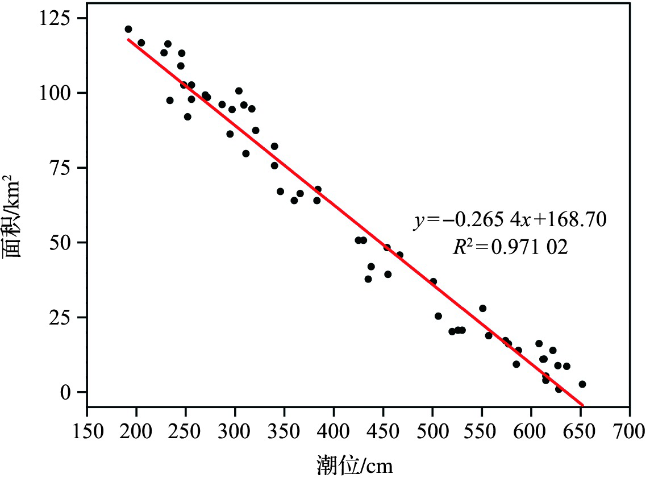
2.1 潮滩面积-潮位校正模型
将2016—2021年Sentinel-2卫星影像提取的瞬时潮滩面积与瞬时潮位进行线性拟合,得到了潮滩面积-潮位关系(图6)。结果表明,拟合斜率k=-0.265 4,即潮位每升高1 cm,潮滩面积减少0.265 4 km2。利用黄大岙验潮站的潮位信息,计算得出1988—2021年间的大潮平均低潮位为67.39 cm,由此可以获得潮位校正公式:
S=A+0.265 4×(h-67.39)
式中:S为校正后潮滩面积(单位:km2),A为通过遥感影像得到的瞬时潮滩面积(单位:km2),h为卫星成像时刻的瞬时潮位(单位:cm)。
2.2 瞬时潮滩面积提取结果及精度评价
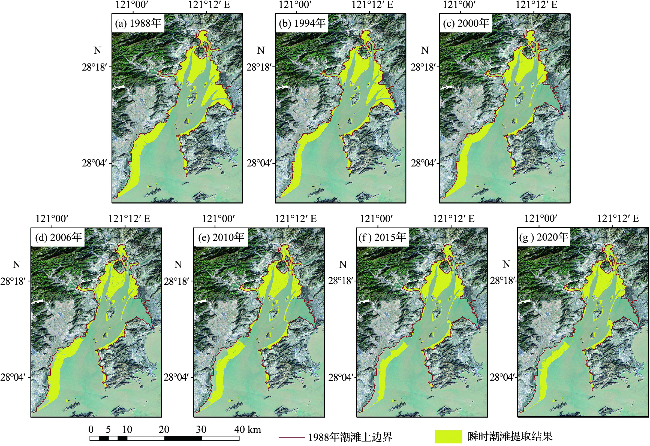
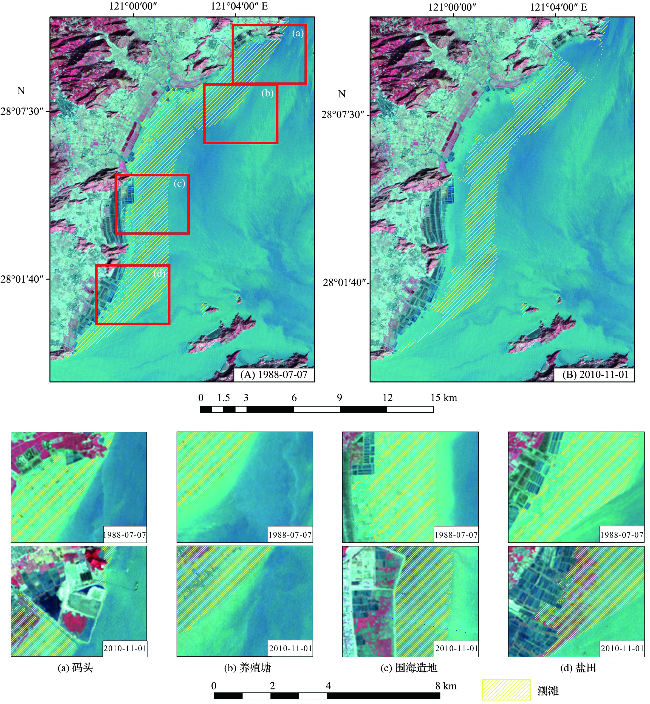
图7 1988—2020年7期瞬时潮滩分布提取结果Fig.7 Extraction results of instantaneous tidal flat distribution in 7 periods from 1988 to 2020 |
表2 潮滩提取精度评价结果Tab.2 Summary of evaluation results of tidal flat extraction accuracy |
| 年份 | 1988年 | 1994年 | 2000年 | 2006年 | 2010年 | 2015年 | 2020年 |
|---|---|---|---|---|---|---|---|
| 总体精度 | 0.960 | 0.985 | 0.985 | 0.980 | 0.970 | 0.960 | 0.990 |
| Kappa系数 | 0.913 | 0.959 | 0.943 | 0.931 | 0.903 | 0.901 | 0.967 |
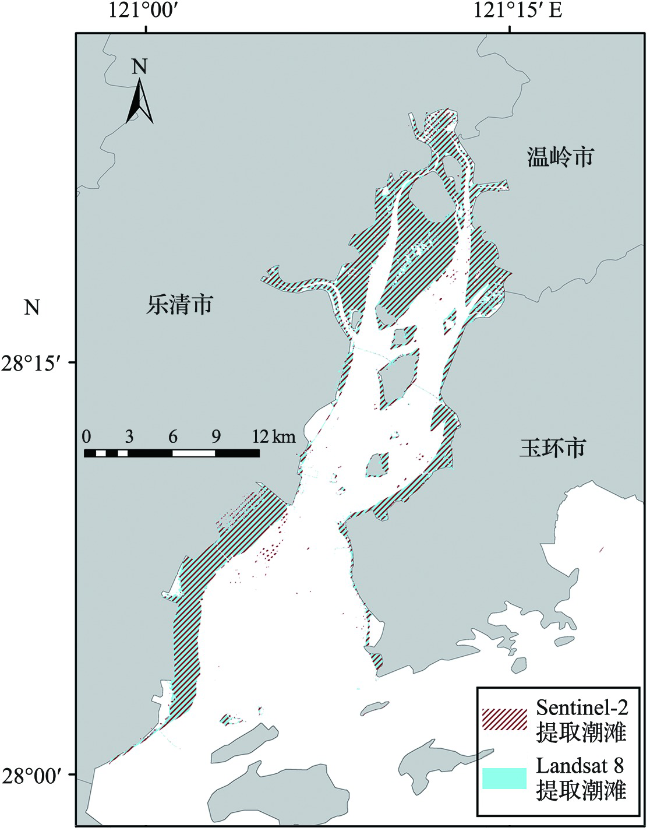
表3 Sentinel-2和Landsat 8潮滩识别结果比较Tab.3 Comparison of tidal flat extraction results between Sentinel-2 and Landsat 8 |
| 卫星类型 | 上边界影像日期 | 下边界影像日期 | 成像时刻 | 瞬时潮位/cm | 潮滩面积/km2 | 潮滩面积差 |
|---|---|---|---|---|---|---|
| Landsat 8 | 2020年04月10日 | 2018年12月17日 | 10:25 | 231.2 | 114.36 | |
| Sentinel-2 | 10:31 | 232.3 | 115.47 | +0.97% |
2.3 潮滩上边界变化
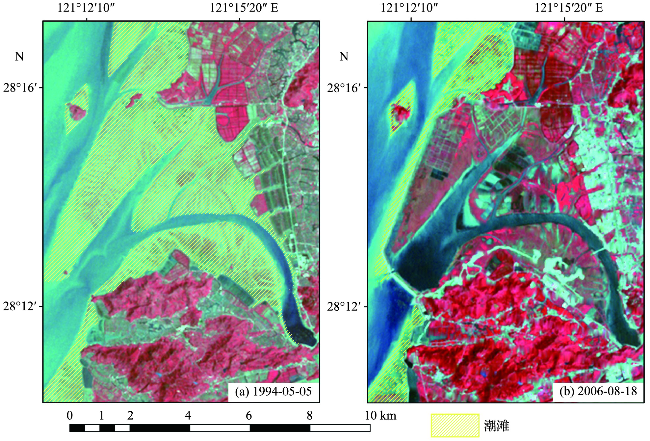
潮滩易受潮汐影响,但是潮滩的上边界相对稳定,瞬时潮滩上边界能反映各期海岸线的变化。将从Landsat 8遥感影像中提取的1988—2020年7期乐清湾海岸线矢量数据进行叠加分析(图9),可见整体边界逐期往湾中心推进,其中湾顶变化不明显,湾中部推进距离最大,最大推进约9 km。除了2015—2020年变化程度较小外,其他时间段都能看到潮间带上边界明显地向湾中心推进,其中1994—2000年变化最大,其原因是2000年湾中部旋门湾填海造陆工程的完工;而1988—1994年、2000—2006年、2006—2010年和2010—2015年发生的变化主要集中在乐清湾西岸乐清市附近,1988—2015年西岸平均向湾中心推进了1.5 km左右。
2.4 潮位校正后潮滩面积变化
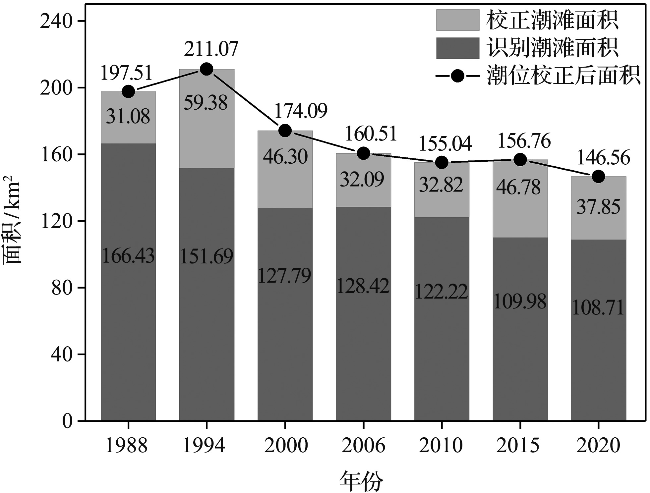
图10 校正前后潮滩面积的长期变化Fig.10 Long-term changes of tidal flat areas for pre and post corrections |
表4 近30年乐清湾经校正后的潮滩面积变化Tab.4 Changes of corrected tidal flat area of Yueqing Bay in recent 30 years |
| 年份 | 滩涂面积/km2 | 滩涂面积 变化量/km2 | 潮滩面积变化 幅度/% |
|---|---|---|---|
| 1988年 | 197.51 | / | / |
| 1994年 | 211.07 | +13.56 | +6.87 |
| 2000年 | 174.09 | -36.98 | -17.52 |
| 2006年 | 160.51 | -13.58 | -7.80 |
| 2010年 | 155.04 | -5.47 | -3.41 |
| 2015年 | 156.76 | +1.72 | +1.11 |
| 2020年 | 146.56 | -10.2 | -6.51 |
根据校正后的各时期潮滩面积,可将乐清湾潮滩面积的变化分为四个阶段。第一个阶段是1988—1994年,该时期潮滩面积大幅增长,从197.51 km增加到211.07 km2,增速为2.26 km2/a,增幅为6.87%。第二个阶段是1994—2010年,潮滩呈现大规模蚀退特征,潮滩的侵蚀面积达到了56.03 km2,平均侵蚀速率为3.50 km2/a,但蚀退速度逐年变缓,1994—2000年侵蚀速率达6.16 km2/a,2000—2010年侵蚀速率降至1.91 km2/a。第三个阶段是2010—2015年,潮滩面积少量增长,共淤涨了1.72 km2,平均淤积速率为0.34 km2/a。第四个阶段是2015—2020年,潮滩又发生蚀退,蚀退面积为10.2 km2,平均蚀退速率为2.04 km2/a。
3 讨论
本研究构建的潮位校正模型将1988—2020年各个时期潮滩面积对应的潮位高度进行了统一,因此,校正后的潮滩面积比瞬时潮滩面积更能准确地反映乐清湾潮滩面积变化。校正后的潮滩面积结果表明近30年乐清湾潮滩面积显著减少,下文将进一步探讨其可能的驱动因素。
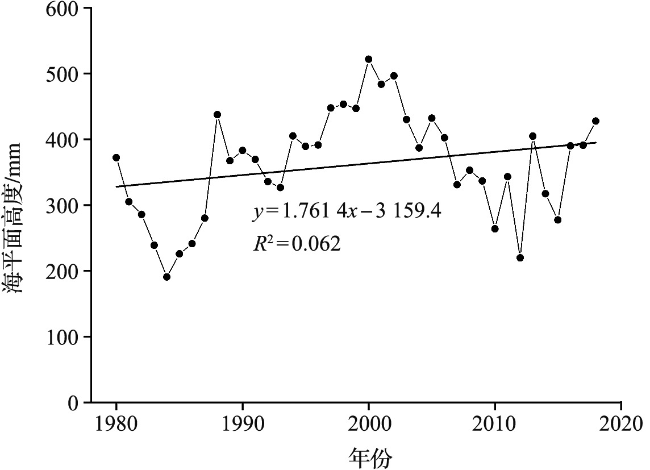
3.1 海平面上升影响
3.2 陆源输沙变化的影响
浙江沿海泥沙主要来源于长江口向南输移扩散的泥沙和当地河流入海输沙,其中长江输沙量占浙江沿海输沙量的96%,是浙江滩涂塑造的主要来源[36]。乐清湾位于浙江省中南部,除了长江口输移的泥沙外,其泥沙来源还有东海沿岸其他河流输沙、内陆架供沙以及瓯江北口下泄泥沙[37]。乐清湾沿岸有大荆溪、清江、江夏等山溪性河流注入,但径流总量和输沙量较小;瓯江流域多年平均输沙量约为20.5×10⁸ kg,相对长江(多年平均输沙量4 140×108 kg)而言属于少沙河流[38]。除长江输沙和东海内陆架再悬浮物质外,其余来沙对湾内潮滩形成的影响十分有限[39]。近40年来,长江入海泥沙明显减少[40],直接导致浙江沿海泥沙量减少,这与乐清湾潮滩面积整体减小的趋势相同(图10)。
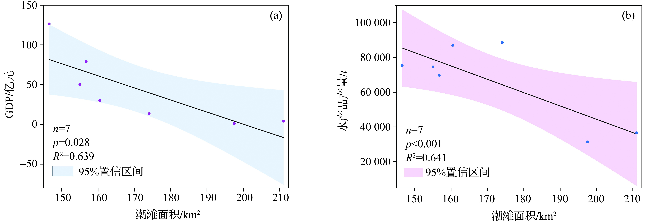
3.3 人类活动影响
4 结论
本文利用重访频率较高的Sentienl-2卫星影像建立了潮滩面积-潮位校正模型,并将其应用于1988年、1994年、2000年、2006年、2010年、2015年和2020年的Landsat遥感影像,获得经潮位校正后的乐清湾潮滩面积近30年的变化特征,并分析了变化驱动因素。本文获得的主要结论如下。
1)利用Sentienl-2卫星数据建立了乐清湾潮滩面积-潮位校正模型。结果表明,乐清湾潮位每升高1 cm,遥感监测的潮滩面积减少0.265 4 km2。
2)将建立的潮滩面积-潮位校正模型应用于长时序Landsat系列卫星。结果表明,校正后的潮滩面积与未经潮位校正的潮滩面积在变化趋势上存在差异。校正后的潮滩面积变化分为四个阶段:第一个阶段是1988—1994年,该时期潮滩面积大幅增长;第二个阶段是1994—2010年,潮滩呈现大规模蚀退特征,但蚀退速度逐年变缓;第三个阶段为2010—2015年,潮滩面积发生少量增长;第四个阶段为2015—2020年,潮滩又发生蚀退。
3)人类活动对潮滩的开发利用是乐清湾潮滩面积变化的主要驱动因素。但长期来看,气候变暖引起的海平面上升、长江来沙量减少以及人类活动引起的水动力和纳潮量变化,是乐清湾潮滩面积变化的潜在因素。
本研究仍存在以下两点不足之处:首先,本研究建立的潮滩面积-潮位校正模型利用的是近5年的Sentinel-2卫星数据,而在人为和自然因素的共同作用下,1988—2020年间潮滩面积和潮位的校正关系可能不是固定的,未来应考虑在各个时期建立不同的校正公式,得到更加准确的校正面积;其次,由于缺乏长期的现场数据,尚需要对卫星提取的潮滩面积进行进一步检验。随着无人机技术的发展,未来可利用无人机测量的较准确的潮滩面积对卫星提取面积进行精度评估。