
0 引言
1 研究区域与数据方法
1.1 研究区域
1.2 数据
1.2.1 实测数据及样品采集与分析
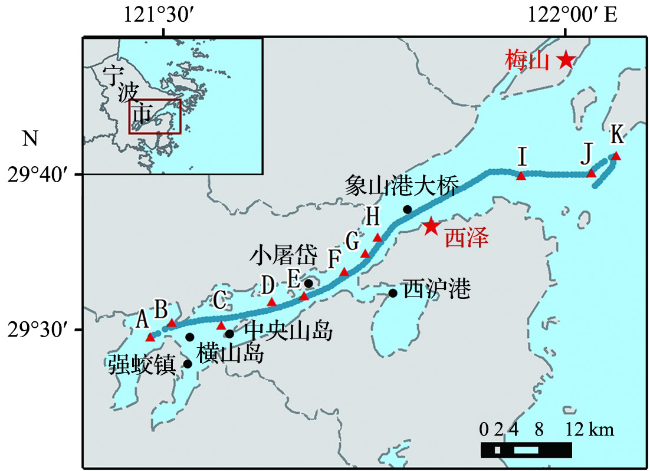
图1 研究区域、走航航线及采样站点(图中红色三角形代表采样站位置;红色星形代表验潮站位置;黑色圆点代表pCO2极值点分布位置。) Fig.1 The study area, cruise tracks and sampling stations (Red triangles represent the location of sampling stations; red starsrepresent the position of the tide gauging stations; black dots represent the location of the pCO2 extremums.) |
1.2.2 卫星遥感数据
表1 Sentinel-2 MSI及Landsat-8 OLI传感器波段信息Tab.1 Band informations of Sentinel-2 MSI and Landsat-8 OLI sensor |
| Landsat-8 OLI | Sentinel-2 MSI | |||||||
|---|---|---|---|---|---|---|---|---|
| 波段序号 | 波段信息 | 波长/nm | 空间分辨率/m | 波段序号 | 波段信息 | 波长/nm | 空间分辨率/m | |
| Band1 | 气溶胶 | 430~450 | 30 | Band1 | 气溶胶 | 433~453 | 60 | |
| Band2 | 蓝光 | 450~515 | 30 | Band2 | 蓝光 | 458~523 | 10 | |
| Band3 | 绿光 | 525~600 | 30 | Band3 | 绿光 | 543~578 | 10 | |
| Band4 | 红光 | 630~680 | 30 | Band4 | 红光 | 650~680 | 10 | |
| Band5 | 植被红边 | 698~713 | 20 | |||||
| Band6 | 植被红边 | 733~748 | 20 | |||||
| Band7 | 植被红边 | 773~793 | 20 | |||||
| Band5 | 近红外 | 845~885 | 30 | Band8 | 近红外 | 785~900 | 10 | |
| Band8a | 植被红边 | 855~875 | 20 | |||||
| Band9 | 水蒸气 | 935~955 | 60 | |||||
| Band6 | 短波红外 | 1 560~1 660 | 30 | Band10 | 短波红外 | 1 360~1 390 | 20 | |
| Band7 | 短波红外 | 2 100~2 300 | 30 | Band11 | 短波红外 | 1 565~1 655 | 20 | |
| Band8 | 全色波段 | 503~676 | 15 | Band12 | 短波红外 | 2 100~2 280 | 20 | |
1.2.3 走航pCO2 及溶解氧计算方法
1.2.4 遥感数据预处理及与实测数据匹配策略
1.2.5 精度评价指标
2 结果
2.1 水体光谱特征分析
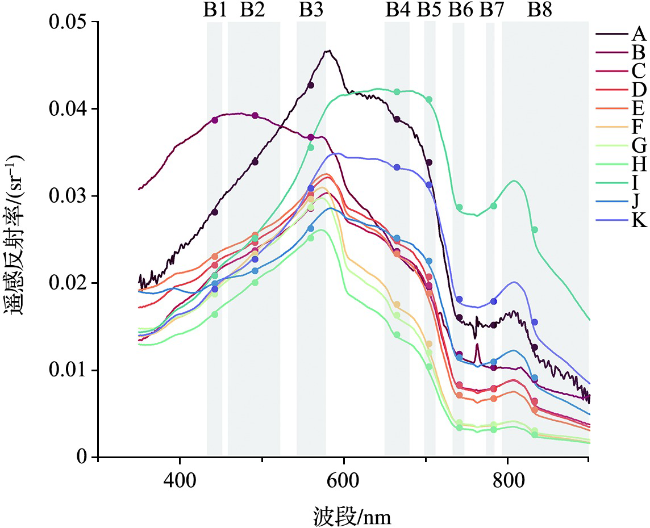
图2 象山港11个站点实测遥感反射率曲线(粉色矩形区域代表Sentinel-2 MSI的8个波段范围,图顶端为波段序号;实心圆点代表各波段中心波长。) Fig.2 Curve of in situ remote sensing reflectance of eleven stations in Xiangshan Bay (The pink rectangular areas represent the range of 8 bands of Sentinel-2 MSI, with band numbers at the top of the figure, and the solid dots represent the center wavelengths of each band.) |
2.2 遥感模型的构建与验证
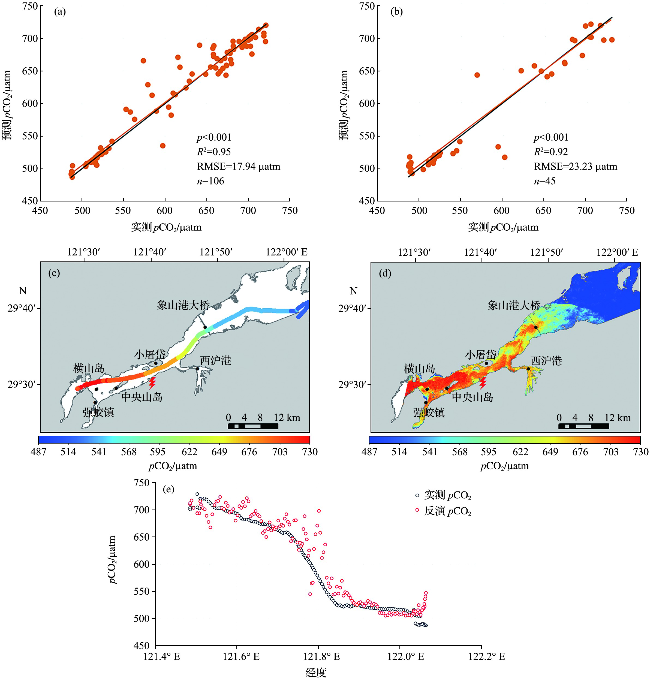
图4 算法验证结果(图4a和4b分别为SVM训练集和验证集建模及验证结果,图中黑色直线为1∶1直线,橙色直线为整体拟合曲线。图4c和4d分别为走航实测(2021年11月10日)及遥感反演(2021年11月11日)的pCO2结果。图4e为对应经度下实测pCO2与反演pCO2的结果对比。) Fig.4 Algorithm validation result (Fig.4a and fig.4b are modeling and validation results of the SVM training and validation dataset. The black straight line is the 1∶1 line; The orange line is the overall fitted curve. Fig.4c and fig.4d are pCO2 results of in situ measurement (Nov. 10, 2021) and satellite retrieval (Nov. 11, 2021), respectively. Fig.4e is the comparison between in situ pCO2 and satellite-derived pCO2 at corresponding longitude.) |
2.3 象山港秋季海表pCO2时空分布
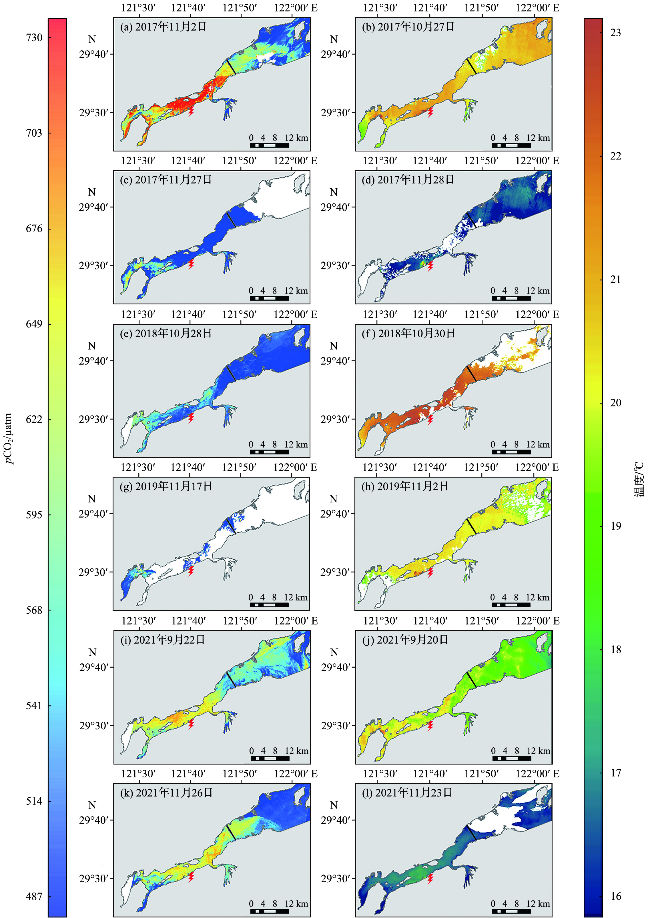
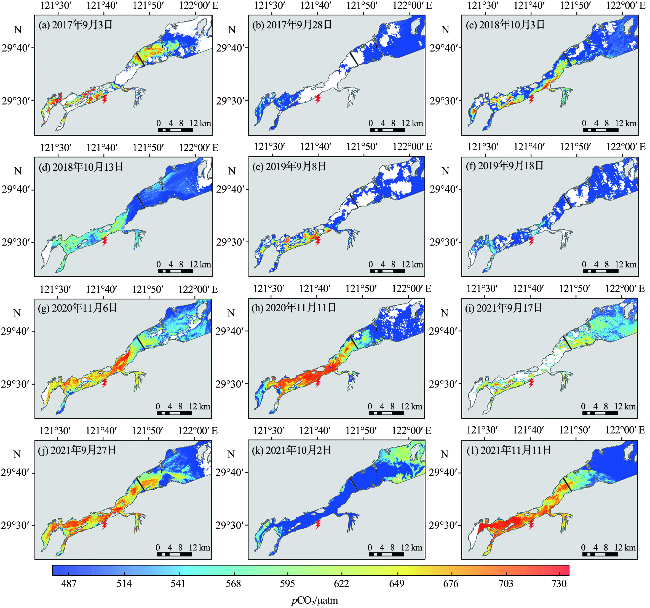
图5 2017—2021年秋季象山港Sentinel-2 MSI pCO2遥感反演结果(a、c、e、g、i、k)与邻近时间Landsat-8 OLI遥感SST空间分布(b、d、f、h、j、l)(红色闪电代表大唐乌沙山发电厂位置。) Fig.5 Spatial distribution of Sentinel-2 MSI satellite-derived pCO2 (a, c, e, g, i, k) and Landsat-8 OLI SST (b, d, f, h, j, l) of adjacent time in Xiangshan Bay in autumn 2017-2021 (Red lightning represents the location of Datang power Plant.) |
3 影响机制讨论
3.1 基于实测数据的pCO2影响机制分析
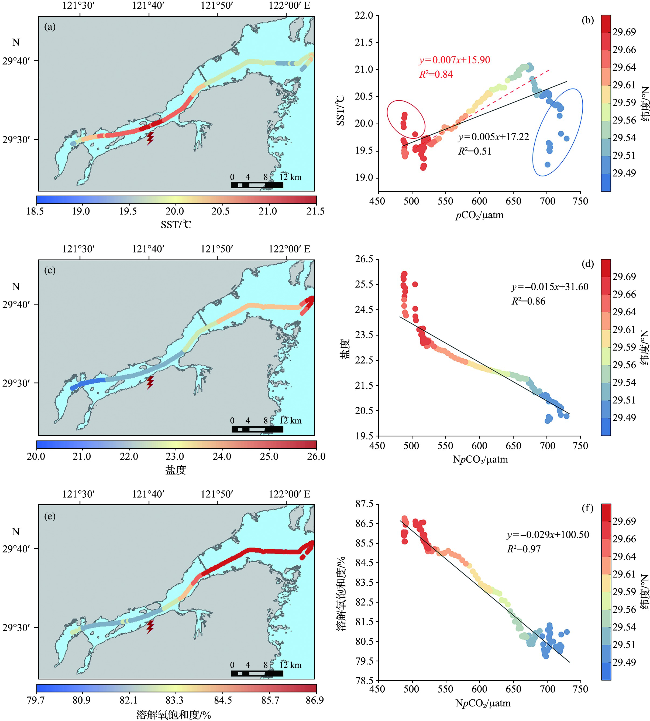
图7 2021年11月10日象山港现场走航观测要素分布及其与pCO2相关性分析(图7a、7c、7e分别为走航测量的SST、盐度、溶解氧饱和度的空间分布;图7b为pCO2与SST的相关性,其中红色与蓝色点分别代表最靠近湾口与湾顶的数据;图7d和7f分别为NpCO2与盐度、溶解氧饱和度的相关性。图中黑色直线为全部数据拟合曲线,红色虚线为去除圆圈内数据的拟合曲线。) Fig.7 Spatial distribution of underway measured parameters and their correlations with pCO2 in Xiangshan Bay in Nov. 10, 2021 (Fig.7a, fig.7c and fig.7e are the spatial distribution of SST, salinity and dissolved oxygen saturation, respectively. Fig.7b is the correlation between pCO2 and SST and the red and blue dots represent the data closest to the mouth and top of the bay. Fig.7d and fig.7f are the correlation between NpCO2 and salinity and dissolved oxygen saturation. The black straight lines are the fitting curves of total data, and the red dashed line is the fitting curve with the data in circles removed.) |