
0 引言
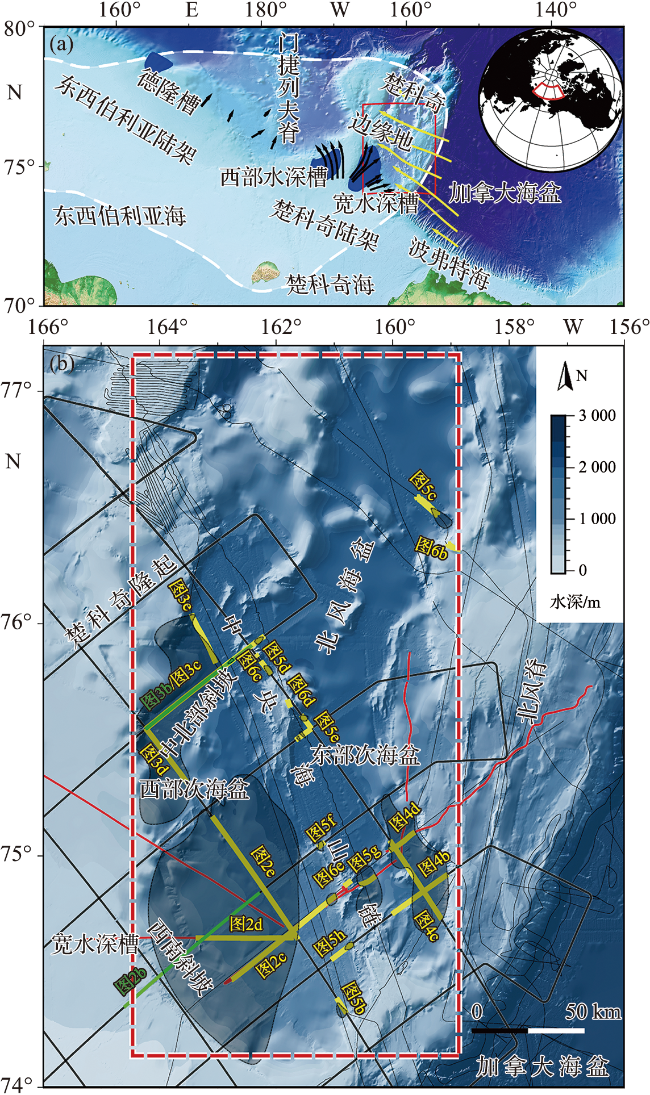
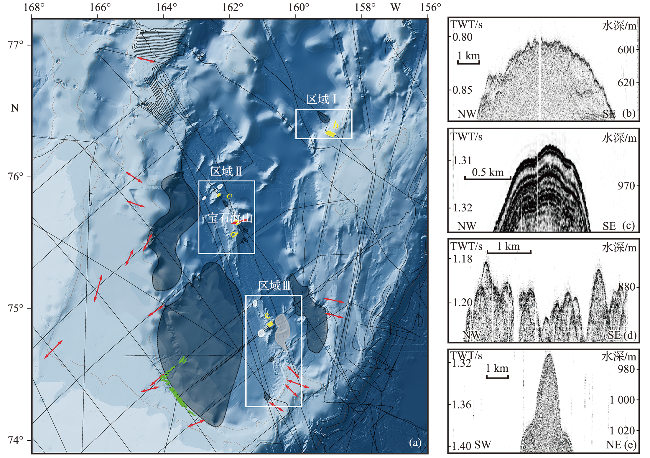
图1 北风海盆区域地理位置(图a为白令地区北部陆缘地形、冰盖和冰蚀槽发育情况;采用的地形资料来自全球水深数据(the general bathymetric chart of the oceans, GEBCO)[22];红色方框表示图b的范围;蓝色阴影表示主要冰蚀槽,白色虚线表示东西伯利亚-楚科奇冰盖范围[15];黄色箭头表示劳伦泰德冰盖来源的冰川流动方向;黑色箭头表示东西伯利亚-楚科奇冰盖来源的冰川流动方向;缩略图中红色扇形框表示图a所示范围。图b显示了研究区北风海盆(白边红色虚线框)及邻区的水深特征和地球物理资料分布;测深资料来自北冰洋国际水深图(international bathymetric chart of the Arctic Ocean, IBCAO 4.0)[23]。图b中实线代表浅剖测线(MGL1112航次测线同时进行了浅剖和多道地震测量),其中,红色粗线代表中国第11次北极科考航次(ARC11);黑色粗线代表MGL1112航次;黑色细线代表HLY系列航次和ARK-XXIII-3航次;黄色粗线代表下文展示的部分浅剖测线;绿色粗线代表下文展示的MGL1112航次部分反射地震测线。图b中黑色阴影代表本文识别出的碎屑流在各时代综合的最大分布范围。) Fig.1 The geographic map of the location of the Northwind Basin (Fig.a shows the topography, ice sheet and glacial trough extents in the northern continental margin of Beringia. Bathymetric data are from GEBCO[22]. Red rectangle: the range of fig.b; Blue shaded areas: glacial trough; White dashed line: suggested maximum extent of East Siberian-Chukchi Ice Sheet. Yellow arrows: ice flows from Laurentide Ice Sheet; Black arrows: ice flows from East Siberian-Chukchi Ice Sheet; Red sector in thumbnail: the range of fig.a. Fig.b shows the bathymetric characteristics of the survey area (Northwind Basin, red dotted rectangle with white edge) and its adjacent regions with distribution of geophysical lines. Bathymetric data are from IBCAO 4.0[23]. Solid line: sub-bottom profiling (SBP) data used in this study; Red thick line: China’s 11th Arctic expedition (ARC11); Black thick line: MGL1112, that at the same time with multi-channel seismic (MCS) survey; Black thin line: HLY cruises and ARK-XXIII-3; Yellow thick line: SBP sections shown in this article; Green thick line: MGL1112 MCS survey profiles shown in this article; Black shaded areas: maximum extent of debris flows (regardless of their different ages) identified in this study.) |
1 地质背景
2 数据与方法
3 结果
3.1 声学地层格架
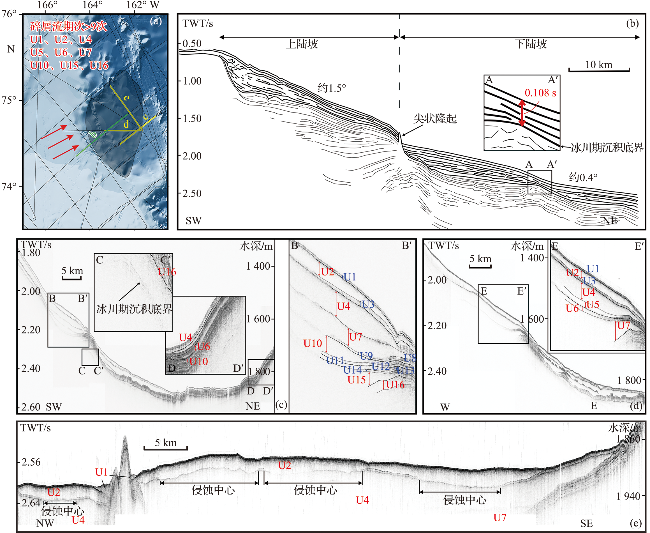
图2 西部次海盆西南斜坡上的碎屑流(图a为浅剖、地震测线分布及碎屑流范围,其中的红色箭头表示推测的沉积物运移方向(下同)。图b为MGL1112-MCS-09C反射地震剖面数据,地层解释据LEHMANN et al[15]的地震图像清绘而成,并参考了其对于冰川期沉积的解释,图中黑粗线表示冰川期沉积,灰细线表示前冰川期沉积。图c为ARC11-2-1部分浅剖数据,因其探测深度较其他航次深,因此选择它与相邻的MGL1112航次反射地震剖面进行对比,其中CC'剖面中浅剖探测到的最深反射面对应图b中AA'剖面的冰川期沉积底界,地层单元中红色字体表示碎屑流,蓝色字体表示正常地层(下同)。图d为 ARC11-2-2部分浅剖数据。图e为MGL1112_MCS03_2部分浅剖数据。) Fig.2 Debris flows in the southwestern slope of the western sub-basin (Fig.a shows the distribution of SBP, MCS data and debris flows. Red arrow: inferred sediment transportation direction. Fig.b shows the MCS profile of MGL1112-MCS-09C. Stratigraphic interpretation, especially the bottom of the glacial strata is based on LEHMANN et al[15]. Black thick line: glacial strata; Gray thin line: preglacial strata. Fig.c shows the part of SBP profile of ARC11-2-1. The lowermost reflector in section CC' corresponds to the bottom of glacial strata in section AA' in fig.b. In stratigraphic units, red fonts indicate debris flows, and blue fonts indicate general strata. Fig.d shows the part of SBP profile of ARC11-2-2. Fig.e shows the part of SBP profile of MGL1112_MCS03_2.) |
3.2 碎屑流特征与分布
3.2.1 西部次海盆的西南斜坡
3.2.2 西部次海盆的中北部斜坡
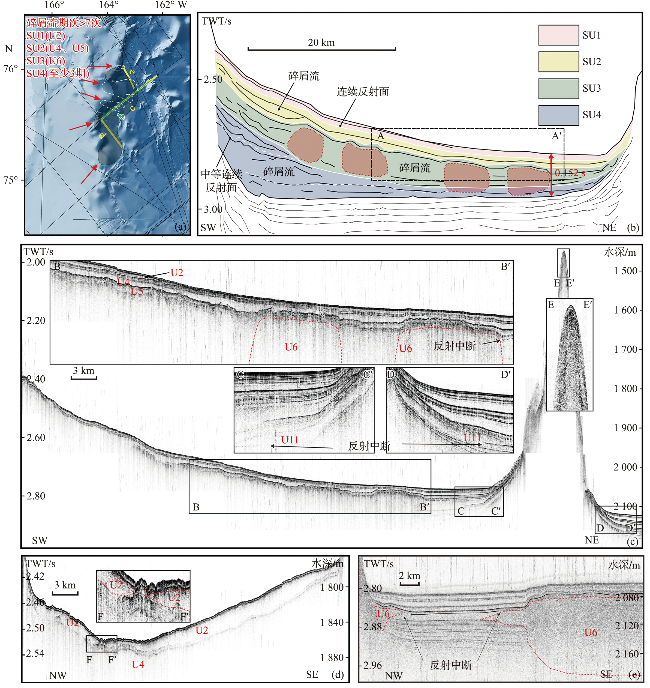
图3 西部次海盆中北部斜坡上的碎屑流(图a为浅剖、地震测线分布及碎屑流范围,其中的白色虚线表示U6碎屑流范围。图b为MGL1112-MCS-07B反射地震剖面数据,地层解释据LEHMANN et al[15]的地震图像清绘而成,并参考了其对于冰川期沉积的解释,图中黑粗线表示冰川期沉积,灰细线表示前冰川期沉积。图c为MGL1112-SBP-07_2部分浅剖数据,其中BB'剖面与图b中的AA'剖面对应。图d为MGL1112-SBP-03_1部分浅剖数据。图e为HLY0905_256_0906_LF_153部分浅剖数据。) Fig.3 Debris flows in the northern-central slope of the western sub-basin (Fig.a shows the distribution of SBP, MCS data and debris flows. White dotted line: the debris flows of U6. Fig.b shows MCS profile of MGL1112-MCS-07B. Stratigraphic interpretation, especially the bottom of the glacial strata is based on LEHMANN er al[15]. Black thick line: glacial strata; Gray thin line: preglacial strata. Fig.c shows the part of SBP profile of MGL1112-SBP-07_2. Section BB' correspond to section AA' in the zoom in fig.b. Fig.d shows the part of SBP profile of MGL1112-SBP-03_1. Fig.e shows the part of SBP profile of HLY0905_256_0906_LF_153.) |
3.2.3 东部次海盆的东南部
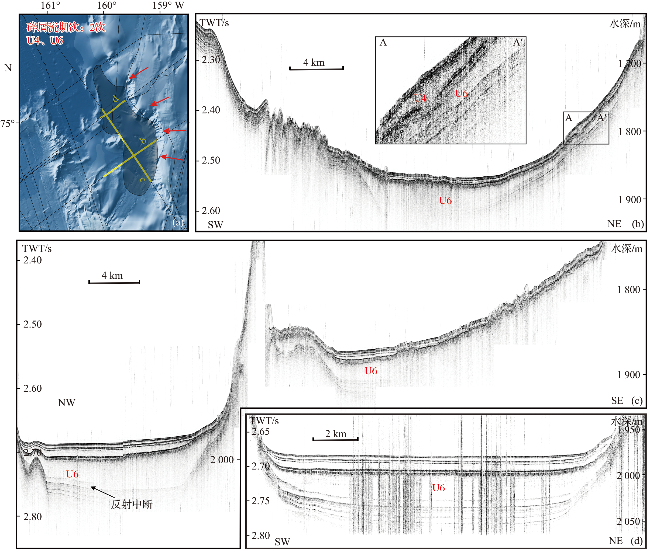
图4 东部次海盆东南端的碎屑流(图a为浅剖测线分布及碎屑流范围。图b为MGL1112-SBP-10_3部分浅剖数据。图c为MGL1112-SBP-04_1部分浅剖数据。图d为ARC11_1_5部分浅剖数据。) Fig.4 Debris flows in the southeastern part of eastern sub-basin (Fig.a shows the distribution of SBP data and debris flows. Fig.b shows the part of SBP profile of MGL1112-SBP-10_3. Fig.c shows the part of SBP profile of MGL1112-SBP-04_1. Fig.d shows the part of SBP profile of ARC11_1_5.) |
3.2.4 部分海山、陡崖之下
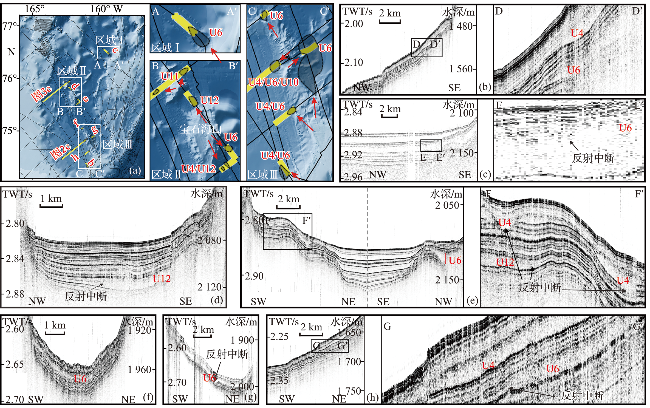
图5 海山、陡崖周缘的碎屑流(图a为浅剖测线分布及碎屑流范围。图b为MGL1112_MCS03_2部分浅剖数据。图c为HLY0805_229_0456_LF_066部分浅剖数据。图d为MGL1112-SBP-04_2部分浅剖数据。图e为MGL1112-SBP-08_2与MGL1112-SBP-04_2部分浅剖数据合并结果。图f为MGL1112_MCS09_1部分浅剖数据。图g为ARC11_1_4部分浅剖数据。图h为MGL1112_MCS010_2部分浅剖数据。) Fig.5 Debris flows around seamounts and cliffs (Fig.a shows the distribution of SBP data and debris flows. Fig.b shows the part of SBP profile of MGL1112_MCS03_2. Fig.c shows the part of SBP profile of HLY0805_229_0456_LF_066. Fig.d shows the part of SBP profile of MGL1112-SBP-04_2. Fig.e shows the part of SBP profiles of MGL1112-SBP-08_2 and MGL1112-SBP-04_2. Fig.f shows the part of SBP profile of MGL1112_MCS09_1. Fig.g shows the part of SBP profile of ARC11_1_4. Fig.h shows the part of SBP profile of MGL1112_MCS010_2.) |
4 碎屑流成因分析
图6 研究区的不同地貌分布(图a为区域内MSGL(红色双向箭头)与冲沟(绿线)分布,数据大部分来自DOVE et al[11],JAKOBSSON et al[12,14],POLYAK et al[6,10],SHEN et al[20],KIM et al[9]等文献,小部分根据浅剖和多波束资料重新解释;图中黑色、白色和灰色阴影分别表示冰川碎屑流、非冰川碎屑流和难以推测成因的碎屑流。图b为HLY0805_229_0409_LF_061部分浅剖数据。图c为MGL1112-SBP-04_2部分浅剖数据。图d为HLY0703_2007_1249_LF_127部分浅剖数据。图e为 HLY1202_267_0653_LF_310部分浅剖数据。) Fig.6 Distribution map of various landforms in study area (Fig.a shows the distribution of MSGL (red bidirectional arrow) and gullies (green line). Most of them come from DOVE et al[11], JAKOBSSON et al[12,14], POLYAK et al[6,10], SHEN et al[20], KIM et al[9]. A small part is reinterpreted based on SBP and multi-beam data. Black areas: glacigenic debris flows; White areas: non-glacigenic debris flows; Grey areas: uncertain debris flows. Fig.b shows part of SBP profile of HLY0805_229_0409_LF_061. Fig.c shows part of SBP profile of MGL1112-SBP-04_2. Fig.d shows part of SBP profile of HLY0703_2007_1249_LF_127. Fig.e shows part of SBP profile of HLY1202_267_0653_LF_310.) |