
0 引言
若以深度大于200 m的海洋水体来定义,深海区域超过了海洋的90%[1];若以深度大于1 000 m来定义,深海区域覆盖了地球表面的60%[2]。尽管人们对深海深度范围的界定不同,但都不可否认深海是地球上最大的生物分布区。近几十年来,随着一些深海新生境的发现,如海山、峡谷、海脊、冷泉、热液口、多金属结核区等,很多新物种也被不断地发现和描述[3]。除了发现和描述新物种外,深海生态系统的研究主题还包括物种数量、生物量、地理分布范围等[4]。但总体上人类对深海物种多样性的认识还十分有限。据估计海洋中的物种数量有220万种,其中有91%的物种尚未被描述[5],而对于物种在深海中的分布同样存在诸多认知上的空白。
多毛类动物是环节动物门(Annelida)中最大的类群,已经记录了80 多个科11 000多个有效种[6]。虽然在深海海底环境中,无论是在特殊的化能合成环境还是在普通的沉积环境中,多毛类动物的密度和物种丰富度在大型底栖生物类群中占优势[7⇓⇓-10],但是多毛类动物的分类学和生态学研究相对于其他深海底栖动物(如珊瑚、海绵)来说,关注度较低[11]。受采样技术手段等的限制,目前有关深海多毛类动物多样性的研究仅有限地在深海平原、盆地、海山等地貌区开展,并且,即便在研究相对较多的洋中脊海山系统,也还有90%的区域未被探索[12-13]。我国深海底栖多毛类动物分类学研究尚处于起步阶段[13-14],近年来在东海东侧冲绳海槽热液口附近[15]、台湾西南部冷泉区[16]、马里亚纳海沟[17]、马努斯盆地热液口[18-19]、卡罗琳海山[20]、采薇海山[21]、马里亚纳海盆中的KIOST海山[22]以及马绍尔海山群的一无名海山[23]发现并描述了多个多毛类新属、新种和新记录种。除了太平洋外,在印度洋热液区也发现了多个多毛类新物种[24⇓⇓⇓-28]。这些深海新物种大部分来源于热液喷口,少部分来自深水海山,有关其地理分布特征的研究仅在少量特殊生境开展,如热液口多鳞虫属Branchinotogluma的生物地理模式[18]和印度洋中脊的热液口动物地理区划[29]。
2013年,WATLING et al[30]根据海底水文(水深、温度、盐度等)和颗粒有机物通量数据将全球深海海底生物地理区划分成14个下次深海区(lower bathyal provinces,801~3 500 m)和14个深海区(abyssal provinces,3 501~6 500 m),其中,西太平洋的下次深海区包括北太平洋北部区(Northern Pacific Boreal)、西太平洋区(West Pacific)和北太平洋区(North Pacific),深海区包括北太平洋区(North Pacific)、中北太平洋区(North Central Pacific)、西太平洋海盆区(Western Pacific Basins)、赤道太平洋区(Equatorial Pacific)、南太平洋区(South Pacific)和印度洋区(Indian)。但是,这一生物地理区划尚需物种分布数据进行验证。
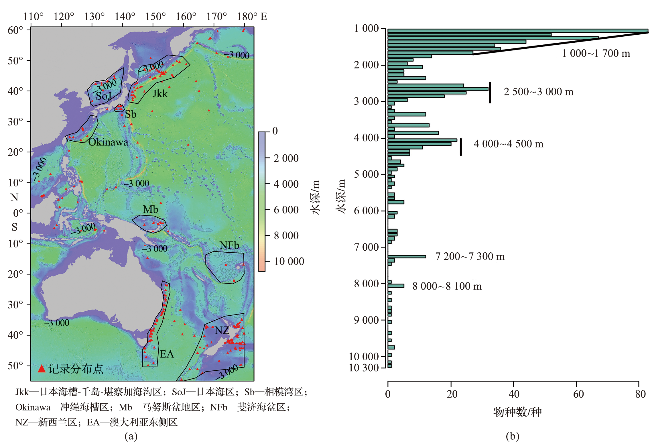
本文将深海的深度范围界定为1 000 m以深,根据OBIS中多毛类动物的采集记录,结合海底热液喷口分布信息,分析西太平洋深海底栖多毛类动物的地理分布特征。
1 数据和方法
1.1 数据来源
本文研究区为西太平洋(55°S—60°N、110°E—180°E)海域。从OBIS(https://obis.org/)下载1 000 m以深底栖多毛类动物的原始记录,剔除其中错误数据、重复数据以及非底栖多毛类数据。从全球海底活动热液口数据库下载含热液喷口经纬度的原始数据,用于划分地理单元。水深数据通过R软件中的Marmap 包[34]从美国国家海洋和大气管理局网站(http://www.noaa.gov)获取。
1.2 数据处理
1.2.1 聚类分析与集合分析
1.2.2 特有性简约分析
特有性简约分析(parsimony analysis of endemicity,PAE)是一种历史生物地理学方法[37],该分析方法类似于分支分析,通过区域共有分类群描述区域间的历史关系,广泛应用于生物地理学研究。特有性简约分析的主要步骤包括:1)在研究区域内选择一组生物地理单元;2)记录生物类群的地理分布;3)根据生物类群的地理分布信息构建“地理单元×类群”矩阵;4)利用简约算法分析数据矩阵,生成分支图,分析生物地理格局、特有性分布区等。
2 结果
2.1 物种分布特征
研究区共记录到多毛类51个科(图2)。不同科中物种记录数极不均匀(表1),其中记录数最多的前10个科为阿尔文虫科(Alvinellidae)、多鳞虫科(Polynoidae)、鳞沙蚕科(Aphroditidae)、米列虫科(Melinnidae)、叉螠科(Bonelliidae)、欧努菲虫科(Onuphidae)、双栉虫科(Ampharetidae)、竹节虫科(Maldanidae)、西伯加虫科(Siboglinidae)、仙虫科(Amphinomidae),其中最多的阿尔文虫科含247条物种分布记录。在种水平上,物种记录最多的为Paralvinella hessleri,含有237条记录,远多于第二记录的物种Melinnopsis chadwicki,两者同属阿尔文虫科,特有性地分布在深海热液口环境中。物种丰富度最高的前10个科为多鳞虫科、欧努菲虫科、叉螠科、裂虫科(Syllidae)、西伯加虫科、竹节虫科、双栉虫科、沙蚕科(Nereididae)、金扇虫科(Chrysopetalidae)、索沙蚕科(Lumbrineridae),其中,多鳞虫科的分布水深范围最广(1 000 ~10 000 m),叉螠科、西伯加虫科和竹节虫科的分布水深范围也较广,三者的最大分布水深均超过7 000 m。
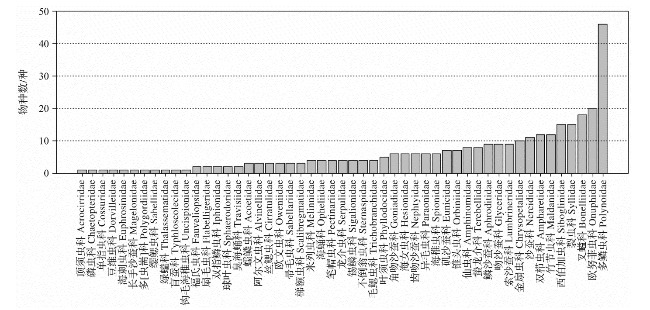
表1 西太平洋深海底栖多毛类记录数前10个科Tab.1 The top 10 deep-sea benthic polychaete families with the most records in the western Pacific |
| 序号 | 科名 | 记录数 | 分布水深/m |
|---|---|---|---|
| 1 | 阿尔文虫科Alvinellidae | 247 | 1 002~3 600 |
| 2 | 多鳞虫科Polynoidae | 141 | 1 000~12 000 |
| 3 | 鳞沙蚕科Aphroditidae | 99 | 1 000~4 800 |
| 4 | 米列虫科Melinnidae | 96 | 1 005~2 821 |
| 5 | 叉螠科Bonelliidae | 86 | 1 088~9 950 |
| 6 | 欧努菲虫科Onuphidae | 83 | 1 000~4 744 |
| 7 | 双栉虫科Ampharetidae | 81 | 1 028~5 613 |
| 8 | 竹节虫科Maldanidae | 65 | 1 005~7 290 |
| 9 | 西伯加虫科Siboglinidae | 55 | 1 053~9 600 |
| 10 | 仙虫科Amphinomidae | 44 | 1 013~4 200 |
2.2 聚类及集合分析
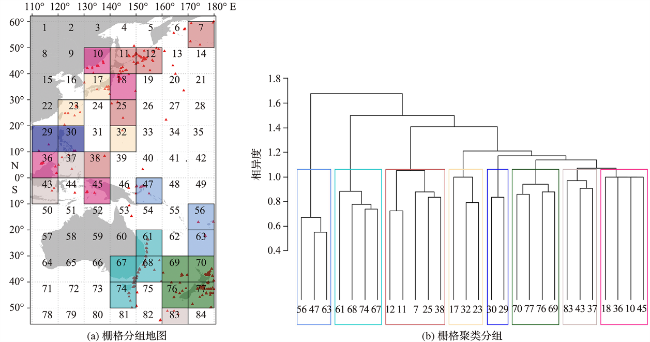
根据物种分布记录,研究区含物种分布信息的栅格共28个(图3a),物种318个,构建了28×318的矩阵,聚类分析得到各栅格间的相似性,结果见图3b。西太平洋深海底栖多毛类动物的分布明显分为8组:冲绳海槽与日本东南部聚类组(栅格17, 23, 32),热液口聚类组(栅格47, 56, 63),澳大利亚东侧聚类组(栅格61, 67, 68, 74),新西兰区聚类组(栅格69, 70, 76, 77),白令海-鄂霍茨克海聚类组(栅格7, 11, 12, 25, 38),菲律宾吕宋岛聚类组(栅格29, 30)以及其他2个聚类组(栅格10, 18, 36, 45;栅格37, 43, 83)。总体上,地理距离较近的区域,其多毛类组成相似,南北半球的差异较为明显。
集合分析结果(图4)显示,总体上各栅格中特有种(仅出现于某个栅格的物种)比例较高,除23、25、38、63和83号栅格外,其余23个栅格中特有种的比例均高于25%;共有种(出现于2个及以上栅格的物种)比例较低,并且共有种的数量一般仅为1~2种。63号栅格共含14个物种,其中仅1个特有种,大部分物种与47、56号栅格共有,经进一步检视发现,这3个栅格记录的物种大多特有性地分布在深海热液口。77和68号栅格的物种数最多,其中特有种比例分别高达73%、35%。
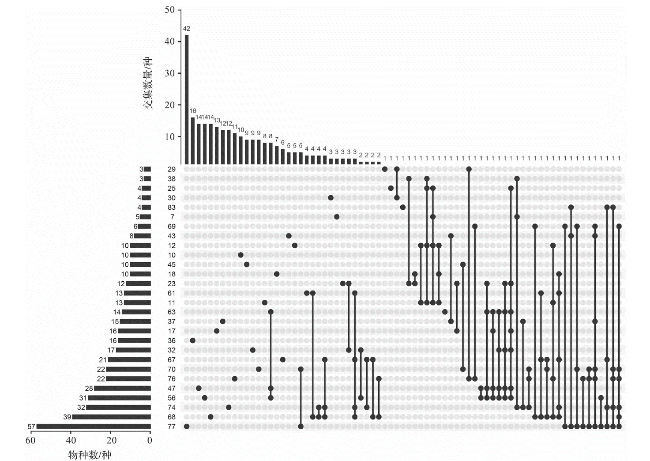
图4 栅格物种集合分析图(左侧柱状图:栅格的物种数;上方柱状图:交集数量,表示共有或特有的物种数量;点图矩阵:不同栅格的交集,矩阵左侧数字为栅格编号;单独实心黑点:每个栅格特有的物种数量;实心黑点与连线:不同栅格间的共有物种。) Fig.4 Upset plot showing intersections of different grids (left bar chart: species richness in each grids; upper bar chart: intersection size showing number of shared or endemic species; points matrix: intersection of grids, the numbers on the left of the matrix represent the number of grid; black solid circle: number of species unique to each grid; solid circle and lines: shared species between different grids.) |
2.3 特有性简约分析
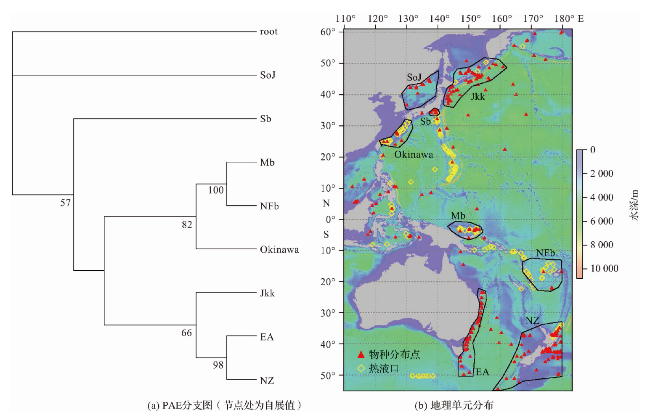
PAE分支图显示人为划分的8个地理单元可分成4个分支:日本海区(SoJ)和相模湾区(Sb)分别形成独立的一个分支,冲绳海槽区(Okinawa)、马努斯盆地区(Mb)及斐济海盆区(NFb)形成一个分支,日本海槽-千岛-堪察加海沟区(Jkk)、澳大利亚东侧区及(EA)及新西兰区(NZ)形成一个分支(图5a)。在地图上(图5b)可见,日本海区(SoJ)与其他地理单元存在一定的地理隔离;相模湾区(Sb)靠近大陆,深度平均仅为1 200 m,是所有地理单元中水深最浅的;冲绳海槽区(Okinawa)、马努斯盆地区(Mb)及斐济海盆区(NFb)均有密集的热液喷口分布;日本海槽-千岛-堪察加海沟区(Jkk)位于北半球,澳大利亚东侧区(EA)和新西兰区(NZ)位于南半球,虽然地理距离较远,但均以海沟和平原为特征。
3 讨论
西太平洋深海的多毛类动物多样性研究多集中于靠近陆地的陆坡、海沟以及热液和冷泉等特殊地貌单元[15⇓⇓⇓⇓⇓⇓⇓-23],相比于近海研究,尚有很大不足,尤其是在广袤的深海盆地和地形复杂的海山区域,还存在很多调查空白区。统计显示在中国南海和菲律宾海域已描述的多毛类为1 037种,隶属345属60科[39],约占全球已描述多毛类物种数的9%。在这些物种中,沙蚕科和多鳞虫科物种最多,其中大多数物种的模式产地位于近海,位于深海的很少。人们对于深海多毛类动物的物种多样性的认识还存在很多未知,在深海调查样品中常出现极高比例未被描述过的新物种,有时比例甚至超过1/2[40⇓-42]。这种未知可能会对生物地理学分析结果产生影响,如曾被认为是在太平洋热液口特有性分布的阿尔文虫科,后发现在北印度洋热液口也有分布[43]。
水深是决定深海生物群落结构最重要的因素之一,它与其他因素,如温度、压力、氧气、水团结构和食物供应等相关[45]。研究发现深海物种多样性在垂直分布上呈单峰曲线变化,一般在较浅的大陆坡(200~2 000 m)或大陆隆起(2 000~4 000 m)生境中物种多样性的值较高,在较深的生境中物种多样性的值较低[46⇓⇓-49]。而在本文中(图1),西太平洋底栖多毛类动物的物种多样性整体上随深度增加而降低,但在2 500~3 000 m以及4 000~4 500 m生境中,多样性略有增加。出现该现象的原因尚不十分明确,已有研究认为可能与特定生境的环境异质性相关,尤其是与沉积物类型的多样性相关[50]。
由于深海动物多样性数据的缺乏,目前深海动物地理区系划分主要依据海洋学指标(如地形、深度、水团结构、颗粒有机碳通量、底质特征等)进行[30,51],通过生物分布数据对这些生物地理分区进行校正,将增进对深海动物群落地区差异性的理解。在WATLING et al[30]的海洋生物地理分区中,Jkk与SoJ同属一个区(下次深海区的北太平洋北部区,深海区的北太平洋区),而在本研究中无论是聚类分析结果(图3)还是PAE分析结果(图5),均显示两者属于不同的区系。虽然Jkk和SoJ的地理距离较近,但因日本海基本与太平洋分隔,两地形成不同的深海动物区系是可能的。在WATLING et al[30] 的研究中,Sb属下次深海区的西太平洋区,与本研究中Sb独立成支的结果(图5)一致。Jkk、EA和NZ属于同一个分支,其中EA和NZ之间支持度更大,与Jkk的支持度较低(图5),表明相邻深海的物种类群接近,支持WATLING et al[30]的EA和NZ同属新西兰-克马德克区的划分。
4 结论
多毛类动物是深海环境中最主要的大型底栖动物类群之一,其物种多样性以及地理分布特征尚未被完全揭示。西太平洋深海底栖多毛类动物中物种数量最高的类群为多鳞虫科,且它具有最为宽广的深度适应范围;物种多样性总体上随水深增加而降低,但在2 500~3 000 m以及4 000~4 500 m水深处表现出较高的多样性。深海物种的特有性分布可能普遍存在,尤其是在热液口环境,形成了以热液口特有种为特征的多毛类动物区系。基于地理分区与前人基于海洋环境数据的动物地理区划基本一致,相近的地理环境中多毛类组成相似,但有部分区域存在异常,如日本海与日本海槽-千岛-堪察加海沟区的多毛类可能并不同属一个生物地理区。
目前深海动物多样性数据缺乏,特别是地形复杂的海山、广袤的深海平原等生境调查数据的缺乏,对认识深海动物区系构成了障碍,建议开展更多针对深海平原和海山环境的动物多样性调查,为理解深海多样性分布格局提供重要支撑。