
0 引言
1 数据和方法
1.1 台风数据简介
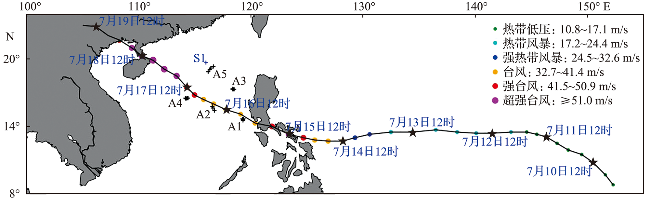
图1 超强台风“威马逊”的路径(图中黑线代表台风轨迹,黑色加号表示Argo观测时所在位置,蓝色加号表示锚定浮标观测时所在位置。) Fig.1 Track of super typhoon Rammasun (The black line represents typhoon’s track,the black plus signs represent positions of Argo at the typhoon’s arrival, the blue plus sign represents position of the moored buoy at the typhoon’s arrival.) |
1.2 卫星遥感数据和方法
1.3 Argo和锚定浮标数据简介及方法介绍
2 结果
2.1 温度响应
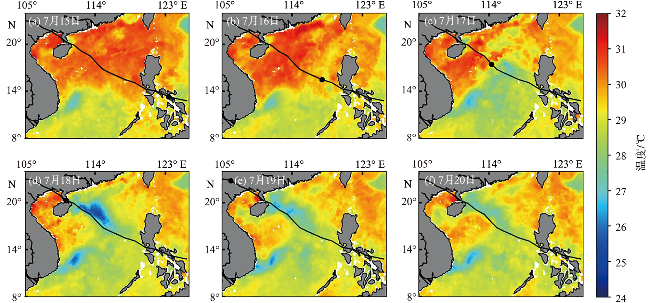
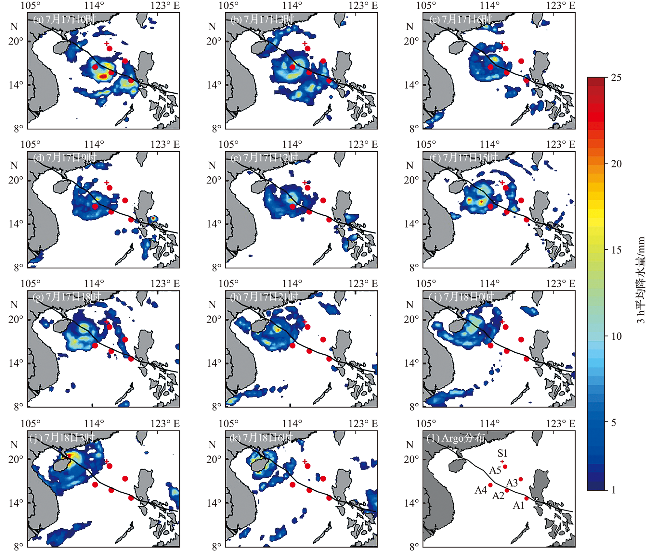
图2 卫星观测的7月15日—20日南海逐日海表面温度(图中黑点代表该日中午12时台风的位置,黑线代表台风轨迹,后图同此。) Fig.2 South China Sea daily SST observed by satellite from 15th to 20th of July (The black point represents the typhoon’s location at 12:00 UTC, the black line represents typhoon’s track, the following figures are the same.) |
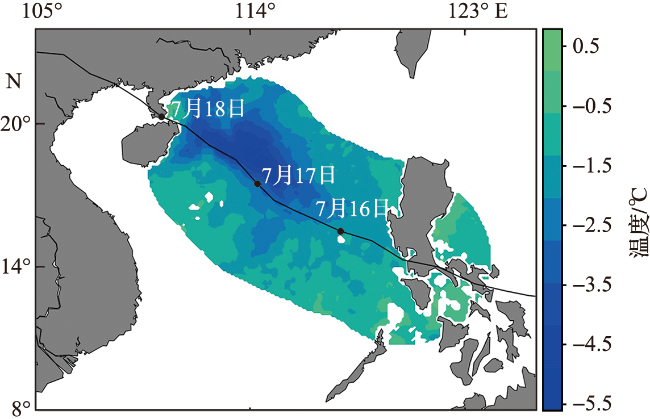
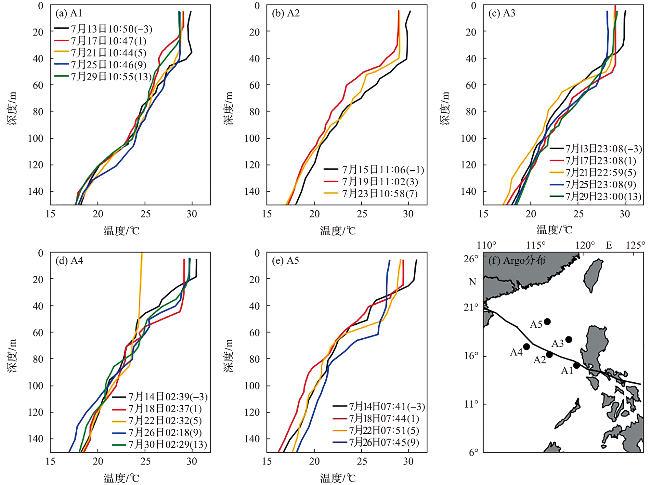
图4 7月13日—30日期间Argo记录的温度剖面(a~e)和Argo分布(f)(括号中数字代表观测日期相对于台风中心过境时间隔天数,负值代表过境前,正值代表过境后。) Fig.4 Temperature profile observed by Argo from 13th to 30th of July (a-e) and distribution of Argo (f) (The numbers in brackets represent the days relative to the passage of the typhoon’s center,negative means before the typhoon’s arrival and positive means after the typhoon’s passage.) |
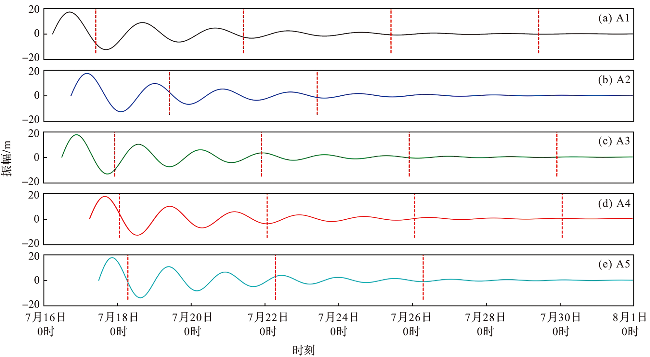
表1 台风造成的等温层深度和温度变化(强迫阶段)Tab.1 The changes of isothermal layer depth and temperature caused by typhoon (forcing phase) |
| Argo | 台风过境前 | 台风过境后 | |||
|---|---|---|---|---|---|
| 等温层 深度/m | 等温层 温度/℃ | 等温层 深度/m | 等温层 温度/℃ | ||
| A1(5903455)① | 41.3 | 29.739 | 21.1 | 29.100 | |
| A3(2901469) | 31.1 | 29.992 | 51.1 | 29.025 | |
| A4(5903454) | 18.7 | 30.477 | 44.8 | 29.130 | |
| A5(5902165) | 21.2 | 30.774 | 24.7 | 29.482 | |
注:A2处未观测到强迫阶段的温度剖面。 ①括号中是Argo的原始编号,后表同此。 |
2.2 盐度响应
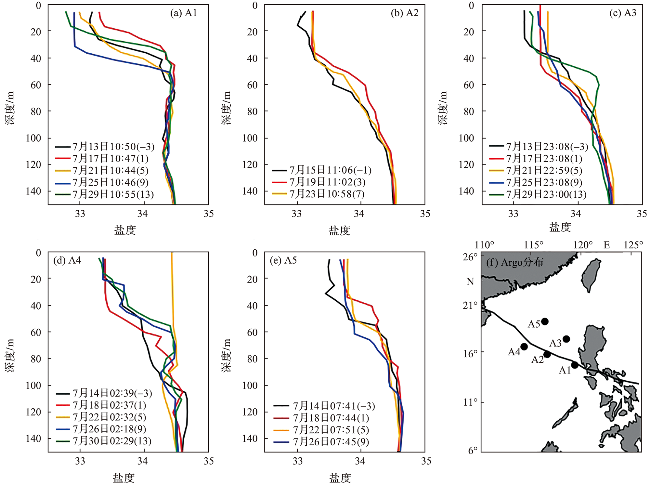
图6 7月13日—30日期间Argo记录的盐度剖面(a~e)和argo分布(f)(括号中数字代表观测日期相对于台风中心过境时间隔天数,负值代表过境前,正值代表过境后。) Fig.6 Salinity profile observed by Argo from 13th to 30th of July (a-e) and distribution of Argo (f) (The numbers in brackets represent the days relative to the passage of the typhoon’s center,negative means before the typhoon’s arrival and positive means after the typhoon’s passage.) |
表2 台风造成的混合层和障碍层厚度变化(强迫阶段)Tab.2 Changes of mixed layer depth and barrier layer thickness caused by typhoon (forcing phase) |
| Argo | 台风过境前 | 台风过境后 | |||
|---|---|---|---|---|---|
| 混合层 深度/m | 障碍层 厚度/m | 混合层 深度/m | 障碍层 厚度/m | ||
| A1(5903455) | 16.1 | 25.2 | 16.6 | 4.5 | |
| A3(2901469) | 25.3 | 5.8 | 35.4 | 15.7 | |
| A4(5903454) | 18.7 | 0.0 | 30.9 | 13.9 | |
| A5(5902165) | 16.0 | 5.2 | 24.7 | 0 | |
注:A2处未观测到强迫阶段的盐度剖面。 |
3 讨论
3.1 混合和上升流作用
表3 混合长度及净抬升距离Tab.3 Mixing length and net lift distance |
| Argo | 混合长度/m | 净抬升距离①/m |
|---|---|---|
| A1(5903455) | 10.01 | 3.325 |
| A3(2901469) | 18.53 | -1.669 |
| A4(5903454) | 14.37 | 4.268 |
| A5(5902165) | 15.45 | -0.676 |
①净抬升距离的正值代表抬升距离,负值代表下沉距离。 |
3.2 降水作用
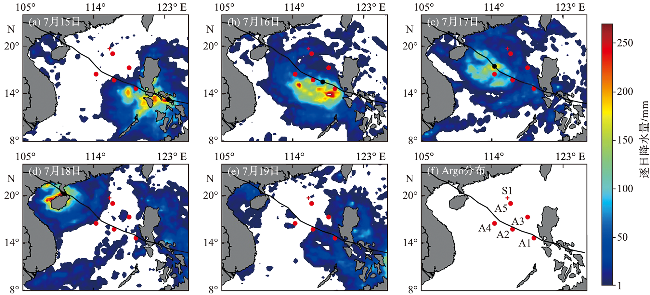
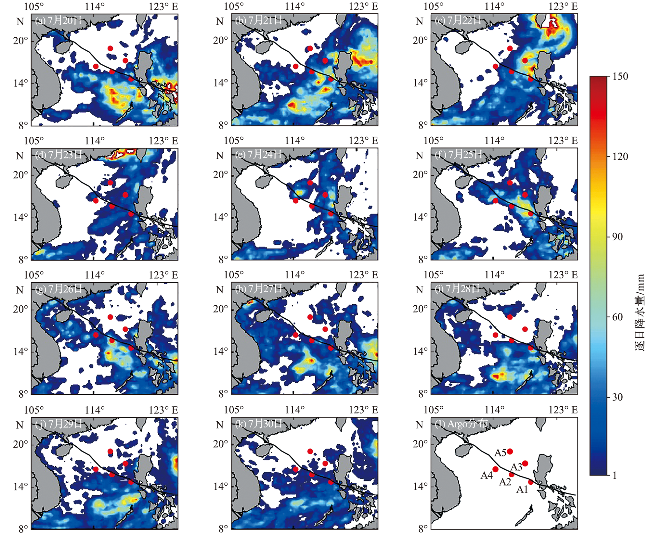
图8 7月15日—19日逐日降水量(a~e)和Argo分布(f)Fig.8 Daily precipitation from 15th to 19th of July (a-e) and distribution of Argo (f) |