
0 引言
1 区域概况与站位布设
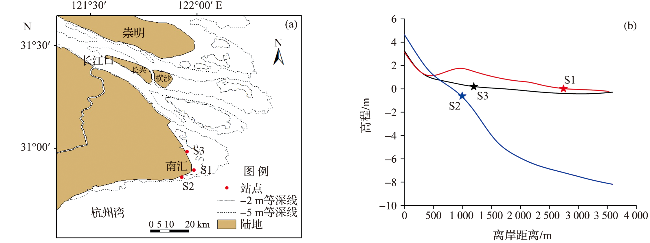
图1 长江口南汇潮滩地理概况及站位布设(a),3个观测站位所在断面的滩面高程变化(b)(图b中3个星号表示3个站位的位置。) Fig.1 Geographical overview and layout of stations at Nanhui tidal flats in the Changjiang Estuary (a) and elevation changes along the profiles where three stations are located (b) (The three asterisks in the fig.b indicate the positions of the three stations.) |
2 数据来源和研究方法
2.1 数据来源
表1 3个观测站位置、仪器设置及有效观测时段Tab.1 Locations of three stations, instrumentation and their valid observation periods |
| 站位 | 经纬度 | 仪器 | 采样频率 /Hz | 流速探头距 滩面距离/m | 潮周期 | ||
|---|---|---|---|---|---|---|---|
| T1 | T2 | T3 | |||||
| S1 | 121°59'14.50″E, 30°53'41.32″N | ADV9658 | 32 | 0.28 | 9月5日19:00— 9月6日03:50 | 9月6日07:20—15:50 | 9月6日19:30— 9月7日04:20 |
| S2 | 121°55'45.44″E, 30°51'36.40″N | ADV8160 | 32 | 0.20 | 9月5日18:40— 9月6日04:50 | 9月6日07:00—16:40 | 9月6日19:20— 9月7日05:10 |
| S3 | 121°57'14.15″E, 30°59'08.59″N | ADV8173 | 32 | 0.52 | 9月5日19:10— 9月6日04:10 | 9月6日07:40—16:10 | 9月6日20:10— 9月7日05:00 |
2.2 研究方法
2.2.1 ADV原始数据预处理

2.2.2 波浪特征参数、波浪谱参数的计算
3 结果
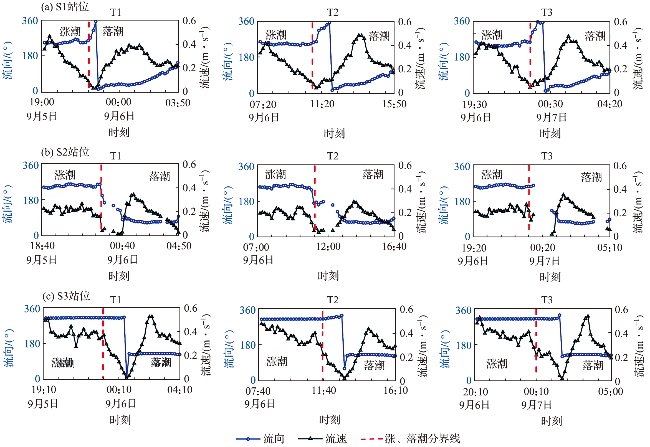
3.1 水文特征
表2 3个站位不同潮时重要潮汐动力参数统计值Tab.2 Statistics of key tidal hydrodynamic parameters over varied tidal phases at the three stations |
| 站位 | 潮时 | 平均水深/m | 平均流速/(m·s-1) | 平均流向/(°) | 波传播方向/(°) | 平均历时/h |
|---|---|---|---|---|---|---|
| S1 | 涨潮 | 2.69 | 0.44 | 260.09 | 285.24 | 3.61 |
| 落潮 | 2.63 | 0.49 | 57.04 | 302.21 | 5.11 | |
| 全潮 | 2.65 | 0.47 | 158.57 | 295.08 | 8.72 | |
| S2 | 涨潮 | 2.93 | 0.20 | 247.56 | 260.11 | 4.22 |
| 落潮 | 2.50 | 0.18 | 79.89 | 280.34 | 5.39 | |
| 全潮 | 2.71 | 0.17 | 163.73 | 270.23 | 9.61 | |
| S3 | 涨潮 | 2.97 | 0.38 | 309.77 | 318.10 | 4.00 |
| 落潮 | 2.48 | 0.25 | 128.85 | 203.24 | 4.78 | |
| 全潮 | 2.70 | 0.31 | 203.24 | 275.78 | 8.78 |
3.2 波浪的主要参数
3.2.1 波向
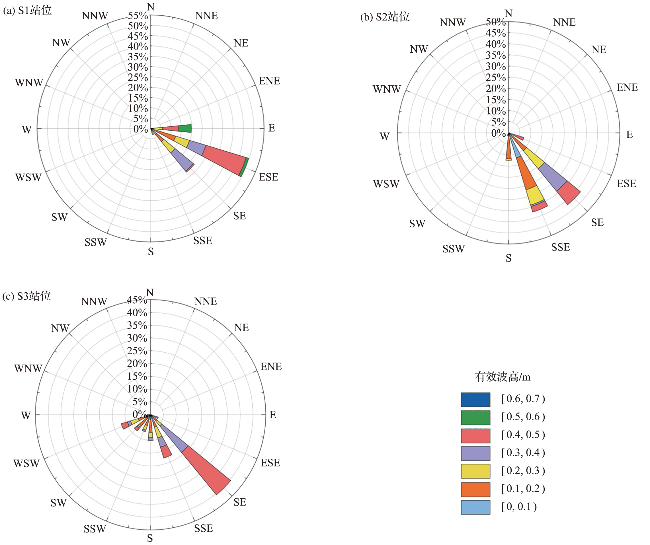
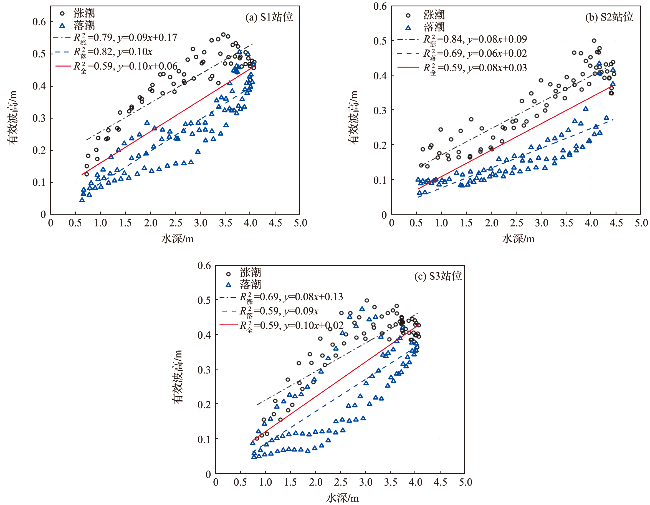
3.2.2 有效波高
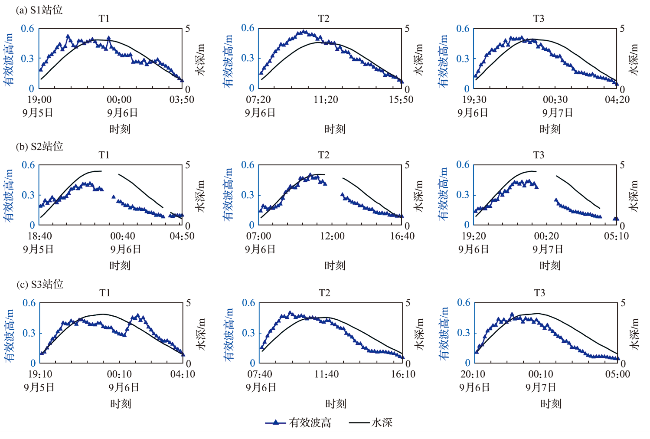
图6 3个站位观测期间有效波高和水深变化特征Fig.6 Variations in significant wave heights and water depth during the observation period at the three stations |
表3 3个站位不同潮时重要波浪参数统计值Tab.3 Statistic of key wave parameters over different tidal phases at the three stations |
| 站点 | 潮周期 | 潮时 | 有效波高/m | 平均周期/s | 平均跨零周期/s | 波轨流速/(m·s-1) |
|---|---|---|---|---|---|---|
| S1 | T1 | 全潮范围 | 0.08~0.52 | 3.08~5.73 | 2.80~4.90 | 0.10~0.26 |
| 涨潮平均 | 0.40 | 3.97 | 3.56 | 0.20 | ||
| 落潮平均 | 0.28 | 4.20 | 3.66 | 0.14 | ||
| 全潮平均 | 0.34 | 4.11 | 3.62 | 0.16 | ||
| T2 | 全潮范围 | 0.06~0.56 | 3.04~4.90 | 2.90~4.46 | 0.08~0.22 | |
| 涨潮平均 | 0.43 | 3.28 | 3.11 | 0.19 | ||
| 落潮平均 | 0.28 | 4.39 | 3.85 | 0.14 | ||
| 全潮平均 | 0.36 | 3.94 | 3.54 | 0.15 | ||
| T3 | 全潮范围 | 0.04~0.51 | 3.37~5.60 | 3.13~4.90 | 0.06~0.24 | |
| 涨潮平均 | 0.40 | 3.62 | 3.35 | 0.19 | ||
| 落潮平均 | 0.22 | 4.42 | 3.89 | 0.11 | ||
| 全潮平均 | 0.31 | 4.09 | 3.67 | 0.15 | ||
| S2 | T1 | 全潮范围 | 0.08~0.41 | 2.62~6.04 | 2.50~5.04 | 0.07~0.25 |
| 涨潮平均 | 0.31 | 3.30 | 3.05 | 0.15 | ||
| 落潮平均 | 0.14 | 4.54 | 3.95 | 0.10 | ||
| 全潮平均 | 0.23 | 3.92 | 3.50 | 0.13 | ||
| T2 | 全潮范围 | 0.09~0.50 | 2.72~5.41 | 2.62~4.85 | 0.09~0.23 | |
| 涨潮平均 | 0.33 | 3.25 | 3.08 | 0.15 | ||
| 落潮平均 | 0.18 | 4.59 | 4.16 | 0.12 | ||
| 全潮平均 | 0.26 | 3.92 | 3.62 | 0.15 | ||
| T3 | 全潮范围 | 0.06~0.44 | 2.69~5.43 | 2.57~4.75 | 0.06~0.18 | |
| 涨潮平均 | 0.31 | 3.24 | 3.07 | 0.14 | ||
| 落潮平均 | 0.15 | 4.16 | 3.70 | 0.09 | ||
| 全潮平均 | 0.23 | 3.92 | 3.39 | 0.12 | ||
| S3 | T1 | 全潮范围 | 0.09~0.47 | 2.61~4.09 | 2.46~3.41 | 0.06~0.13 |
| 涨潮平均 | 0.34 | 2.51 | 3.13 | 0.10 | ||
| 落潮平均 | 0.30 | 3.92 | 2.73 | 0.09 | ||
| 全潮平均 | 0.29 | 3.14 | 2.91 | 0.10 | ||
| T2 | 全潮范围 | 0.06~0.50 | 2.50~3.54 | 2.43~3.31 | 0.04~0.13 | |
| 涨潮平均 | 0.41 | 3.07 | 2.93 | 0.11 | ||
| 落潮平均 | 0.20 | 2.98 | 2.79 | 0.08 | ||
| 全潮平均 | 0.30 | 3.03 | 2.86 | 0.09 | ||
| T3 | 全潮范围 | 0.05~0.48 | 2.53~4.04 | 2.47~3.52 | 0.03~0.13 | |
| 涨潮平均 | 0.37 | 3.17 | 2.96 | 0.10 | ||
| 落潮平均 | 0.16 | 3.32 | 2.98 | 0.06 | ||
| 全潮范围 | 0.26 | 3.25 | 2.97 | 0.08 |
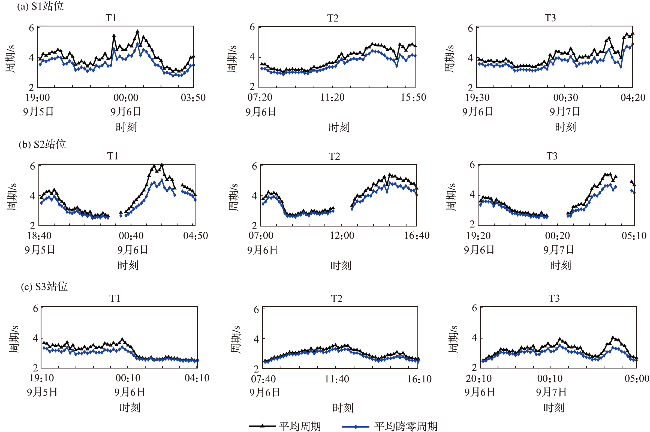
3.2.3 平均周期、平均跨零周期
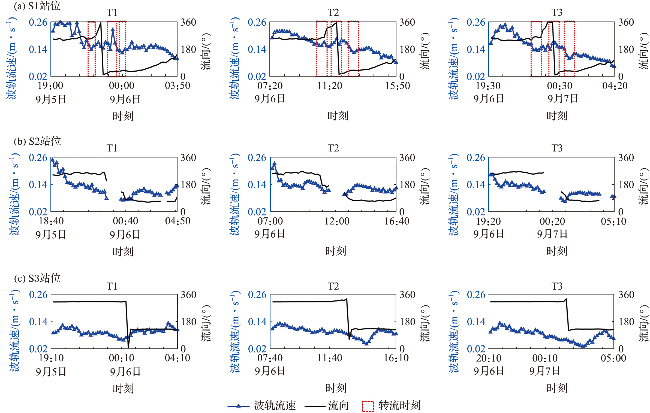
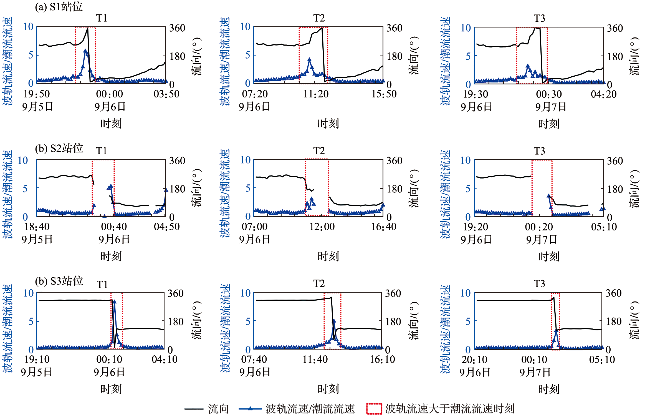
3.2.4 波轨流速
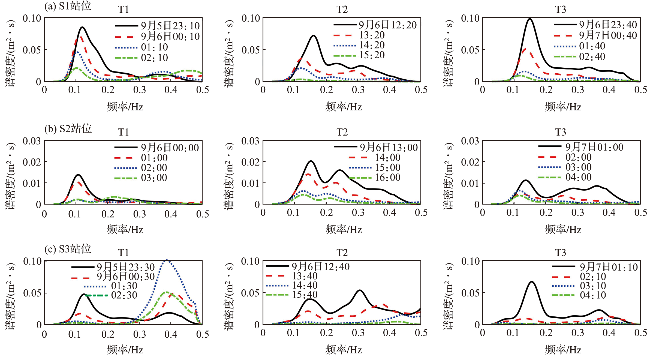
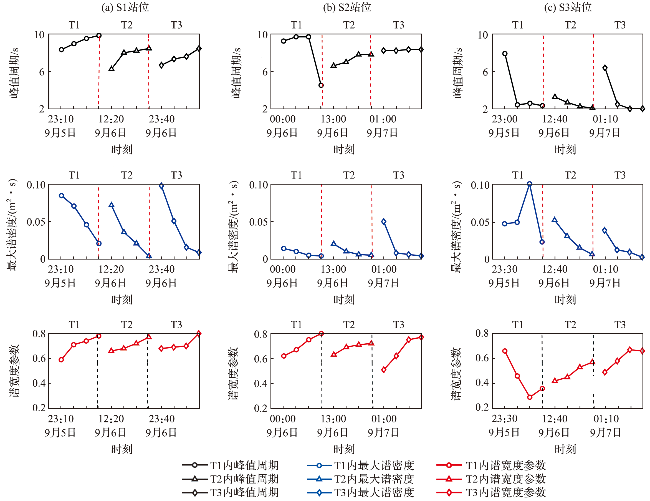
3.3 波浪的波谱特征
3.3.1 波高最大时刻的波浪频谱特征
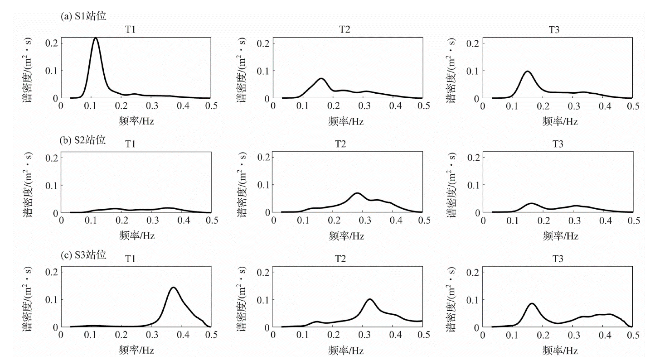
表4 3个站位波高最大时刻的波谱参数Tab.4 Spectral parameters at the moment of maximum wave height at the three stations |
| 站位 | 潮周期 | 峰值周期/s | 最大谱密度/(m2·s) | 谱尖度参数 | 谱宽度参数 |
|---|---|---|---|---|---|
| S1 | T1 | 8.70 | 0.220 | 1.83 | 0.81 |
| T2 | 6.25 | 0.072 | 1.36 | 0.66 | |
| T3 | 6.67 | 0.098 | 1.46 | 0.68 | |
| S2 | T1 | 2.01 | 0.017 | 4.82 | 0.43 |
| T2 | 2.01 | 0.069 | 2.18 | 0.47 | |
| T3 | 6.74 | 0.032 | 3.96 | 0.48 | |
| S3 | T1 | 2.68 | 0.144 | 4.81 | 0.46 |
| T2 | 3.08 | 0.101 | 2.45 | 0.43 | |
| T3 | 6.06 | 0.086 | 1.70 | 0.58 |
3.3.2 落潮过程中的波谱变化
4 讨论
4.1 南汇潮滩局地波浪构成的影响因素
表5 谱峰值能量法分析的3个站位波浪类型Tab.5 Employing wave energy spectrum statistics to discriminate wave types at the three stations |
| 站位 | 潮周期 | 谱峰频率/Hz | 谱峰值能量/(m2·s) | PM谱峰值能量/(m2·s) | 比值 | 波浪成分 |
|---|---|---|---|---|---|---|
| S1 | T1 | 0.12/0.22① | 0.220/0.015 | 7.125/0.162 | <1/<1 | 涌浪 |
| T2 | 0.16/0.31 | 0.072/0.025 | 1.367/0.049 | <1/<1 | 涌浪 | |
| T3 | 0.15/0.34 | 0.098/0.022 | 1.887/0.003 | <1/>1 | 涌浪/风浪 | |
| S2 | T1 | 0.27/0.35 | 0.011/0.017 | 0.103/0.026 | <1/<1 | 涌浪 |
| T2 | 0.14/0.28 | 0.015/0.069 | 2.369/0.081 | <1/<1 | 涌浪 | |
| T3 | 0.16/0.31 | 0.032/0.023 | 1.300/0.049 | <1/<1 | 涌浪 | |
| S3 | T1 | 0.11/0.38 | 0.004/0.144 | 10.379/0.020 | <1/>1 | 涌浪/风浪 |
| T2 | 0.16/0.33 | 0.024/0.091 | 1.518/0.038 | <1/>1 | 涌浪/风浪 | |
| T3 | 0.16/0.39 | 0.086/0.045 | 1.172/0.016 | <1/>1 | 涌浪/风浪 |
①“/”两侧分别为低频侧和高频侧数据。 |