
0 引言
前人通过观测台风激发的近惯性波,对其生成和传播的规律已有很多发现。SANFORD 等[6]通过比较台风强迫前、后的海流剖面,发现台风France引起的近惯性流流速接近1.6 m/s,台风Ivan引起的近惯性流流速超过2 m/s[7]。已有的观测发现,温跃层存在的波动滞后于混合层的近惯性运动,近惯性能量在混合层生成后向下传播,部分能量在局地耗散,剩余的部分则继续垂直向下或者在水平方向上传播[2,5]。因此,局地观测的近惯性振荡能量会逐渐衰减,一般在不超过两周的时间内能量完全耗尽[8-9]。大多数情况下近惯性波振荡的频率略高于当地惯性频率,即频率发生“蓝移”[10⇓-12];极少数情况下近惯性振荡频率小于当地惯性频率,即频率发生“红移”[13]。中尺度涡和地转流引起的涡度变化可影响近惯性波的频率,正(负)的涡度会升高(降低)近惯性波的频率[14-15]。此外,地转流的多普勒频移效应也会引起近惯性波频率的偏移[10]。
关于南海上层海洋对台风的响应方面的研究比较深入,比如CHU 等[16]基于定点潜标观测和数值模式开展了南海上层海洋对台风的动力学和热力学响应研究,指出近惯性波的能量主要集中在混合层和温跃层;YANG 等[17]研究认为台风激发的近惯性波对海洋混合存在显著的贡献。南海西北部同时存在着强盛的内潮、频发的中尺度涡旋以及季节性变化的南海西边界流,海洋过程复杂,对南海的内潮和台风激发的近惯性波的相互作用研究也较多。观测发现近惯性波与内潮通过非线性作用生成高频波,将能量向高频和小尺度传递[18⇓-20];中尺度涡通过改变环境涡度大小影响近惯性波的频率,导致近惯性波观测频率高于当地惯性频率[17,20]。南海背景流(如西边界流)对近惯性波观测频率影响的相关研究较少,亟需开展背景流对近惯性波频率的影响机制方面的研究。为了进一步研究在南海背景流影响下台风激发的近惯性波特征,特别是近惯性波频率的偏移,本文利用台风“杜苏芮”期间南海西北部潜标观测的海流数据研究台风引起的近惯性波,获得了台风激发的近惯性波频率在深度上的分布特征,基于内波传播理论讨论了背景流多普勒效应对近惯性波频率在各个深度频移的贡献。
1 数据和方法
1.1 潜标观测数据
本文将南海西边界流作为背景流来探索近惯性波传播中的频率变化。南海西北部受南海西边界流的影响,海流垂向结构复杂,存在上下层流向不同的现象。为此,在南海西北部(17°27.0'N,110°35.4'E,水深约1 347 m)布放潜标,获得了2017年8月1日—10月31日不同深度的流速、温度和盐度的连续变化。潜标系统中,在80 m和81 m深度处分别设置了两台不同频率的海流剖面仪(acoustic Doppler current profiler, ADCP),1台为向上观测的300 kHz ADCP,1台为向下观测的75 kHz ADCP。两台ADCP的采样间隔均为3 min。300 kHz ADCP每层间隔4 m,共计25层;75 kHz ADCP每层间隔16 m,共计35层。两台ADCP的观测范围从海表到水下640 m深度,可以有效捕捉台风激发的近惯性波。潜标上搭载了温-盐-深传感器(conductivity, temperature, and depth, CTD),可以观测到水深在50 ~300 m范围的温度和盐度变化。CTD在水深60~160 m范围内垂向设置的间隔是10 m,在水深180~300 m范围内垂向设置的间隔是20 m,采样间隔是2 min。
为了方便后续的数据分析,对质量控制后的流速进行了在空间(深度)上的线性插值和时间上的平均处理。在空间上把各个时刻的流速数据统一插值到间隔为8 m的深度坐标上;在时间上把各个深度的流速(3 min采样间隔)和温度、盐度(2 min 采样间隔)数据分别进行30 min时间滑动平均。预处理后流速、温度和盐度数据的采样间隔为30 min,近惯性波在观测站位的周期约为40 h,因此处理后的数据采样间隔不影响对近惯性波的分析。
1.2 台风信息和卫星资料
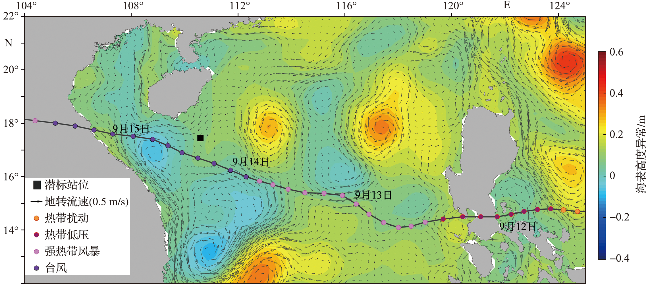
台风“杜苏芮”的路径信息来源于美国联合台风警报中心(Joint Typhoon Warning Center, JTWC),下载地址:https://www.ncei.noaa.gov/products/international-best-track-archive?name=ib-v4-access。数据包括台风中心位置、最大风速、最大风速半径和中心气压等参数,时间分辨率为3 h。台风“杜苏芮”生成于西太平洋,在2017年9月12日由菲律宾南部进入南海,移动速度约为20 km/h;进入南海后向西北方向移动,9月14日0时加强至台风级别,其最大风速达到33 m/s;在向西北移动的过程中继续加强,在9月14日21时台风中心距离潜标站位最近(约57 km),最大风速达到 46 m/s;随后台风继续向西北方向移动,9月15日在越南东部登陆(图1)。
为了计算涡度,下载了卫星高度计反演的海面动力高度和地转流数据,下载地址:https://resources.marine.copernicus.eu/product-detail/SEALEVEL_GLO_PHY_L4_MY_008_047/DATA-ACCESS。该数据为卫星融合后网格化的全球数据,时间分辨率为1天,空间分辨率为1/4°×1/4°。
1.3 方法
近惯性波信号频率集中分布在一个很窄的频率段,通过切比雪夫滤波器来提取近惯性波信号。滤波器的通带为0.85f0~1.25f0 (f0=2Ωsinφ, f0是当地惯性频率,φ为观测站位纬度,Ω为地球旋转频率), 计算得到的当地惯性频率为0.6 cpd,对应的惯性周期约为40 h。为了避免滤波引起相位扭曲,对流速时间序列分别进行了正向和反向两次滤波处理[12]。
v(t)=v0+v1sin(ωot+φ)+R(t)
式中:v(t)是滤波后的近惯性流, t表示时间,ωo和φ分别为拟合观测数据获得的谱峰频率(即观测频率)和相位,v0和v1分别为拟合后流速的平均量和振幅,R(t)是离差。
=f +N2 /(+m2)
式中:N、kh、m分别表示浮力频率、水平波数和垂直波数, feff表示涡度作用下的有效科氏频率[13]:
feff= +1/2(∂v0/∂x-∂u0/∂y)
式中:ζ是涡度,u0,v0分别是由高度计反演得到的东西和南北方向地转流,x和y分别表示东西和南北方向水平距离,f0是根据纬度计算得到的当地惯性频率。
背景流通过多普勒频移影响近惯性频率,可以通过以下公式表达:
ωo-ωi= cos(θ-α)
式中:ωo是近惯性波观测频率,ωi是近惯性波固有频率,U是背景流流速,θ和α分别是背景流方向和近惯性波水平传播方向。
通过低通滤波剔除潮周期、近惯性周期的信号,最终可获得观测站位低频变化的背景流流速。近惯性波固有频率和有效科氏频率满足以下关系:
r=ωi/feff=[(R+1)/(R-1)]2
式中:r是一个比例系数,R是近惯性动能和位能的比值[21]。联合方程(2)、(4)和(5),可以得到:
feff=ωo/[r+(m|U|cos(θ-α)/N)(r2-1)1/2]
通过公式(1)对不同深度近惯性流拟合得到近惯性波的基本参数,其中包括近惯性波观测频率ωo和相位φ,在垂向拟合相位φ得到垂向波数m[22]。公式(6)中的其它变量均为观测数据。用公式(6)可计算出近惯性波有效科氏频率feff,再用公式(5)计算出近惯性波的固有频率ωi。公式(4)可用来分析背景海流作用下观测到的近惯性波频率发生的多普勒频移。
2 结果与分析
2.1 近惯性波及其频率“蓝移”
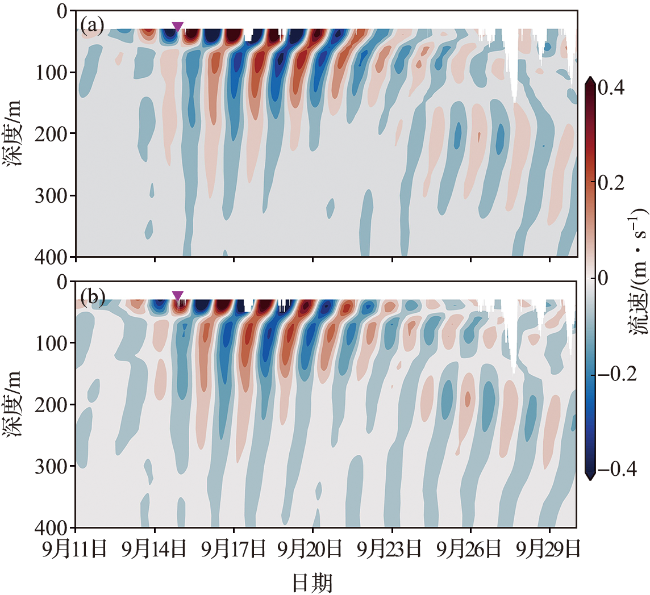
“杜苏芮”台风中心到达潜标站位附近时,在台风风场的强迫下,近惯性振荡在混合层中激发并逐渐加强;在台风离开后,混合层的近惯性振荡信号穿过跃层向海洋深处传播(图2)。9月14日台风激发的表层近惯性波致流(简称近惯性流)流速迅速增大,数值大于0.5 m/s;台风离开后,近惯性波逐渐向海洋更深处传播(图2)。离海面42 m的近表海流在9月14日开始增强,15日达到最大,最大的近惯性流流速超过0.9 m/s。台风过境之后,近惯性流流速大于0.5 m/s的持续时间超过6 d,同时流向随时间变化呈顺时针方向旋转,9月21日以后,近惯性流流速明显减弱。近惯性流在温跃层弱于混合层,在温跃层近惯性流东西向分量最大值接近0.3 m/s,出现在9月19日。近惯性波存在明显向上传播的相速度,这表明近惯性波波群速度向下,即台风激发的近惯性振荡能量以波动的形式穿过跃层向下传播。与前人在南海北部相近站位的观测结果[12,17]比较,此次观测到的近惯性波强度大且传播的深度较深,这可能是因为台风“杜苏芮”强度大,潜标站位距台风路径较近且位于台风路径右侧,海洋对台风的响应更加显著[2,5,7]。
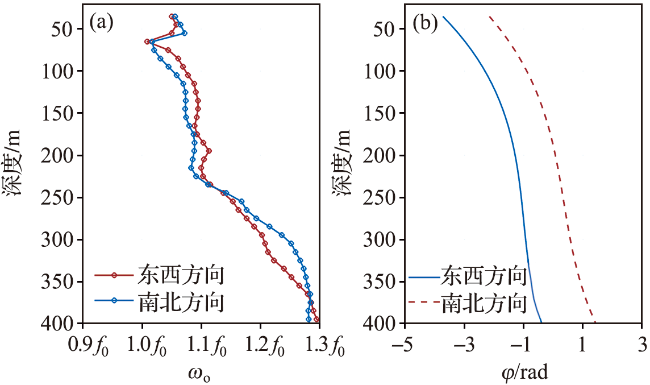
对9月5日—30日各个深度的东西和南北方向流速分别计算功率谱。功率谱显示台风期间能量分布主要集中在近惯性频率的运动,这表明受台风强迫后海水运动以近惯性周期为主导。采用基于方程(1)的最小二乘曲线拟合方法来获取近惯性波频率(图3a)和相位(图3b)。由图3可知,谱峰值对应的频率随深度增加而增大,以东西向流速分量的功率谱为例,近惯性波的谱峰值对应频率在60~70 m深度处接近f0,在400 m深度增加到约1.29f0(图3a)。具体来讲,在水深65 m以浅,近惯性波的频率平均为1.06f0;在水深65~230 m,近惯性频率由1.02f0缓慢增加到1.11f0;在水深230~400 m,近惯性频率由1.11f0迅速增加到约1.25f0。观测过程中整个水深的近惯性波频率均大于f0(即发生蓝移),这与理论上线性内波的传播一致[23]。
2.2 涡度和多普勒效应
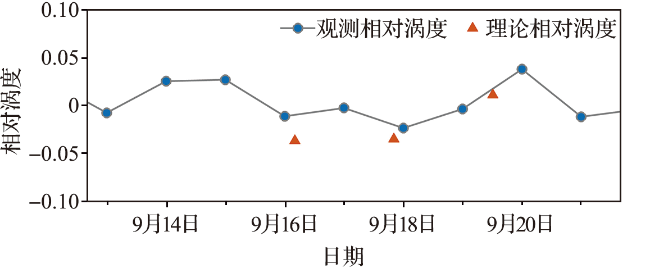
观测站位的涡度变化和背景流引起的多普勒频移都会对近惯性波的频率产生调制作用[11,13]。卫星高度计数据显示在台风期间,没有中尺度涡经过观测站位,地转流的水平剪切引起观测站位涡度的变化。当观测站位涡度相对于行星涡度(即当地惯性频率f0)很小时,涡度引起近惯性波的频移可以用方程(3)表示[13]。为了便于直观理解,图4中用相对涡度(即涡度与行星涡度的比值)来说明涡度的变化。9月14日和15日,观测站位处涡度为正,15日之后减弱至负值并在零值附近浮动,到9月20日转为正值,并达到最大值0.047f0(图4)。9月14日—22日,涡度的平均值约为0.03f0。根据方程(3),有效科氏频率feff值为1.02f0,这与观测中100 m以浅深度的近惯性波频率“蓝移”量级(100 m以浅深度平均值约为1.04f0)较接近,表明正涡度的存在使100 m以浅深度的近惯性振荡出现“蓝移”现象。随着深度的增加,近惯性波频移的增大显著,特别是在230~400 m深度,近惯性波频率迅速由约1.11f0增加到约1.25f0。下面讨论背景流的多普勒效应对频率“蓝移”的贡献。
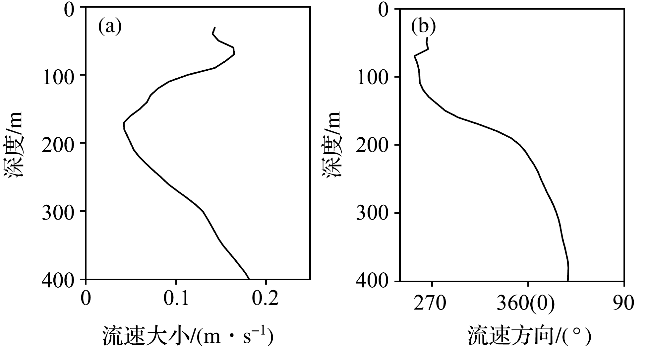
根据方程(4)评估背景流引起的近惯性波多普勒频移需要确定背景流流向和近惯性波的水平传播方向。背景流的流向可通过观测数据来确定。背景流在台风未到达之前(9月5日—13日)大致以100 m深度为分界线,上下层流速方向相反(图5)。100 m以浅的背景流方向为SW方向,流速较小(不超过0.1 m/s),这与图1中的海表地转流方向一致。在9月14日—23日,SW方向背景流流速增强,同时SW方向的背景流深度变大,超过200 m。从台风期间平均的背景流大小和方向随深度的分布(图6)可知,背景流在76 m深度达到0.18 m/s,方向约为265°(SW向);随着深度增加,在76~186 m深度范围内背景流强度减弱,在186 m深度达到最小(0.04 m/s),方向约为300°;在186~400 m深度,背景流的大小开始增强,在400 m深度达到最大(0.19 m/s),方向约为35°。
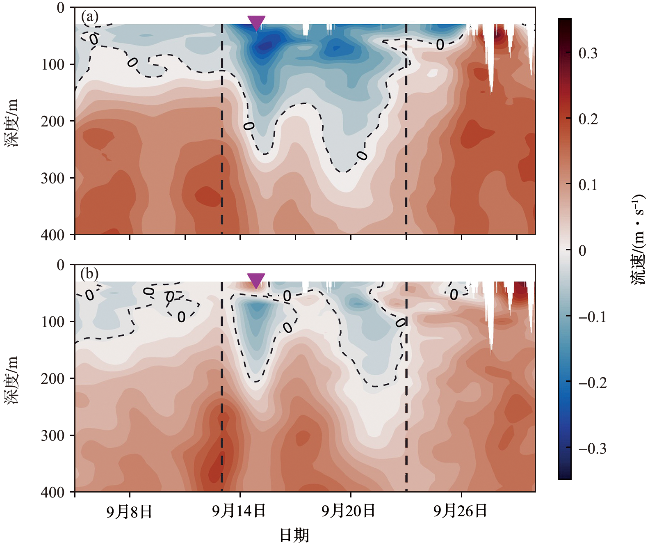
图5 台风期间观测站位背景海流东西分量(a)和南北分量(b)的分布(竖直黑色虚线标出计算台风影响时间范围,紫色三角形表示台风到达时间。) Fig.5 Distribution of eastward (a) and northward (b) components of the background current at the mooring station during typhoon period (The vertical black dashed lines mark the time range of typhoons impact. The purple triangle indicates the arrival time of the typhoon.) |
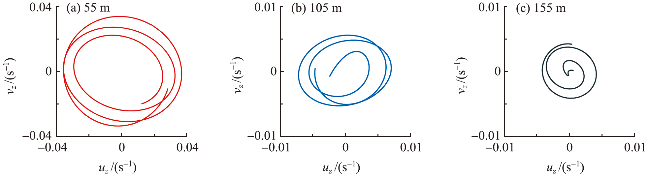
近惯性波的传播方向可以通过两种方法来估算:一种是通过近惯性流剪切和近惯性波引起的密度扰动相位差来确定;另一种是通过近惯性流最大剪切方向来确定[21-22]。为了验证两种近惯性波传播方向估算方法的可靠性,选取三个深度(55 m、105 m和155 m)的近惯性流剪切和近惯性波引起的密度扰动,基于方法一分别计算密度扰动与东西向流速剪切的相干谱和相位谱(图7);基于方法二给出了这三个深度近惯性流剪切矢量图(图8)。在图7中,相干谱和相位谱显示近惯性波传播方向约为90°(E向)。图8a、8b和8c中的近惯性流剪切最大方向分别是91°,89°和97°。对上述两种方法中得到的4个数值取平均,可以计算出近惯性波的传播方向约为92°±4°。使用公式(4)、(5)、(6)分别计算近惯性波有效科氏频率、固有频率和背景流引起的多普勒频移。
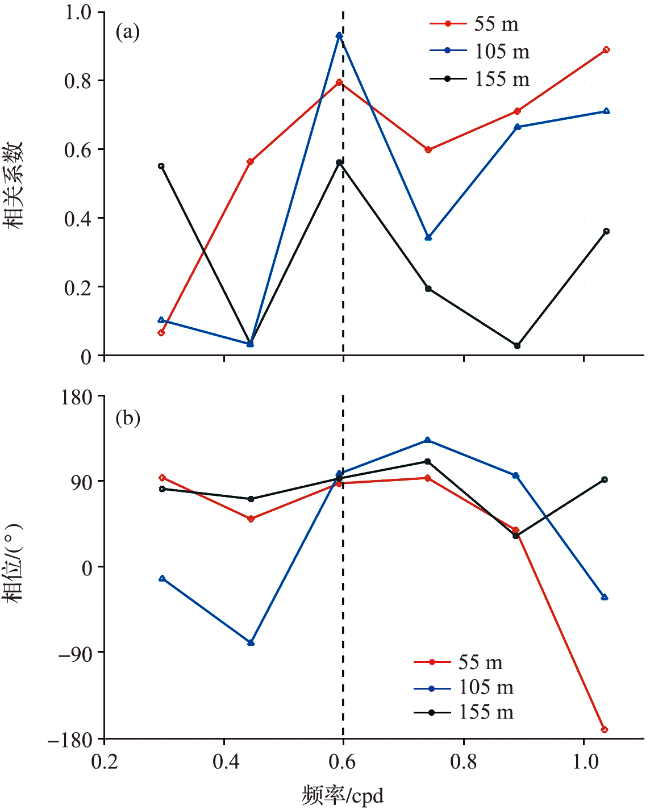
图7 近惯性波引起的密度扰动与东西向流速剪切的相干谱(a)和相位谱(b)(黑色虚线表示当地惯性频率。) Fig.7 Squared coherence (a) and phase (b) between density perturbation and shear in eastward component (The black dashed lines indicate the position of f0.) |
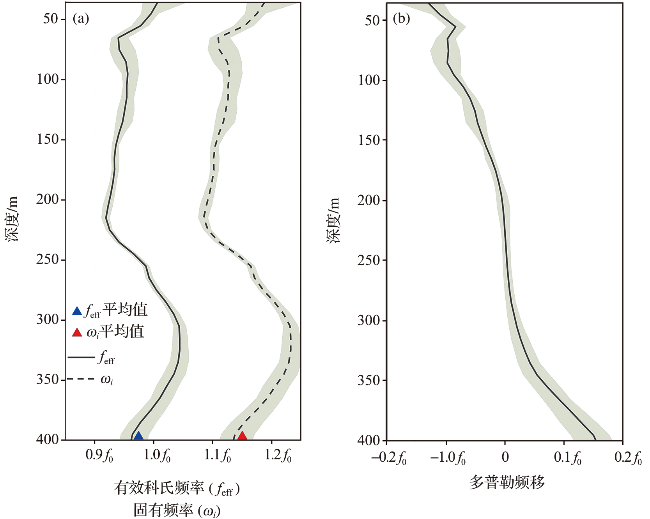
图9 近惯性波有效科氏频率与固有频率(a)和背景流引起的多普勒频移(b)在垂直方向的分布(阴影代表置信区间。) Fig.9 Vertical distribution of the effective Coriolis frequency and intrinsic frequency of near-inertial waves (a) and Doppler shift of the waves induced by background current(b) (The shaded areas represent confidence interval.) |
从增加趋势和量级上来看,背景流引起的多普勒频移随深度的分布与近惯性波的观测频率随深度的变化保持一致(图9b和图3a)。200 m以浅的背景流方向与近惯性波的传播方向相反(相差约180°),背景流的多普勒效应为负值,导致近惯性波观测频率较小,低于固有频率;随着深度增加,背景流迅速减小,在200 m深度附近背景流引起的多普勒频移接近零。与此同时,背景流方向在180~230 m深度约为360°,与近惯性波传播方向几乎垂直,导致多普勒频移趋近于零。在300~400 m深度范围背景流强度最大,同时其方向与近惯性波传播方向接近,引起的多普勒频移为正,且偏移数值最大,这样也解释了观测到的近惯性波频率在该深度范围内偏移最大。
3 结论
基于南海西北部的潜标观测资料,采用近惯性波理论,首次在该区域定量分析了背景流引起的多普勒频移对近惯性波频率随深度分布的影响,为台风激发的近惯性波频率演变提供了新的观测依据。观测数据表明近惯性波频率大于当地惯性频率,并且随着深度增加频率由1.06f0 增加到1.25f0,特别是在深度230~400 m范围内近惯性波频率增加显著。通过对涡度效应和背景流引起的多普勒效应分别进行分析,提出背景海流的多普勒效应是近惯性波频率随深度增加的主要因素:200 m以浅深度的背景流方向与近惯性波的传播方向相反,多普勒效应为负,会引起近惯性波观测频率小于固有频率;在200 m深度附近背景流方向约为360°,与近惯性波传播方向几乎垂直,导致多普勒效应趋近于零,该深度的近惯性波观测频率与固有频率接近;在230~400 m深度,背景流强度达到最大,同时其方向与近惯性波传播方向接近,因此引起的多普勒正频移最大,在此深度范围观测到的近惯性波频率偏移也最大,这很好地解释了观测频率在该深度范围的显著增加。