
0 引言
海洋潮汐是地球自转时太阳和月球引力变化引起海水周期性涨落的现象,它直接影响航海、渔业、水文测量、海洋工程以及国防和军事活动。验潮站、压力式验潮仪以及卫星高度计是目前潮位数据的主要来源。其中,因验潮站站位少、分布不均,会产生数据量不足、空间分辨率低的问题;利用压力式验潮仪采集数据时,常面临因仪器丢失导致数据缺失问题或因仪器姿态不正确导致数据无效问题;通过卫星高度计测量潮位时则会因为反射的雷达信号受到复杂海岸地形的干扰而影响测量精度[1⇓-3]。全球导航卫星系统(Global Navigation Satellite System,GNSS)精密单点定位(precise point position,PPP)技术可以仅通过一个接收机就实现厘米级精度的全球定位[4-5],在地震波探测[6]、测高校准[7]、变形监测[8]等方面得到了广泛应用。由于PPP无需建立基准站,不受作用距离的限制,已有多个研究证实其用于验潮是可行的[9⇓-11]。近期研究发现,与较低采样率的测定结果相比,高采样率没有提高PPP定位结果的准确性[12];在较短观测期内,增加采样率会影响PPP解算的收敛时间,而在较长的观测期中,这种影响会大幅度降低[13]。海洋环境恶劣、测量周期长、数据类型多、作业成本大,高采样率PPP在充分捕捉复杂海面高程信息的同时也加重了数据存储、处理方面的负担,而过低的采样率可能会因数据量少导致信号失真、频谱丢失的问题,并最终影响到潮位测量的精度。因此有必要开展在海洋这种动态环境下采样率对PPP验潮精度的影响研究。
本文研究了采样周期对BDS/GNSS PPP验潮精度的影响以及BDS/GPS/GLONASS三系统组合对提高PPP验潮精度的影响,可以为PPP技术在验潮中的应用提供重要参考,对改进海洋测量和定位技术、优化验潮卫星系统选择均具有重要意义。
1 PPP原理和验潮应用
1.1 PPP原理
PPP采用单台双频GNSS接收机接收观测数据,利用国际GNSS服务中心提供的精密星历和卫星钟差产品对观测过程中的各种误差项进行模型改正,实现高精度定位[18]。其中电离层延迟误差通过双频信号组合消除,对流层延迟误差通过引入未知参数进行消除,观测方程如下:
PIF= P1- P2=ρ+c·(dt-dT)+T+Dr-ds+dm+εp
LIF= L1- L2=ρ+c·(dt-dT)+T+Br-bs+NIF+δm+εL
式中:ΡIF、LIF分别为无电离层组合的伪距和相位观测值,P1和P2为伪距观测值, L1和L2为载波相位观测值,f1、f2分别为L1和L2的频率,ρ为站星几何距离,с为真空光速,dt 为接收机钟差,dT为卫星钟差,T为对流层延迟误差,NIF为双频无电离层组合模糊度,Dr、ds分别为相应的接收机端伪距硬件延迟和卫星端伪距硬件延迟,Br、bs分别为相应的接收机端相位硬件延迟和卫星端相位硬件延迟,dm为组合伪距观测值的多路径效应,δm为组合相位观测值的多路径效应,εp为组合伪距观测噪声,εL为组合相位观测噪声[19]。
1.2 PPP验潮
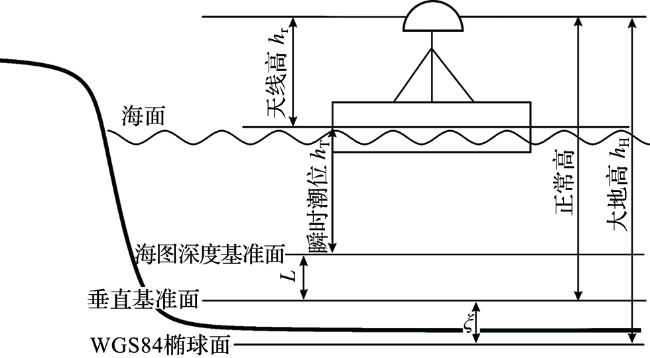
基于PPP技术,通过海上移动平台动态GNSS数据采集、数据解算、数据预处理、高程基准转换、滤波等步骤实现潮位数据的提取,其基本原理如图1所示。海上移动平台的GNSS接收机接收到电磁信号,通过PPP定位解算软件计算得到其在WGS84坐标系下的大地高hH,大地高hH减去GNSS天线高度hr得到海面大地高,对海面大地高进行高程异常修正得到海面正常高,最后将海面正常高进行海图深度基准转换,得到瞬时潮位hT,公式如下:
hT=hH-hr-L-ξ
式中:hT为瞬时潮位,hH为WGS84坐标系下的大地高,hr为GNSS天线到海面的高度,L为深度基准差,ξ为高程异常值。
2 数据与方法
2.1 数据来源
在我国南海海域布置了两个各搭载有1台GNSS接收机的海上移动平台,两平台相距100 km,位置相对固定。接收机的数据采集周期为30 s,观测时间为2021年5月1日—5月31日[年积日为121—151],共31 d。采用武汉大学IGS数据中心(www.igs.gnsswhu.cn/)提供的精密卫星轨道和钟差产品对观测数据误差进行模型改正。
2.2 数据处理
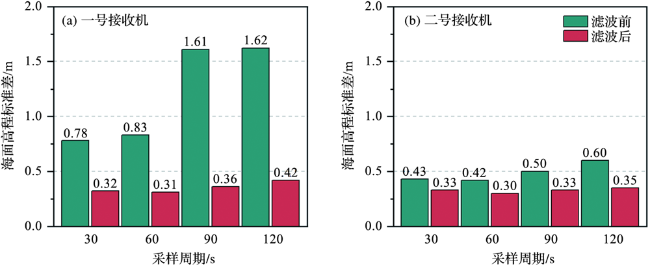
由于海上移动平台离岸较远,平台周围无长期验潮站,因此实验中无法获得验潮站潮位数据作为测定的真实值,而两个平台相距不远,位置相对固定,潮位提取过程中的高程基准转换可视为系统性偏差进行改正[20],因此可以通过两接收机的潮位差间接分析采样周期对验潮精度的影响。主要步骤如下:首先对原始海面高程数据进行粗差剔除处理,再滤波去除波浪影响,得到潮位数据;将两台接收机测量的潮位数据求平均值,再分别与平均值作差,消除系统性误差的影响,以标准差为精度评价指标,分析不同采样周期对PPP验潮精度的影响。
2.2.1 数据解算
将测量期间收集的GNSS数据转换为包含GPS/GLONASS双系统组合(以下简称双系统)和BDS/GPS/GLONASS三系统组合(以下简称三系统)的RINEX格式,分别抽取为60 s、90 s、120 s采样周期的数据集,应用Trip软件进行动态处理,得到GNSS接收机在海面的高程坐标。表1列出了PPP数据解算过程中的参数模型和处理策略,其中接收机时钟误差视为白噪声,其他误差源都使用标准模型进行校正。
表1 PPP处理策略汇总表Tab.1 Summary table of PPP processing strategy |
| 参数 | 策略 |
|---|---|
| 处理模式 | 动态处理 |
| 卫星观测系统 | GPS,GLONASS,BDS |
| 观测值类型 | 伪距和载波相位 |
| 频率 | GPS/GLONASS(L1,L2),BDS(B1,B2) |
| 卫星轨道和钟差 | wum最终产品 |
| 卫星产品格式 | RINEX |
| 产品插值 | 是 |
| 对流层模型 | 参数估计 |
| 电离层模型 | 无电离层组合 |
| 卫星截止高度角 | 10° |
| 观测周期 | 30 s; 60 s;90 s;120 s |
| 天线相位改正 | PCO+PCV改正 |
| 相位缠绕改正 | 模型改正 |
| 模糊度固定方法 | 固定解 |
2.2.2 剔除粗差
影响GNSS接收机接收数据的主要因素有海况、GNSS天线周围的电磁干扰和降雨等。海况太差会导致接收机所在海上移动平台横滚、俯仰角度过大,失去对卫星信号的锁定;接收器天线周围的电磁干扰和降雨会使卫星信号衰减,导致部分数据的质量差,解算结果存在粗差,影响测量准确性。以拉以达准则进行粗差剔除处理,即对每天的海面高程数据求取算术平均值和标准差σ,当第i时刻的值Xi满足|Xi-X|>3σ,将其作为粗差舍去[21]。
2.2.3 滤波
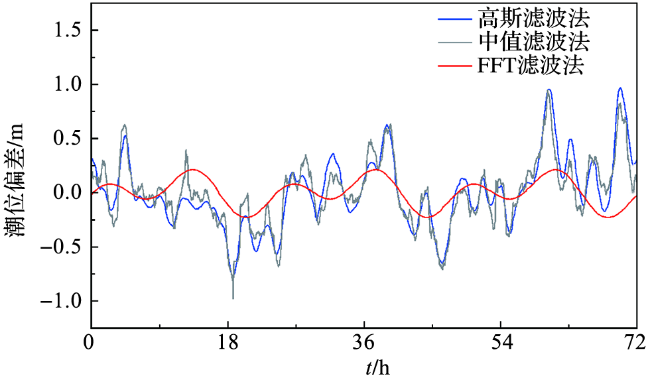
图2 基于不同滤波方法的潮位偏差分布Fig.2 Tidal level deviance distribution based on different filtering methods |
表2 基于不同滤波方法的潮位偏差统计Tab.2 Statistical results of tidal level deviance based on different filtering methods |
| 滤波方法 | 最大偏差/m | 最小偏差/m | 标准差/m |
|---|---|---|---|
| FFT滤波法 | 0.212 | -0.228 | 0.125 |
| 高斯滤波法 | 0.967 | -0.778 | 0.323 |
| 中值滤波法 | 0.944 | -0.980 | 0.301 |
3 结果与分析
3.1 FFT滤波效果
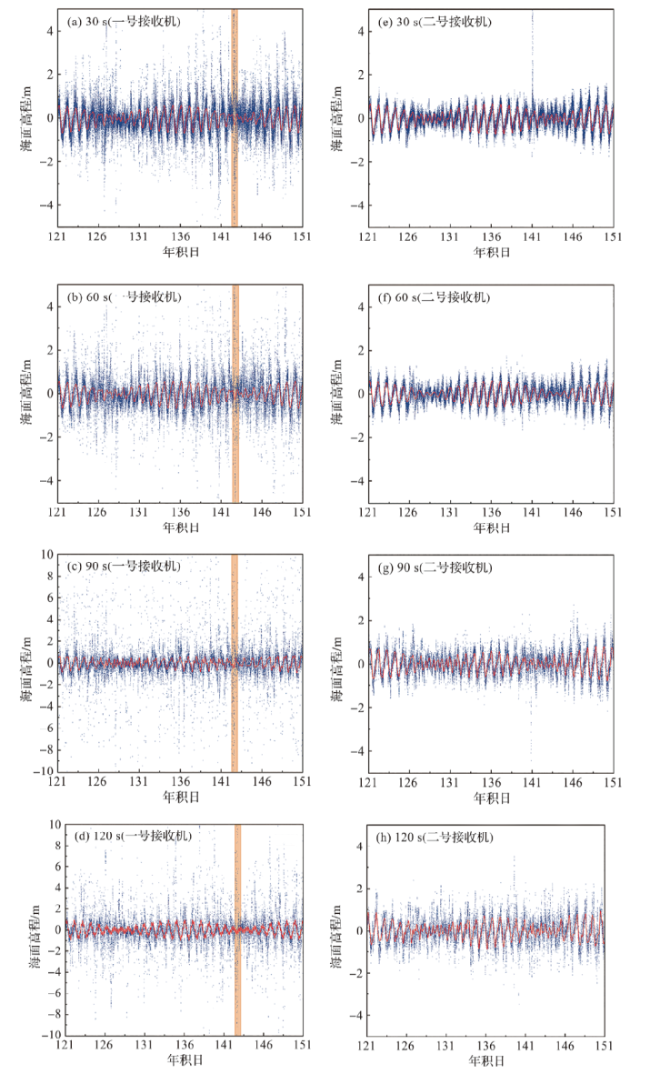
图3 滤波前、后海面高程数据对比(橙色表示年积日为143时的海面高程,蓝点是原始海面高程,红线是滤波后的海面高程。) Fig.3 Comparison of sea level elevation data before and after filtering (Orange indicates the sea level elevation at DOY 143, the blue dots are the raw sea level elevation measured by GNSS, and the red line is the filtered sea level elevation data.) |
3.2 采样周期对三系统PPP验潮精度的影响
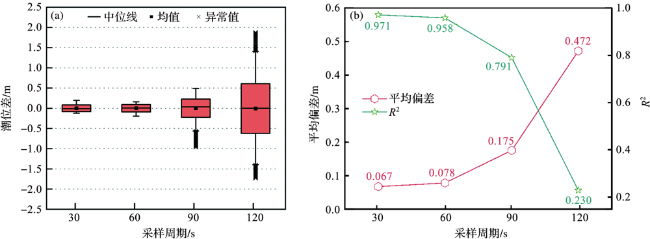
四种采样周期测量精度统计结果(表3)显示,精度(标准差)随采样周期缩短而提升。当采样周期由120 s减小到90 s时,精度提升了63.0%;当采样周期从90 s到60 s时,精度提升了60.4%;而60 s和30 s的测量精度相当,从60 s到30 s,精度只提升了10.0%。上述结果表明,在PPP潮位测量中,缩短采样周期可以提高测量精度,但当周期缩短至一定值后,精度的提升不再明显。
表3 不同采样周期潮位测量精度对比Tab.3 Comparison of measuring accuracy of tidal level at different sampling periods |
| 采样周期 | 平均偏差/m | 标准差/m | R2 |
|---|---|---|---|
| 30 s | 0.067 | 0.081 | 0.971 |
| 60 s | 0.078 | 0.090 | 0.958 |
| 90 s | 0.175 | 0.227 | 0.791 |
| 120 s | 0.472 | 0.613 | 0.230 |
3.3 BDS系统对PPP验潮精度的影响
为分析增加北斗卫星观测数据对提升多系统组合PPP验潮精度的影响,对GPS/GLONASS双系统PPP与BDS/GPS/GLONASS三系统PPP在不同采样周期下的潮位结果进行了比较。在双系统PPP验潮中,最小采样周期下潮位差小于1 m的数据累积不足90%,其他采样周期下潮位差小于1 m的数据累积不足80%;在三系统PPP验潮时,各采样周期下潮位差在1 m以内的数据累积均达到了90%,精度较双系统PPP有了大幅提升(图6)。
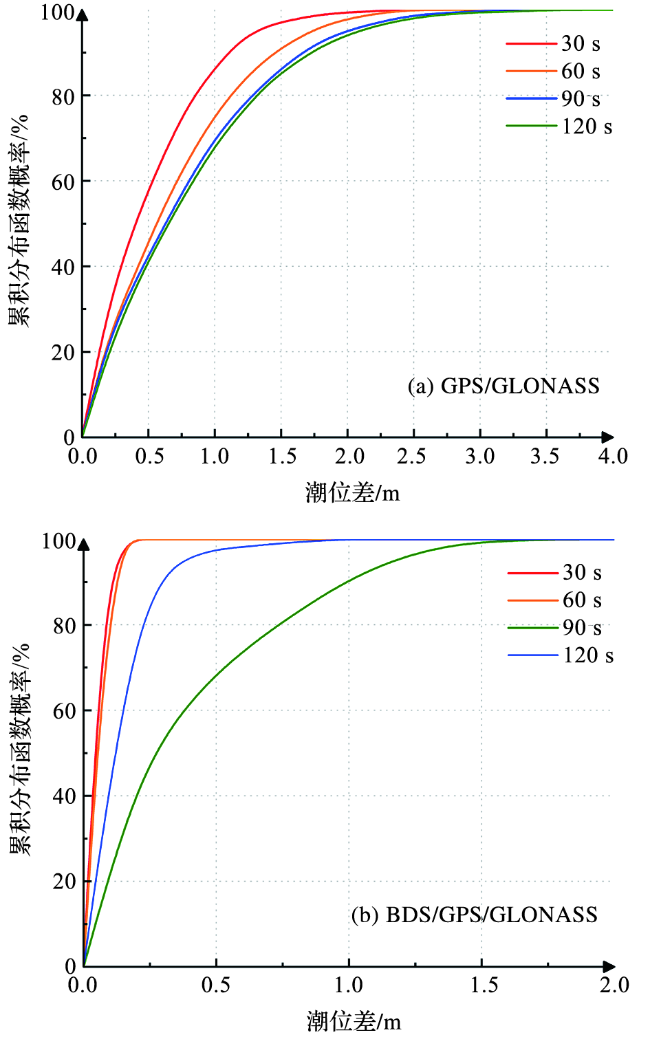
表4显示,三系统PPP的标准差、最大偏差、最小偏差均小于双系统PPP。在30 s采样周期下,潮位标准差由0.733 m(双系统PPP)降低到0.081 m(三系统PPP),精度提升了88.9%;在60 s采样周期下,潮位标准差由0.936 m(双系统PPP)降低到0.090 m(三系统PPP),精度提升了90.4%;在90 s采样周期下,潮位标准差由1.065 m(双系统PPP)降低到0.227 m(三系统PPP),精度提升了78.7%;在120 s采样周期下,潮位标准差由1.108 m(双系统PPP)降低到0.613 m(三系统PPP),精度提升了44.7%。随着采样周期缩短,双系统PPP和三系统PPP测量潮位的标准差均下降。三系统PPP验潮中,30 s和60 s采样周期下的潮位测量精度比90 s和120 s更高。
表4 三系统PPP与双系统PPP验潮结果差异统计Tab.4 Statistical differences of tide test results of the three-systems PPP and the dual-systems PPP 单位/m |
| 采样 周期 | 标准差 | 最大偏差 | 最小偏差 | |||||
|---|---|---|---|---|---|---|---|---|
| 三系统 | 双系统 | 三系统 | 双系统 | 三系统 | 双系统 | |||
| 30 s | 0.081 | 0.733 | 0.197 | 2.007 | -0.122 | -2.389 | ||
| 60 s | 0.090 | 0.936 | 0.158 | 2.588 | -0.194 | -2.708 | ||
| 90 s | 0.227 | 1.065 | 0.488 | 3.522 | -0.965 | -2.614 | ||
| 120 s | 0.613 | 1.108 | 1.885 | 3.395 | -1.735 | -3.738 | ||
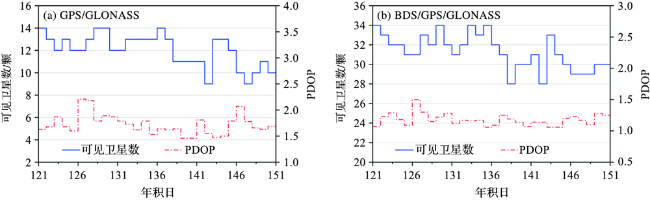
通过可见卫星数和位置精度因子(position dilution of precision, PDOP)分析北斗卫星数据对提升验潮精度的原因。卫星数量越多, PDOP值越低,其空间几何构型强度越大,定位精度越高。
4 结论
本文利用两个各搭载1台GNSS接收机的海上移动平台进行潮位动态监测,对30 s、60 s、90 s、120 s四种采样周期下BDS/GNSS精密单点定位验潮精度进行了实验。结果表明,随着采样周期延长,验潮精度下降,当采样周期超过60 s后,精度大幅度降低。120 s、90 s、60 s、30 s采样周期下潮位精度分别为0.613 m、0.227 m、0.090 m、0.081 m,随着采样周期依次缩短,精度提升分别为63.0%、60.4%和10.0%。相比双系统PPP,加入BDS后的三系统组合PPP验潮精度有大幅提升,在30 s、60 s、90 s、120 s采样周期下精度分别提升88.9%、90.4%、78.7%和44.7%。加入北斗卫星系统数据对提升验潮精度的影响大于采样周期的影响。