
0 引言
海洋内波是发生在密度稳定的层化海洋内部的波动,它产生的湍流混合是海水混合的主要形式之一。内波破碎产生的湍流混合不仅对水体交换、能量输运和全球的翻转流产生重要影响,还能够将深海的营养盐输送到海洋上层,促进海洋上层初级生产力[1-2]和改变生态环境。海洋内波以约化重力和科氏力的合力为恢复力,使流体质点在平衡位置做周期性振荡。海洋内波产生湍流混合的能量来源主要是潮汐和风。根据产生机制的不同,海洋内波可分为以下两种类型[3]:一是海底地形和强潮汐相互作用产生的内潮;二是表面风场激发的近惯性内波。内潮在传播过程中发生破碎,使能量从大尺度转移到小尺度上,从而增强了湍流混合[4]。风作用于海表面,当风的频率接近于地球的固有频率,二者发生共振时,会在海洋上层产生近惯性运动,该运动一部分在海洋上层耗散,另一部分则以近惯性内波的形式向深海传播[5-6]。近惯性内波自身的剪切不稳定性会导致海洋内波破碎,从而产生小尺度的湍流运动,引起海洋内部湍流混合[7]。
根据MUNK[8]的估算,为了维持大洋翻转环流的强度,大洋中需要的平均内波混合垂向扩散率约为10-4m2/s,而维持这种混合强度至少需要2.1 TW的能量输入,其中,约0.9 TW的能量来自内潮,约1.2 TW的能量来自风场。由于湍流混合难以量化,目前大多数模式的垂向内波混合扩散率都取常数。然而受地形[9]、风应力[10]、涡旋[11]等因素的影响,海洋内波混合的垂向扩散率在时空上的分布是不均匀的。NAVEIRA等[12]基于德雷克海峡断面的实测数据发现,地形粗糙处的耗散率在深度上积分的量级可达10-3 W/m2,扩散率的量级可达10-2 m2/s,混合强度显著高于大洋背景场。为加深对全球海洋内波混合时空变化以及生成机制的理解,LI等[13]基于10 000个CTD数据探究了西北太平洋湍流混合的分布特征,结果表明,300~1 800 m深度范围内的湍流混合与风生近惯性能通量之间存在显著相关性,而在3 300 m以下至海底区域的湍流混合则与地形粗糙度显著相关。WHALEN等[11]基于全球Argo数据和MERRA-2风应力数据探究了内波混合和风生近惯性能通量的关系,结果表明二者呈正相关。不仅如此,他们还基于浮标数据计算涡动能,将高涡动能和低涡动能分开,发现高涡动能海域的内波混合总是大于低涡动能海域的内波混合。LI等[14]基于黑潮区域的温、盐、流观测数据,通过对比分析发现中尺度涡可以捕获近惯性内波,促进近惯性能量向下传递,进一步驱动海洋内部的跨密度面混合。影响湍流混合的因素多种多样,这对量化湍流混合造成一定的困难,因此,科学家们一直致力于提高计算垂直内波混合扩散率的准确性。WHALEN等[7]基于细尺度参数化方法,使用Argo数据计算了全球250 m以深的内波混合,发现赤道、西太平洋等海域均存在较强的内波混合,但是缺少全球海域内波混合的季节变化研究。WATERHOUSE等[15]基于大约5 200条CTD观测剖面数据计算了全球混合层底部到1 000 m深度的内波混合,发现东印度洋和北太平洋等海域的内波混合较弱,但也没有给出季节变化。
理解内波混合的季节变化特征有利于提高数值模式对大尺度环流和全球变化的预报能力。JING等[10]基于西北太平洋CTD数据,发现内波混合和风场大小的季节变化一致。WU等[9]基于南大洋Argo数据,发现在平滑地形上内波混合的季节变化与风生近惯性能通量的季节变化具有很好的相关性。此外,WHALEN等[11]发现30°N—40°N区域内波混合的季节循环与风生近惯性能通量的季节循环一致。综上,前人的研究集中在特定区域,其他海域内波混合与风生近惯性能通量是否具有相关性还有待深入研究。本文将探索全球海域不同季节内波混合的空间分布,展现在不同海域和不同季节内波混合垂直扩散率的差异以及全球海域在不同季节内波混合与风生近惯性能通量的关系。
1 数据和方法
1.1 数据资料
本文将计算全球海洋的内波混合扩散率、耗散率、风生近惯性能通量和涡动能四个变量,具体为基于温、盐数据计算扩散率和耗散率,基于风应力数据计算风生近惯性能通量,基于地转流异常流速数据计算涡动能。
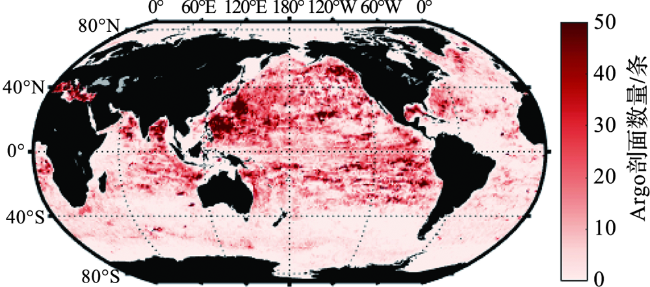
温、盐数据剖面来自中国Argo实时资料中心,可通过网络(ftp://ftp.argo.org.cn/pub/ARGO/global/)免费获取[16],所有的剖面在发布之前都经过质量再控制,标记好“1”、“2”、“3”、“4”,“1”表示通过质量控制,“2”、“3”、“4”表示没有通过质量控制[11]。本研究选取质量控制标记为“1”的温、盐数据剖面。从选取的2006—2021年全球范围数据中,筛选垂直分辨率为2~10 m、测量水深大于600 m的温、盐数据剖面,可用的温、盐数据剖面共有29万多条,基本上能覆盖全球(图1)。
风应力数据来自美国国家航空航天局的MERRA-2(Modern-Era Retrospective Analysis for Research and Applications Versions 2)再分析资料(https://disc.gsfc.nasa.gov/)[11]。空间分辨率为0.500°×0.625°,时间分辨率为1 h,时间范围为2006—2021年。
地转流流速从法国AVISO (Archiving, Validation and Interpretation of Satellite Oceanographic Data)卫星数据获得(https://www.aviso.altimetry.fr/)。该数据融合了ERS-1、ERS-2、T/P、GFO、Jason-1、Jason-2、Cryosat2、Saral/AltiKa、HY-2等多种卫星资料,其空间分辨率为0.25°×0.25°,时间分辨率为1 d,可以用于识别海表涡旋[17]。本文选取2006—2021年的准实时地转流流速资料去计算海表涡动能。
1.2 方法
1.2.1 内波混合的计算
K=K0 h2(Rω)j(f/N)
式中:K0是参考湍动能扩散率,为5×10⁻⁶ m2/s;< >表示细尺度上内波的应变方差;GM< >是GM内波谱的应变方差; j(f/N)是内波场中关于纬度影响的修正项;h2(Rω)是内波场中关于内波结构的修正项。
j(f/N)=
式中: f是科氏参数; f30是南北纬30°的科氏参数;N是浮力频率;N0是参考浮力频率,取值5.24×10⁻³ rad/s。
h2(Rω)=
Rω=
式中:Rω表示剪切/应变方差比,ω是内波的频率,< >表示流速剪切方差,z代表海水深度, 是对子剖面的位势密度进行二次拟合得到的层结均值。
混合层和季节性温跃层主要对海洋上层250 m以浅产生影响,在250 m以浅的深度上,细尺度参数化方程计算得到的内波混合扩散率会有很大的误差。因此,本文只采用250 m以深的数据,将每个Argo剖面数据分为250~500 m,500~750 m和750~1 000 m这三个深度段去计算平均扩散率和耗散率,每段深度的垂向应变可基于浮力频率计算:
ξz=
N2=-
式中:σ是位势密度;g是重力加速度,取值9.8 m/s;ρ0是海水密度,取值1 025 kg/m3; 是对子剖面内的位势密度进行二次拟合得到的层结的浮力频率均值。
基于多窗谱方法得到每段深度的垂向应变波数谱φ(k),再对其进行空间积分,得到应变方差:
式中:k是波数。
k*=
式中:E0为无量纲能量,取值6.3×10⁻⁵;b为温跃层垂向尺度,取值1 300 m; j*为参考模态数,取值3。
耗散率ε可通过下式计算:
ε=
式中:Γ是混合效率,根据层化剪切流的实验研究和数值模拟,理查森数为0.17,那么Γ为0.2[22]。
1.2.2 风生近惯性能通量的计算
r(θ)=r0(1- )
式中:r0为常数,取值0.15f;θc为临界频率,取值f/2[25]。
因为赤道附近海域的科氏频率较小,平板模型在赤道附近并不适用[26],因此本文仅计算了赤道以南和以北10°以外海域的风生近惯性能通量。
基于公式(11)可获得u和v,进而可计算风场向海洋混合层输入的近惯性能通量Π:
Π=(τx,τy)·(u,v)
1.2.3 涡动能的计算
2 结果与分析
2.1 内波混合的空间分布
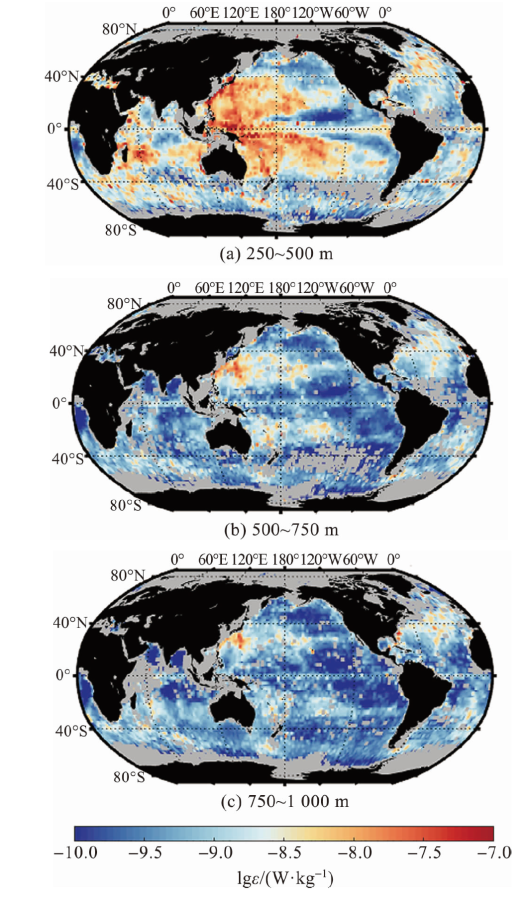
水深为250~500 m、500~750 m、750~1 000 m的平均内波混合扩散率和耗散率的空间分布分别如图2和图3所示。在250~500 m深度内,内波混合扩散率的空间分布量级为10-6~10-3,耗散率的空间分布量级为10-10~10-7,与WHALEN等[7]计算的结果一致。在这个深度内,西太平洋和北大西洋海域,平均内波混合扩散率和耗散率都比较大:西太平洋K=1.0×10⁻⁴m2/s,ε=1.2×10-8W/kg;北大西洋K=1.2×10-4m2/s,ε=3.4×10-9W/kg。在40°N以北的北太平洋海域,平均内波混合扩散率和耗散率都比较小,K=2.4×10-5m2/s,ε=1.4×10-9W/kg。在南大洋海域(40°S—70°S),平均内波混合扩散率较大( K=7.4×10⁻⁵m2/s),而平均耗散率较小(ε=2.1×10-9W/kg),这是由南大洋较小的浮力频率造成的。平均内波混合耗散率随着深度增加而减小,如250~500 m、500~750 m和750~1 000 m的全球平均内波混合耗散率分别为4.9×10⁻⁹W/kg、1.1×10-9W/kg和8.5×10-10W/kg;但是平均内波混合扩散率随着深度增加没有明显变化,这三个深度的全球平均内波混合扩散率分别为5.7×10-5m2/s,2.3×10-5m2/s和2.5×10-5m2/s,这是因为浮力频率在深水区较小。尽管西太平洋和北大西洋海域500~700 m与750~1 000 m深度的内波混合强度显著弱于250~500 m深度,但这两个海域仍表现出相对较高的平均内波混合扩散率与耗散率。水深500~750 m时,西太平洋K=3.0×10⁻⁵m2/s,ε=3.0×10-9W/kg,北大西洋K=6.7×10-5m2/s,ε=2.3×10-9W/kg;水深750~1 000 m时,西太平洋K=3.4×10⁻⁵m2/s,ε=1.9×10-9W/kg,北大西洋K=6.5×10-5m2/s,ε=2.0×10-9W/kg。
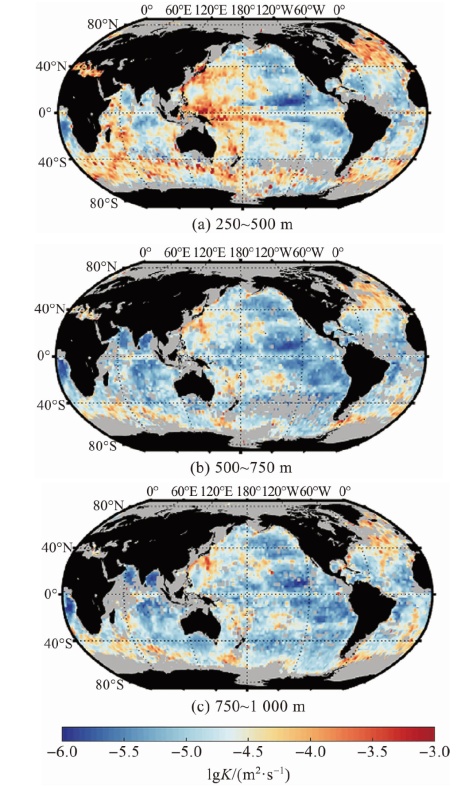
图2 全球不同深度的平均内波混合扩散率(计算结果的空间分辨率为1°×1°。图中灰色区域代表没有数据的海域。) Fig.2 The global averaged internal wave-induced mixing diffusivity at different depths (Spatial resolution of the calculation results is 1°×1°. The gray areas in the figure represent seas for which there is no data.) |
2.2 风生近惯性能通量和涡旋对内波混合空间分布的影响
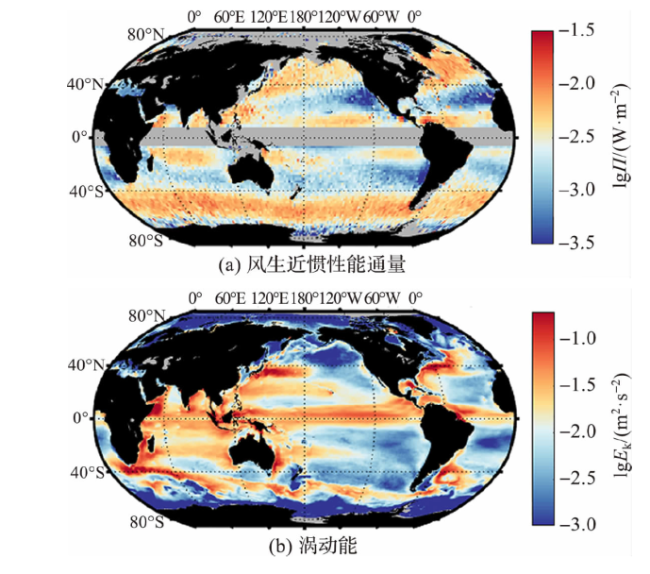
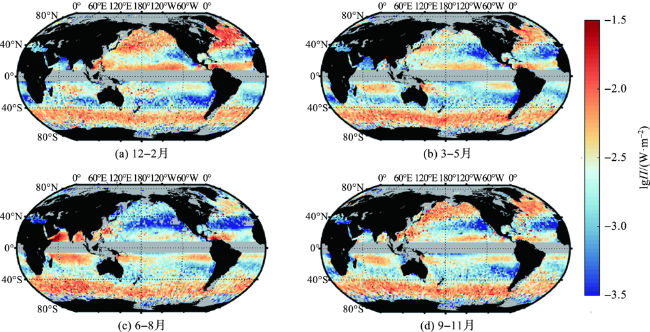
全球表层风生近惯性能通量的空间分布如图4a所示,其量级约为10-5~10-2,全球平均风生近惯性能通量为3.6×10⁻³W/m2,60°S—60°N范围内的总功率为1.0 TW,与RIMAC等[27]的计算结果一致。在北大西洋和南大洋,风生近惯性能通量分别为6.4×10⁻³W/m2和5.1×10-3W/m2,与内波混合空间分布一致,两个区域的风生近惯性通量都较大。40°N以北的北太平洋风生近惯性能通量也较大,为4.1×10-3W/m2,但其内波混合较小。西太平洋风生近惯性能通量和内波混合扩散率的空间分布也不一致,这是因为涡旋会调控风输入到海洋的近惯性能量。涡旋通过捕捉近惯性内波,并基于“惯性烟囱”效应[14],驱动近惯性能量向深海进行垂向传递,从而增强深海的湍流混合过程。在西太平洋,涡动能和内波混合扩散率都比较大(涡动能为2.1×10-2 m2/s2),而在40°N以北的北太平洋海域,涡动能和内波混合扩散率都比较小(涡动能为8.0×10-3 m2/s2)。在高涡动能海域,例如西太平洋,涡旋会将能量向下传递,使得风生近惯性能量在海洋内部耗散,增强海洋内部的内波混合;在低涡动能海域,例如40°N以北的北太平洋,风生近惯性能量大部分在海洋上层耗散,只有很少部分能传递到海洋内部。
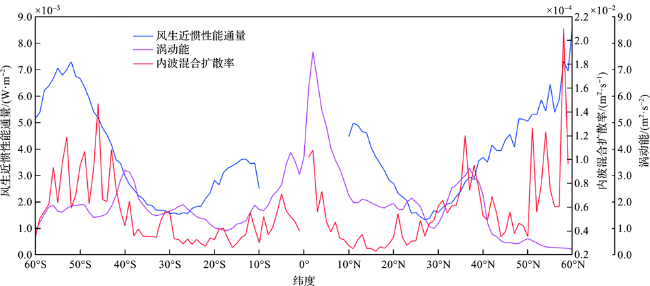
风生近惯性能通量、内波混合扩散率和涡动能随纬度的变化见图5。在南、北半球的高纬度(40°—60°)和低纬度(10°—20°)海域,风生近惯性能通量比较大。在南半球高纬度海域的风生近惯性能通量可达7.1×10⁻³ W/m2,低纬度海域可达3.6×10-3 W/m2;在北半球高纬度海域风生近惯性能通量可达8.7×10-3 W/m2,低纬度海域可达5.0×10-3 W/m2。在中纬度(20°—40°)海域,风生近惯性能通量比较小,南半球最低为1.6×10-3 W/m2,北半球最低为1.3×10-3 W/m2。与风生近惯性能通量不同的是,内波混合扩散率在低纬度海域比较小,南半球最小值为2.6×10-5 m2/s,北半球最小值为2.3×10-5 m2/s;在南半球45°S—60°S、北半球30°N—40°N和50°N—60°N,内波混合扩散率比较大,最大值分别为1.5×10-4 m2/s、1.2×10-4 m2/s和2.1×10-4 m2/s。在45°S—60°S和50°N—60°N处,风生近惯性能通量比较大,使得内波混合扩散率也比较大;在30°N—40°N处,风生近惯性能通量比较小,内波混合扩散率却比较大,原因是较大的涡动能增强了内波混合;在40°N—50°N处,尽管风生近惯性能通量比较大,但是较低的涡动能减弱了内波混合。这表明风生近惯性能通量在高纬度对内波混合的影响比较大,涡旋在中纬度对内波混合的影响比较大。尽管无法通过计算得到赤道上的风生近惯性能通量,但是计算得到赤道上的内波混合扩散率很大,一方面是因为受到涡旋的影响,另一方面则是因为赤道上其他动力过程产生的应变导致计算得到的内波混合扩散率被高估[7]。在10°N—20°N,风输入近惯性能通量以及涡动能均为中等大小,内波混合扩散率却比较小。这是因为东太平洋区域的内波混合相对较弱(图2),这会降低整个纬度带的平均内波混合扩散率。东太平洋区域内波混合的减弱主要是由于海底地形的平滑性质所导致的,平滑的地形条件限制了海洋中湍流混合的发展,从而影响了海洋的垂直混合过程[28]。
2.3 风生近惯性能通量对内波混合季节变化的影响
12—2月在北半球是冬季,在南半球是夏季;3—5月在北半球是春季,在南半球是秋季;6—8月在北半球是夏季,在南半球是冬季;9—11月在北半球是秋季,在南半球是春季。图6、图7和图8展示了全球平均内波混合扩散率、耗散率和风生近惯性能通量的季节变化。全球平均内波混合扩散率、耗散率和风生近惯性能通量在12—2月最大,平均值分别为5.7×10⁻⁵m2/s、 5.6×10⁻⁹W/kg和3.1×10-3W/m2;其次是在9—11月,平均值分别为5.3×10-5m2/s、5.2×10-9W/kg和2.9×10-3W/m2;再次是在3—5月,平均值分别为5.1×10-5m2/s、 4.9×10⁻⁹W/kg和2.7×10-3W/m2;在6—8月最小,平均值分别为4.9×10-5m2/s、 4.5×10⁻⁹W/kg和2.5×10-3W/m2。全球平均内波混合扩散率和耗散率的季节变化与风生近惯性能通量的季节变化一致。
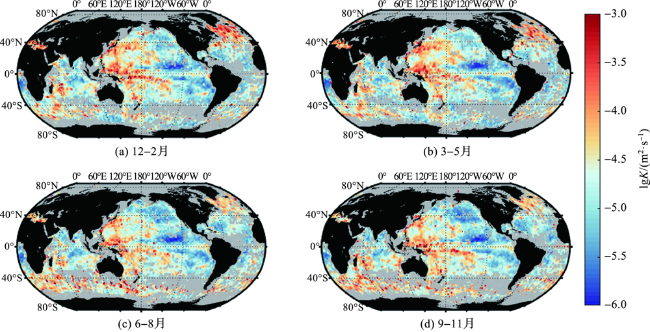
图6 全球250~500 m层平均内波混合扩散率的季节变化Fig.6 Seasonal variation of global average internal wave-induced mixing diffusivity at 250-500 m |
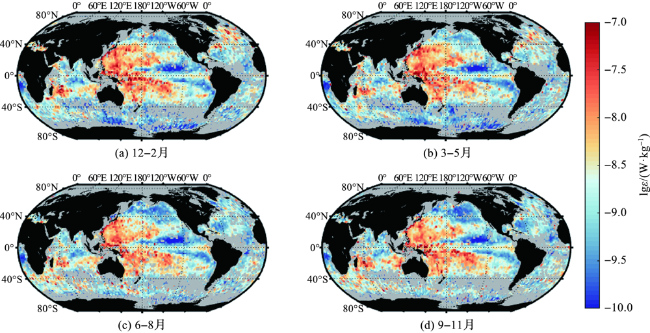
图7 全球250~500 m层平均内波混合耗散率的季节变化Fig.7 Seasonal variation of global average internal wave-induced mixing dissipation rate at 250-500 m |
北大西洋海域四季都保持着较高的内波混合扩散率,并且有明显的季节变化特征,其中12—2月内波混合扩散率最大,平均值为2.2×10⁻⁴m2/s;3—5月和9—11月次之,平均值分别为1.6×10-4m2/s和7.3×10-5m2/s;6—8月最小,平均值为6.4×10-5m2/s。北大西洋的风生近惯性能通量与内波混合扩散率季节变化一致,12—2月风生近惯性能通量最大,平均值为9.3×10-3W/m2;在6—8月最小,平均值为2.9×10-3W/m2。北大西洋的内波混合耗散率在12—2月最大,为6.2×10-9W/kg;在6—8月最小,为1.6×10-9W/kg。
南大洋的内波混合扩散率也一直很大,并且呈现明显的季节变化。6—8月平均内波混合扩散率和耗散率最大,平均值分别为1.0×10⁻⁴m2/s和2.9×10-9W/kg;其次是9—11月,平均内波混合扩散率和耗散率分别为8.4×10-5m2/s和2.7×10-9W/kg;再次为3—5月,平均内波混合扩散率和耗散率分别为4.9×10-5m2/s和1.7×10-9W/kg;12—2月最小,平均内波混合扩散率和耗散率分别为4.5×10-5m2/s和1.5×10-9W/kg。南大洋的风生近惯性能通量与内波混合的季节变化一致,也是6—8月最大,平均值为5.3×10-3W/m2;9—11月和3—5月次之,分别为5.1×10-3W/m2和4.8×10-3W/m2;12—2月最小,为4.7×10-3W/m2。
西太平洋在四个季节都存在着较强的内波混合,其中12—2月的平均内波混合扩散率和耗散率最大,分别为8.9×10⁻⁵m2/s和1.5×10-8W/kg;其次是9—11月,分别为8.7×10-5m2/s和1.3×10-8W/kg;接着是3—5月,分别为8.2×10-5m2/s和1.2×10-8W/kg;6—8月最小,分别为7.6×10-5m2/s和1.0×10-8W/kg。其内波混合与风生近惯性能通量的时空分布存在差异性,从图8可以看出,西太平洋的风生近惯性能通量并不大,并且9—11月的风生近惯性能通量最大,平均值为3.3×10-3W/m2。
40°N以北的北太平洋在四个季节的内波混合均比较弱,12—2月平均内波混合扩散率和耗散率最大分别为3.7×10⁻⁵m2/s和2.6×10-9W/kg;其次为3—5月,分别为2.7×10-5m2/s和1.7×10-9W/kg;9—11月分别为1.9×10-5m2/s和1.3×10-9W/kg;6—8月分别为1.3×10-5m2/s和8.0×10-10W/kg。而风生近惯性能通量在12—2月和9—11月比较大,平均值分别为6.1×10-3W/m2和5.8×10-3W/m2,与内波混合的季节分布并不一致。
图9统计了南、北半球不同季节的平均内波混合扩散率、耗散率和风生近惯性能通量。北半球的内波混合在冬季最大,平均内波混合扩散率和耗散率分别为7.7×10⁻⁵ m2/s和7.7×10-9 W/kg;夏季最小,平均内波混合扩散率和耗散率分别为3.8×10-5 m2/s和4.8×10-9 W/kg。北半球春季的内波混合比秋季强,两个季节的内波混合扩散率和耗散率分别为5.9×10-5 m2/s,7.0×10-9 W/kg和3.9×10-5 m2/s,5.3×10-9 W/kg。
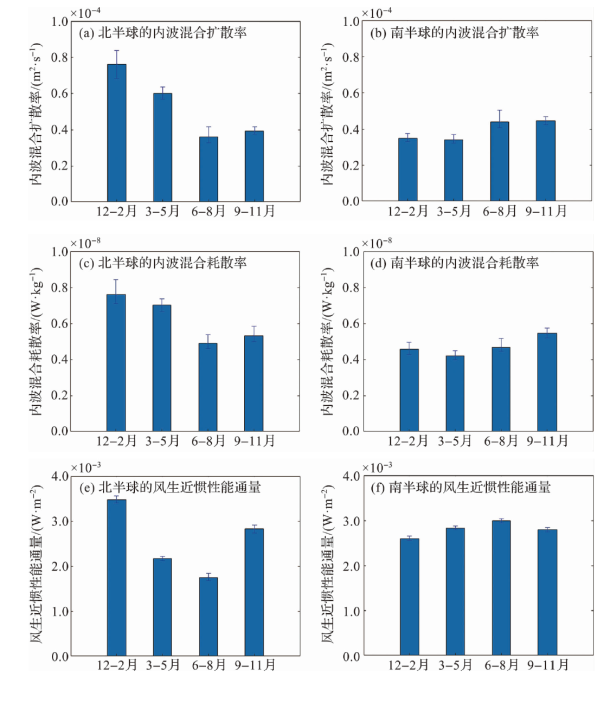
图9 南、北半球250~500 m层平均内波混合扩散率、耗散率以及表层风生近惯性能通量的季节变化(图中细线表示95%的置信区间。) Fig.9 Seasonal variation of average internal wave-induced mixing diffusivity, dissipation rate at 250-500 m, and wind-induced near-inertial energy flux at surface in the northern hemisphere and southern hemisphere (The thin line is a 95%confidence interval.) |
南半球的内波混合明显弱于北半球,季节变化与北半球也不一样。南半球春季的内波混合最强,平均内波混合扩散率和耗散率分别为4.5×10⁻⁵ m2/s和5.4×10-9 W/kg;其次是冬季和夏季,两个季节的平均内波混合扩散率分别为4.4×10-5 m2/s和3.5×10-5 m2/s,平均内波混合耗散率分别为4.6×10-9 W/kg和4.5×10-9 W/kg;秋季的内波混合最弱,平均内波混合扩散率和耗散率分别为3.4×10-5 m2/s和4.2×10-9 W/kg。
在北半球和南半球,都是冬季的风生近惯性能通量最大,北半球为3.5×10⁻³ W/m2,南半球为3.0×10-3 W/m2;其次是秋季,北半球为2.8×10-3 W/m2,南半球为2.8×10-3 W/m2;再次是春季,北半球为2.2×10-3 W/m2,南半球为2.7×10-3 W/m2;最小的是夏季,北半球为1.8×10-3 W/m2,南半球为2.6×10-3 W/m2。
3 结论
利用2006—2021年的Argo温、盐数据,基于细尺度参数化方程,研究了全球250~500 m、500~750 m、750~1 000 m深度段内波混合的空间分布特征和250~500 m深度段内波混合的季节分布特征,并分析了全球海域在不同季节下风生近惯性能通量和涡动能对250~500 m深度段内波混合的影响。主要得出以下两点结论。
1)在空间上,北大西洋,西太平洋和南大洋在四个季节都存在比较强的内波混合, 40°N以北的北太平洋内波混合相对较弱。在北大西洋和南大洋,存在较大的风生近惯性能通量,从而产生较强的内波混合。在这两个海域,内波混合的季节变化与风生近惯性能通量一致,都是冬季最大,秋季和春季次之,夏季最小。在西太平洋和40°N以北的北太平洋,内波混合与近惯性能通量的时空分布不一致,而与涡动能的空间分布相一致。西太平洋的涡动能大,产生了较强的内波混合;40°N以北的北太平洋涡动能小,内波混合也小。由此可见,内波混合不仅会受到风生近惯性能通量的影响,还会受到涡旋的调控作用。
2)在时间上,12—2月全球内波混合最强(K=5.7×10⁻⁵m2/s, ε=5.6×10⁻⁹W/kg),其次是9—11月(K=5.3×10-5m2/s, ε=5.2×10⁻⁹W/kg)和3—5月(K=5.1×10-5m2/s, ε=4.9×10⁻⁹W/kg),6—8月(K=4.9×10-5m2/s, ε=4.5×10⁻⁹W/kg)最小,与全球风生近惯性能通量的季节变化一致(12—2月:Π=3.1×10-3W/m2;9—11月:Π=2.9×10-3W/m2;3—5月:Π=2.7×10-3W/m2;6—8月:Π=2.5×10-3W/m2)。其中,在北半球,冬季的风生近惯性能通量和内波混合最大,而夏季的风生近惯性能通量和内波混合最小。在南半球,风生近惯性能通量和内波混合四个季节的变化不一致。但是,南、北半球内波混合和风生近惯性能通量的季节循环大致吻合,尤其在北大西洋,风生近惯性能通量和内波混合吻合较好。