
0 引言
1 材料与方法
1.1 采样方法
1.2 高分辨率元素分析
1.3 含水率与干容重
1.4 沉积物粒度与比表面积
1.5 总有机碳、总氮及稳定碳同位素
1.6 放射性核素活度测量
1.7 遥感与再分析数据来源
2 结果
2.1 H5-21的岩性与地球化学特征
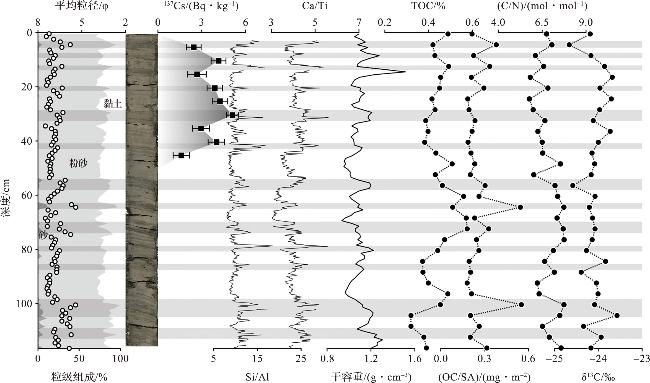
图2 H5-21的岩性、粒度、放射性核素(137Cs)、元素比值(Si/Al和Ca/Ti)、干容重和有机地球化学指标(TOC、OC/SA、C/N和δ13C)垂向剖面(部分图件改绘自文献[12],粒级组成、干容重和OC/SA为本研究新增数据。图中阴影标示风暴层。) Fig.2 Vertical profiles of lithology, grain size, radionuclide (137Cs), elemental ratios (Si/Al, Ca/Ti), dry bulk density and organic geochemical proxies (TOC, OC/SA, C/N, and δ13C) for H5-21 (Some of the figures are redrawn from reference [12], while the grain size composition, dry bulk density, and OC/SA data are newly-added data in this study. The shaded areas in the figures indicate storm layers.) |
2.2 H5-22的岩性与地球化学特征
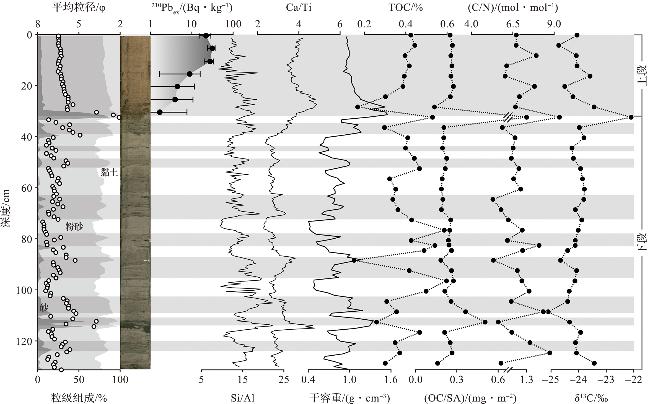
图3 H5-22的岩性、粒度、放射性核素(210Pbex)、元素比值(Si/Al和Ca/Ti)、干容重和有机地球化学指标(TOC、OC/SA、C/N和δ13C)垂向剖面(部分图件改绘自文献[12],粒级组成、干容重和OC/SA为本研究新增数据。图中阴影标示风暴层。) Fig.3 Vertical profiles of lithology, grain size, radionuclide (210Pbex), elemental ratios (Si/Al, Ca/Ti), dry bulk density and organic geochemical proxies (TOC, OC/SA, C/N, and δ13C) for H5-22 (Some of the figures are redrawn from reference [12], while the grain size composition, dry bulk density, and OC/SA data are newly-added data in this study. The shaded areas in the figures indicate storm layers.) |
2.3 研究区域风暴影响情况
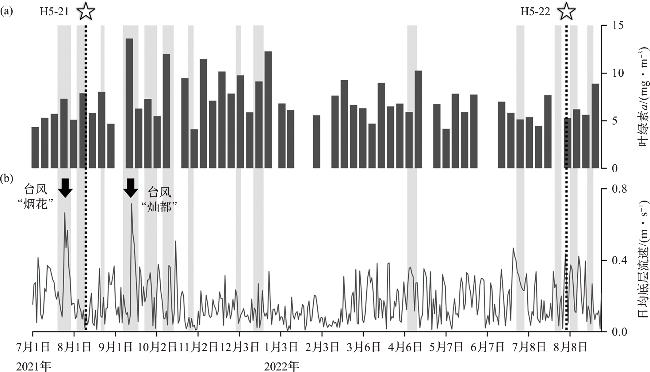
图4 两次采样期间研究区的环境条件:杭州湾周均叶绿素a质量浓度(a)和H5站位附近的日均底层流速(b)(图件改绘自文献[12]。图中阴影标示台风发生时间,星形标示取样时间。) Fig.4 Environmental conditions in the study area between the two sampling periods: Weekly averaged Chlorophyll-a mass concentration in the Hangzhou Bay (a), and Daily averaged bottom current velocity near site H5 (b) (Figure is redrawn from reference [12]. Shaded areas denote typhoon occurrences, and stars denote sampling times.) |
3 讨论
3.1 事件沉积层成因与指标适用性探讨
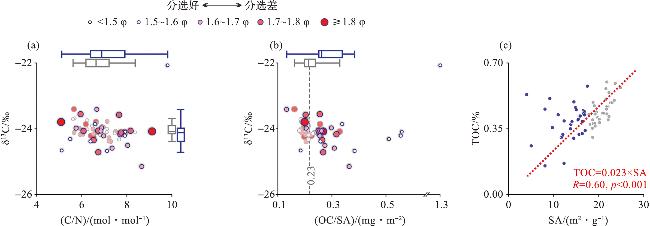
图5 H5-21和H5-22中风暴层(蓝色圆圈)和常态层(灰色圆圈)的有机地球化学指标散点图(图5a和5b中蓝色和灰色箱形图分别表征风暴层与常态层的数据分布情况。) Fig.5 Cross-plots of organic geochemical proxies for storm layers (blue circles) and normal layers (gray circles) in cores H5-21 and H5-22 (Blue and grey box plots in 5aand5b represent data distributions for storm layers and normal layers, respectively.) |
3.2 重复取心-核素示踪定量极端事件侵蚀-堆积过程
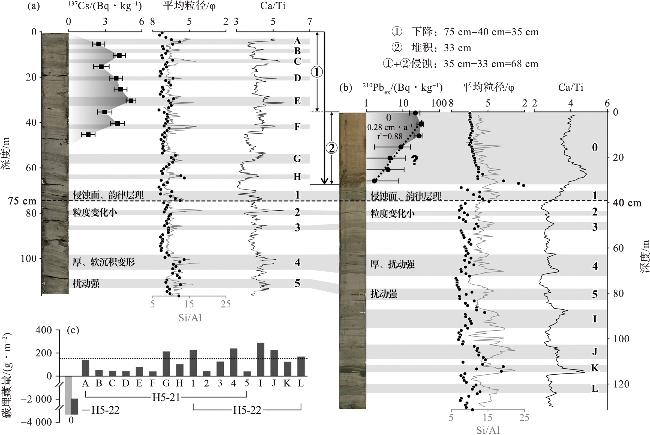
图6 基于H5-21 (a)和H5-22 (b)的统一地层格架定量侵蚀-堆积幅度以及各风暴层的碳埋藏量(c)(最新风暴层编号0,可跨孔追溯的历史风暴层编号1~5,其它历史风暴层编号A~L。图6c中深灰色柱表示各风暴层的碳埋藏量,风暴层0对应的浅灰色柱为因侵蚀造成的碳损失量。) Fig.6 Quantification of erosion-deposition magnitude based on the stratigraphic framework of cores H5-21 (a) and H5-22 (b),and carbon burial associated with individual storm layers (c) (The new storm layer is numbered as 0, and layers numbered 1 to 5 are correlative historic storm deposits that can be traced across both cores,and other historical storm layers are labeled A to L. In fig.6c, dark gray bars represent carbon burial in each storm layer, while the light gray bar for storm layer 0 indicates carbon loss due to erosion.) |
3.3 风暴对有机碳埋藏的真实效应:高效保存与净亏损
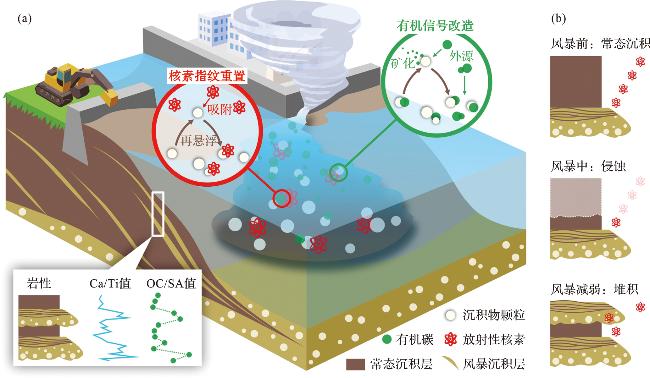
图7 重复取心结合放射性核素示踪风暴事件对河口沉积过程影响及有机碳埋藏效应示意图:单次取心的沉积记录(a)以及重复取心揭示的风暴层保留偏差(b)Fig.7 Repetitive coring combined with radionuclides revealing storm-induced deposition process and its impact on carbon burial:Sedimentary record from a single core (a), and Preservation bias of storm layers revealed by repetitive coring (b) |