
0 引言
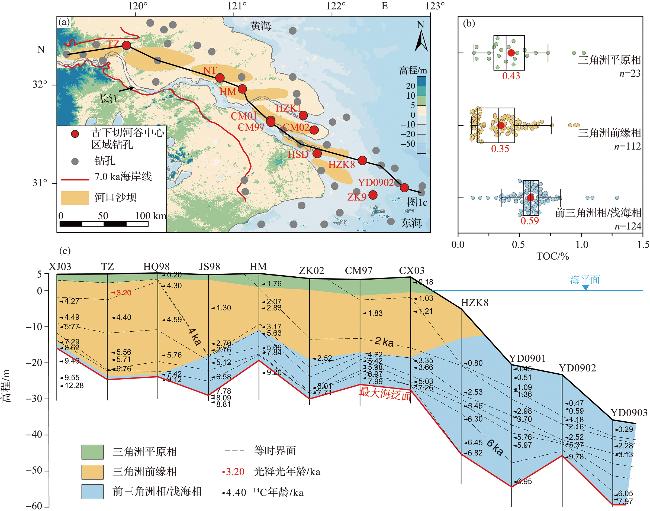
图1 长江三角洲区域概况及钻孔分布图(a)、长江三角洲沉积亚相总有机碳含量分布箱式图(b)以及长江三角洲沉积层序剖面图(c)(图1b中的彩色散点为实测数据,箱形图与红点分别展示了统计分布及均值。) Fig.1 Overview of the Changjiang Delta region and boreholes distribution map (a), box plot of total OC content distribution in subfacies of the Changjiang Delta (b), and sedimentary sequence profile of the Changjiang Delta (c) (In Fig.1b, colored scatter points represent measured data; boxplots and red dots show the statistical distribution and mean values, respectively.) |
1 研究区域概况
2 研究材料与方法
表1 长江三角洲古下切河谷有机地球化学分析钻孔信息Tab.1 Core information for organic geochemical analysis within the paleo-incised valley of the Changjiang Delta |
| 钻孔 | 经度/(°E) | 纬度/(°N) | 长度/m | 高程/m | 数据来源 |
|---|---|---|---|---|---|
| CM01 | 121°22.98' | 31°38.48' | 61.80 | 3.55 | 文献[21] |
| CM02 | 121°48.94' | 31°32.51' | 58.20 | 3.02 | |
| HSD | 121°50.83' | 31°18.15' | 58.40 | 1.70 | |
| CM97 | 121°23.00' | 31°37.00' | 70.50 | 2.48 | 文献[13] |
| HM | 121°05.57' | 31°57.42' | 69.80 | 3.36 | 文献[12] |
| HZK1 | 121°42.80' | 31°41.44' | 60.50 | -5.00 | |
| HZK8 | 122°18.86' | 31°14.04' | 60.90 | -5.30 | |
| NT | 120°51.40' | 32°03.94' | 60.90 | 3.99 | |
| TZ | 119°54.85' | 32°23.83' | 61.90 | 4.72 | |
| ZK9 | 122°25.07' | 30°52.98' | 50.00 | -12.50 | 文献[22] |
| YD0902 | 122°44.35' | 30°56.99' | 69.10 | -23.00 | 本研究 |
2.1 年龄-深度模型的建立
2.2 利用双端元模型估算陆源有机碳贡献
2.3 计算全新世沉积物与有机碳的埋藏速率
3 结果
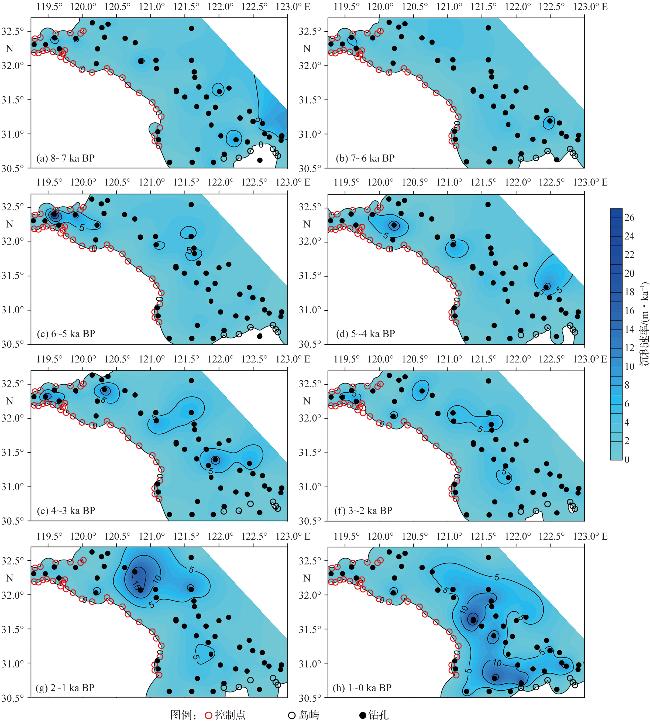
3.1 全新世沉积层厚度空间分布与演化
3.2 长江三角洲全新世沉积物有机地球化学特征
3.2.1 有机质含量(TOC和TN)变化
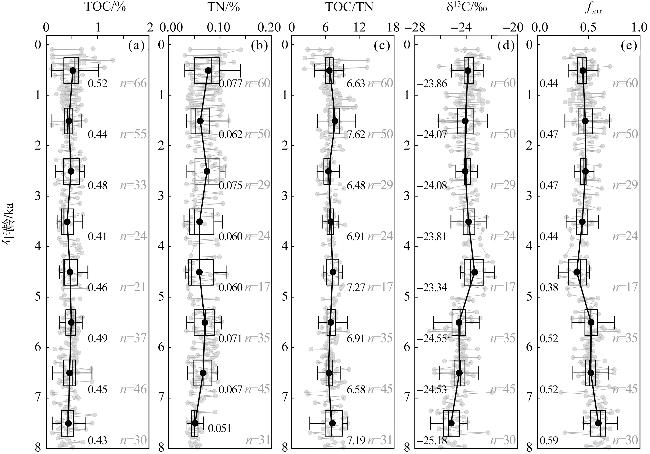
图3 全新世长江三角洲沉积物中TOC含量(a)、TN含量(b)、TOC/TN(c)、δ13C(d)和fterr(e)的变化特征(灰色散点为实测数据,箱形图与黑点分别展示了千年尺度的统计分布及均值。) Fig.3 Variation characteristics of TOC content (a), TN content (b), TOC/TN (c), δ13C (d), and fterr (e) in the Holocene sediments of the Changjiang Delta (Gray scatter points represent measured data; boxplots and black dots show the millennial-scale statistical distribution and mean values, respectively.) |
3.2.2 有机质物源指标(TOC/TN、δ13C和fterr)变化
3.3 沉积物堆积速率变化特征
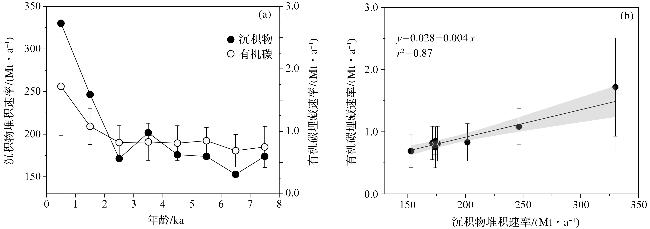
图4 长江三角洲8 ka BP以来沉积物堆积速率与有机碳埋藏速率的演化特征(a)及其相关性分析(b)Fig.4 Evolution characteristics of sediment burial rate and OC burial rate since 8 ka BP in the Changjiang Delta (a) and their correlation analysis (b) |
表2 长江三角洲全新世沉积物和有机碳埋藏速率Tab.2 Holocene sediment and OC burial rates in the Changjiang Delta |
| 年龄/ka BP | 体积/km3 | QS/(Mt·a-1) | QOC/(Mt·a-1) | TOC/% | fterr |
|---|---|---|---|---|---|
| 0~1 | 211.65 | 330.17 | 1.72±0.79 | 0.52±0.24 | 0.44±0.08 |
| 1~2 | 157.99 | 246.46 | 1.08±0.29 | 0.44±0.12 | 0.47±0.11 |
| 2~3 | 109.81 | 171.30 | 0.82±0.27 | 0.48±0.16 | 0.47±0.08 |
| 3~4 | 129.32 | 201.74 | 0.83±0.30 | 0.41±0.15 | 0.44±0.08 |
| 4~5 | 112.76 | 175.90 | 0.81±0.28 | 0.46±0.16 | 0.38±0.10 |
| 5~6 | 111.44 | 173.85 | 0.85±0.21 | 0.49±0.12 | 0.52±0.10 |
| 6~7 | 97.92 | 152.76 | 0.69±0.26 | 0.45±0.17 | 0.52±0.10 |
| 7~8 | 111.53 | 173.99 | 0.75±0.33 | 0.43±0.19 | 0.59±0.11 |
3.4 有机碳埋藏速率变化特征
4 讨论
4.1 沉积物快速淤积驱动的有机碳埋藏双效机制
4.2 有机碳物源变化的控制机制
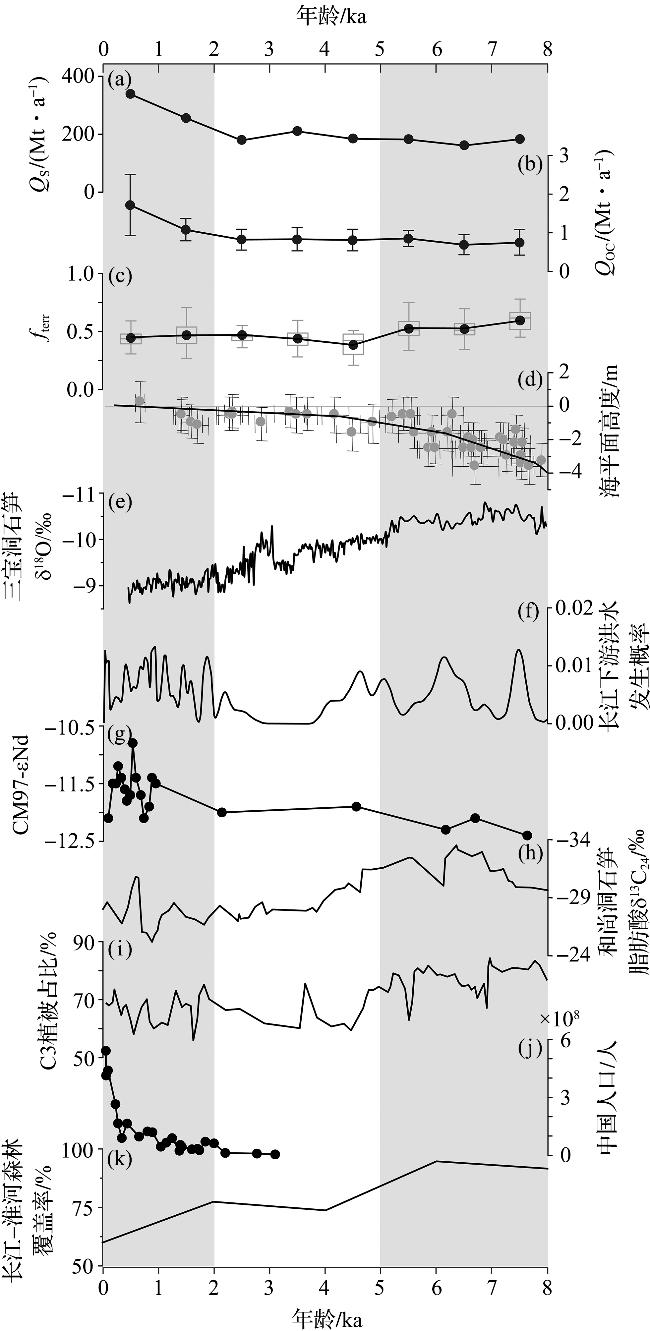
图5 长江三角洲全新世有机碳来源变化及其控制因素(a:长江三角洲的沉积物堆积速率;b:有机碳埋藏速率;c:陆源有机碳贡献比例;d:长江三角洲地区全新世相对海平面变化曲线[40];e:三宝洞石笋δ18O值[41];f:长江下游流域洪水发生概率[42];g:长江三角洲CM97孔钕同位素异常值[43];h:长江上游和尚洞长链脂肪酸碳同位素值[44];i:长江下游南漪湖长链正构烷烃指示的C3植物对沉积有机碳的贡献[45];j:中国人口变化[46];k:长江-淮河流域全新世森林覆盖变化[47]。图中两个灰色阴影区域分别表示人类活动增强的2~0 ka BP 时期和中全新世大暖期。) Fig.5 Holocene variations in OC sources and their control factors in the Changjiang Delta (a:Sediment burial rate, b: OC burial rate, c: Terrestrial OC fraction in the Changjiang Delta; d: Relative sea-level curve of the Changjiang Delta region in the Holocene[40]; e: Stalagmite δ18O from Sanbao Cave[41]; f: Flood probability in the lower Changjiang basin[42]; g: εNd values in core CM97 from the Changjiang Delta[43]; h: Long-chain fatty acid δ13C from Heshang Cave in the upper Changjiang basin[44]; i: Sedimentary OC contribution from C3 plants indexed by long-chain n-alkanes at Lake Nanyi in the lower Changjiang basin[45]; j: Population in China[46]; k: Changes in forest cover during the Holocene for the Changjiang-Huaihe region[47]. The two gray shade zones highlight the two special stages: 2-0 ka BP with enhanced human activities and the mid-Holocene Thermal Maximum.) |