
0 引言
1 海洋沉积黑碳的分析方法
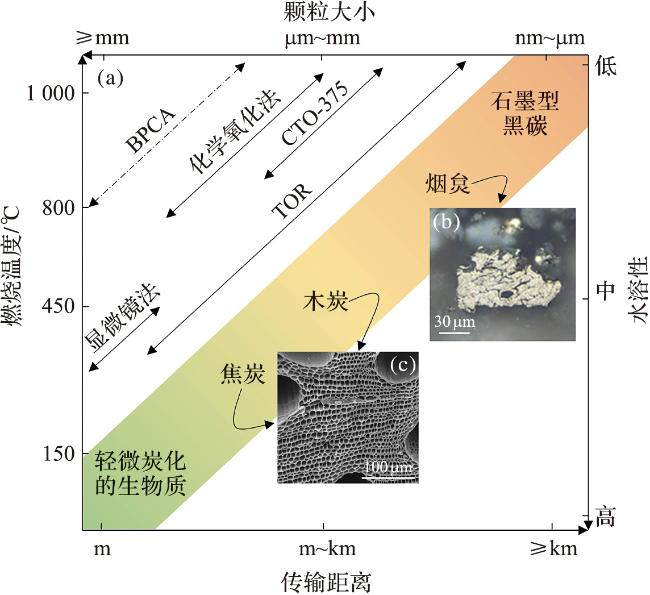
图1 黑碳类型及分析方法(a)、显微镜下的烟炱颗粒(b)以及扫描电镜(SEM)下的焦炭或木炭颗粒(c)(图1a修改自文献[5,37],其中实线为各种黑碳分析方法的适用范围,虚线代表可能但暂未确定的适用范围;图1b来自文献[23]; 图1c来自文献[38]。) Fig.1 Black carbon types and analytical methods (a), soot particles under microscope (b), and char/charcoal particles under scanning electron microscopy (SEM) (c) (Fig.1a was modified from references [5,37], where solid lines denote the applicable ranges of various black carbon analysis methods, and dashed line represents potential but not yet confirmed applicable range. Fig.1b was sourced from reference [23]. Fig.1c was sourced from reference [38].) |
1.1 CTO-375法
1.2 TOR法
1.3 BPCA法
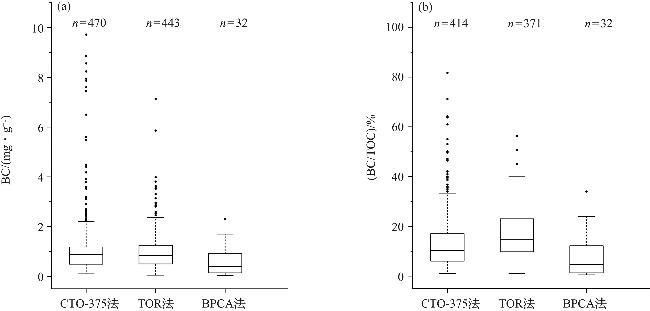
图2 不同分析方法测定的海洋沉积物黑碳含量(a)和海洋沉积黑碳在有机碳中的占比(b)(图片修改自文献[52],图中数据来自文献[3,4,17,20,23,26,31-32,53-78]。箱体表示中间50%的数据,箱内横线为中值, 上下须线表示数据的正常范围,须线外的点则为异常值。) Fig.2 Black carbon content in marine sediments determined by different analytical methods (a), and proportion of black carbon in organic carbon in marine sediments (b) [Figure was modified from reference [52]. The data were from references [3,4,17,20,23,26,31-32,53-78]. The box shows the interquartile range (middle 50%), with an internal line at the median and whiskers indicating the normal data range, points outside are outliers.] |
1.4 方法选择与结果对比
2 海洋沉积黑碳的分布特征
2.1 海洋沉积黑碳的空间分布
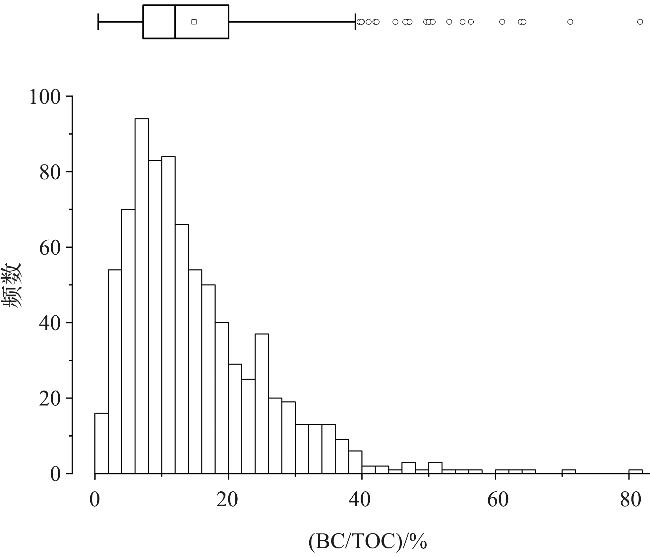
图3 海洋沉积有机碳中黑碳比例的频率分布图(图片修改自文献[52],图中数据来自文献[3,4,17,20,23,26,31-32,53-78]。箱体表示中间50%的数据,箱内竖线为中值,箱内小方块为均值,左右须线表示数据的正常范围,须线外的点则为异常值。) Fig.3 Frequency distribution plot of black carbon proportion in marine sedimentary organic carbon [Figure was modified from reference [52]. The data were from references [3,4,17,20,23,26,31-32,53-78]. The box signifies the interquartile range (middle 50%), with an internal line designating the median and a small square marker indicating the mean. The whiskers extend to the normal range of the data, and points outside them are classified as outliers.] |
2.1.1 近海(水深<200 m)沉积物中黑碳的分布
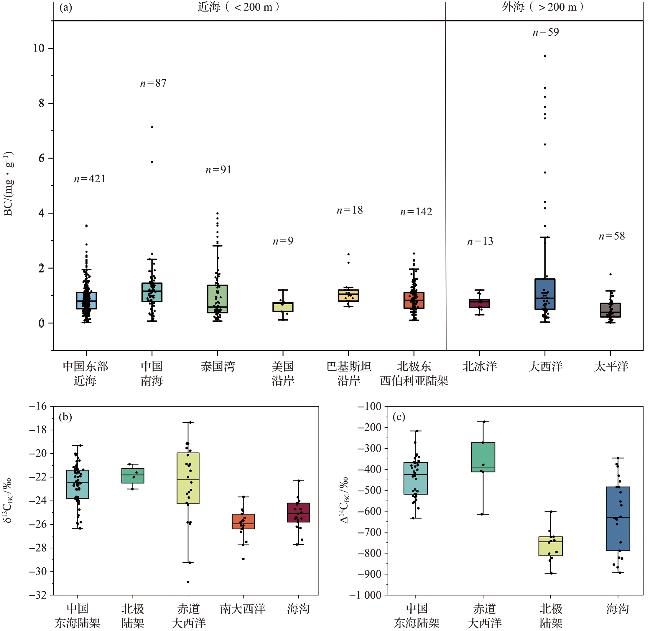
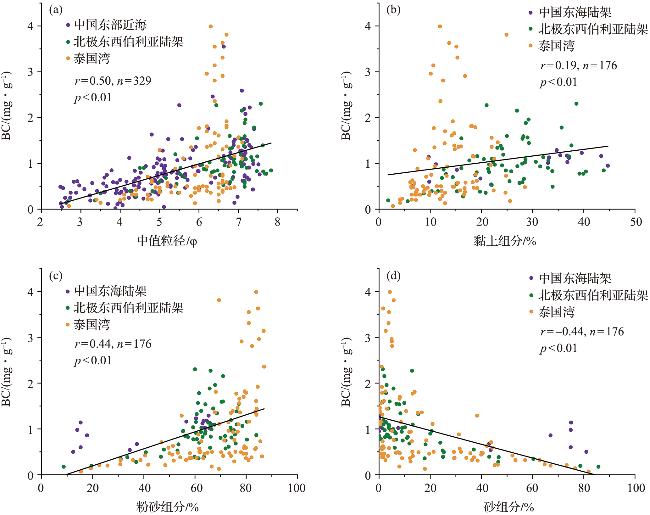
图4 全球不同海域海洋沉积物中黑碳的含量(a)、稳定碳同位素(δ13C)组成(b)、放射性碳同位素(Δ14C)组成(c)的分布格局(图中数据来自文献[3,4,17,20,23,26,31-32,53-78]。箱体表示中间50%的数据,箱内横线为中值,上下须线表示数据的正常范围,须线外的点则为异常值。) Fig.4 Distribution of black carbon content (a), stable carbon isotope (δ13C) composition (b), and radiocarbon (Δ14C) composition (c) in global marine sediments [The data were from references [3,4,17,20,23,26,31-32,53-78]. The box shows the interquartile range (middle 50%),with an internal line at the median and whiskers indicating the normal data range, points outside are outliers.] |
2.1.2 外海(水深>200 m)沉积物中黑碳的分布
2.1.3 海洋沉积黑碳的碳同位素组成和年龄特征
2.2 不同时间尺度沉积黑碳的分布与环境响应记录
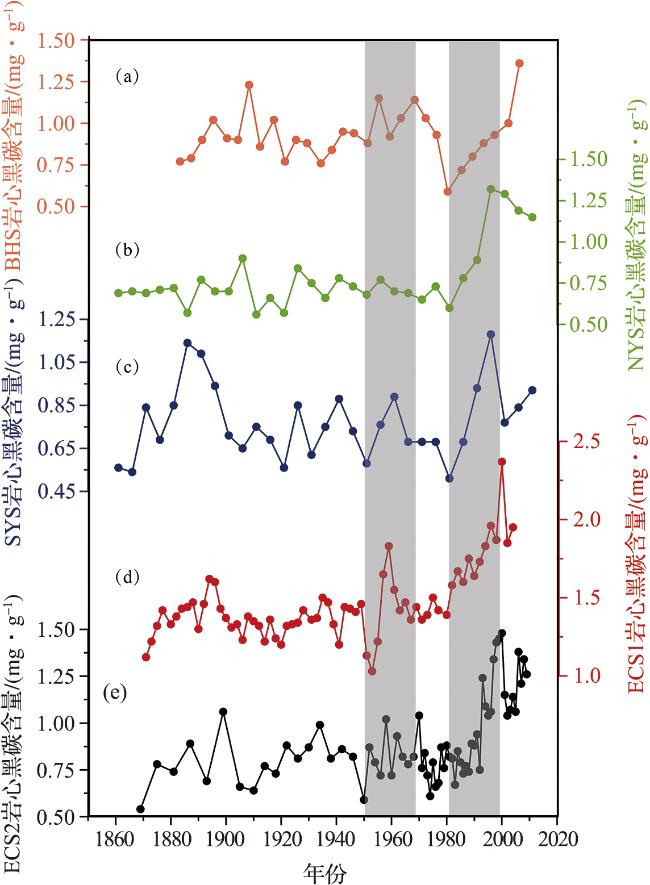
图6 中国东部边缘海百年尺度岩芯的黑碳记录:渤海泥质区BHS岩心黑碳含量(a);黄海北部NYS岩心黑碳含量(b);黄海南部SYS岩心黑碳含量(c);东海泥质区ECS1岩心黑碳含量(d);东海泥质区ECS2岩心黑碳含量(e)(图中数据来自文献[3]。) Fig.6 Centennial-scale black carbon records in sediment cores from China’s eastern marginal seas: Core BHS in Bohai Sea Mud Zone (a); Core NYS in Northern Yellow Sea (b); Core SYS in Southern Yellow Sea (c); Core ECS1 in East China Sea Mud Zone (d); Core ECS2 in East China Sea Mud Zone (e) (The data were from reference [3].) |
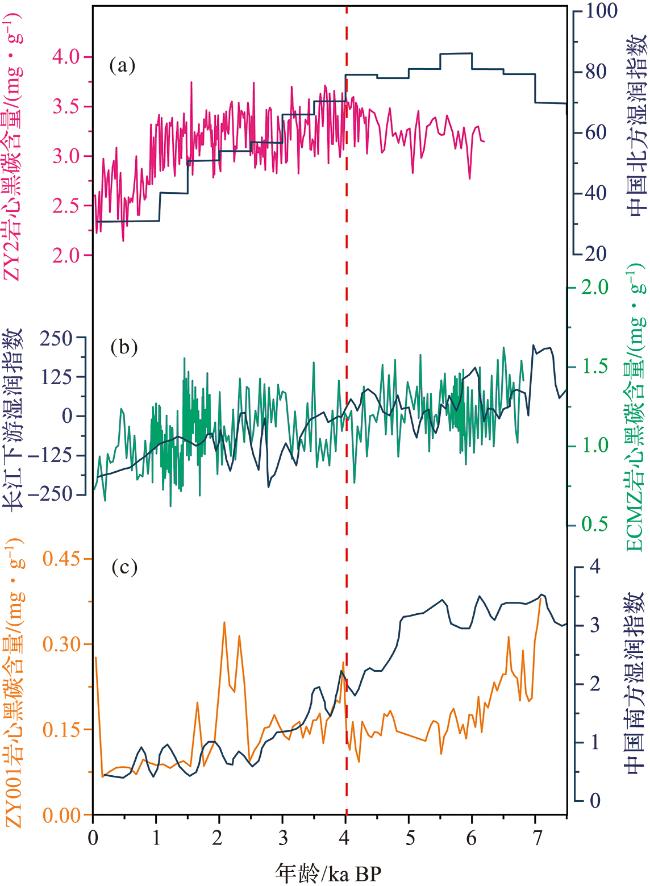
图7 中国东部边缘海全新世千年尺度岩心的黑碳记录:黄海泥质区ZY2岩心黑碳含量(粉色)和中国北方湿润指数(蓝色)(a);东海内陆架ECMZ岩心黑碳含量(绿色)和中国长江下游湿润指数(蓝色)(b);南海西北陆架ZK001岩心黑碳含量(橙色)和中国南方湿润指数(蓝色)(c)(ZY2岩芯数据来自文献[95];中国北方湿润指数来自文献[96];ECMZ岩心数据来自文献[85];中国长江下游湿润指数来自文献[97];ZK001岩心数据来自文献[98];中国南方湿润指数来自文献[99]。) Fig.7 Holocene millennial-scale black carbon records in sediment cores from China’s eastern marginal seas: Core ZY2 in Yellow Sea Mud Zone (in pink) and moistness index of Northern China (in blue) (a); Core ECMZ in inner shelf of the East China Sea (in green) and moistness index of the Lower Changjiang (Yangtze River) region (in blue) (b); Core ZK001 in northwestern South China Sea shelf (in orange) and moistness index of Southern China (in blue) (c) (ZY2 core data were from reference [95]; Northern China moistness index was from reference [96]; ECMZ core data were from reference [85]; Lower Changjiang (Yangtze River) region moistness index was from reference [97]; ZK001 core data were from reference [98]; Southern China moistness index was from reference [99].) |
3 海洋沉积黑碳的来源
3.1 河流输送
3.2 大气沉降
3.3 海岸侵蚀
3.4 其他来源
4 海洋沉积黑碳的埋藏与归宿
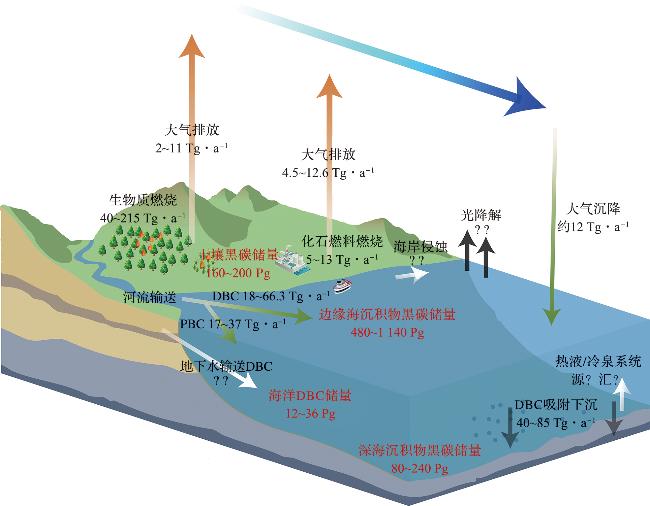
图8 海洋沉积黑碳的源-汇过程及其通量[图片修改自文献[5]。图中数据来自文献[5,7,10,79-80,114]。图中黑碳通量的单位为Tg·a-1(黑色),黑碳储量的单位为Pg(红色)。] Fig.8 Sources, sinks and fluxes of black carbon in marine sediments [Figure was modified from reference [5]. The data were from reference [5,7,10,79-80,114]. Black carbon flux units are Tg·a-1 (in black), black carbon storage units are Pg (in red).] |