研究论文

西北太平洋中尺度涡旋分类统计与海表温度特征分析

  • 姚翔妤 , 1, 2 ,
  • 时云龙 , 1, 2, 3, 4, * ,
  • 陈实 3, 4
展开
  • 1 南京信息工程大学 气候系统预测与变化应对全国重点实验室, 江苏 南京 210044
  • 2 南京信息工程大学 海洋科学学院, 江苏 南京 210044
  • 3 南京国电南自电网自动化有限公司, 江苏 南京 211106
  • 4 国电南京自动化股份有限公司, 江苏 南京 210032
*时云龙(1985—),男,讲师,主要从事海洋动力学研究,E-mail:。

姚翔妤(2004—),女,江苏省无锡市人,主要从事海洋涡旋研究,E-mail:。

收稿日期: 2025-02-10

  修回日期: 2025-05-20

  网络出版日期: 2026-06-25

基金资助

南京信息工程大学大学生创新创业训练计划项目(XJDC202410300098)

Statistical classification and sea surface temperature characteristics of mesoscale eddies in the Northwestern Pacific

  • YAO Xiangyu , 1, 2 ,
  • SHI Yunlong , 1, 2, 3, 4, * ,
  • CHEN Shi 3, 4
Expand
  • 1 State Key Laboratory of Climate System Prediction and Risk Management, Nanjing University of Information Science and Technology, Nanjing 210044, China
  • 2 School of Marine Sciences, Nanjing University of Information Science and Technology, Nanjing 210044, China
  • 3 Nanjing SAC Power Grid Automation Co., Ltd., Nanjing 211106, China
  • 4 Guodian Nanjing Automation Co., Ltd., Nanjing 210032, China

Received date: 2025-02-10

  Revised date: 2025-05-20

  Online published: 2026-06-25

摘要

本文基于卫星高度计涡旋数据集,对西北太平洋中尺度涡进行分类统计和特征分析,并通过合成分析法重构各类涡旋对应的海表温度异常(sea surface temperature anomaly, SSTA)和海面高度异常(sea level anomaly, SLA)的空间结构,对海域中尺度涡分布特征展开分析。将研究海域分成北赤道流(North Equatorial Current, NEC)、副热带逆流(Subtropical Countercurrent, STCC)和黑潮延伸体(Kuroshio Extension, KE)三个海域,以11—12月和1—4月为冷季, 5—10月为暖季,按照涡旋极性进行分类、统计和分析。结果显示,研究海域涡旋通常为气旋冷涡与反气旋暖涡,但也存在气旋暖涡和反气旋冷涡两种反常涡旋,反常涡旋的数量占涡旋总数的比例约为22.5%。反常涡旋发生概率为低纬度高于高纬度、暖季高于冷季。常规涡旋的SSTA与其振幅呈正相关,随纬度升高幅值增大,且冷季均值高于暖季;反常涡旋的SSTA整体弱于常规涡旋,且未表现出明显的区域与季节差异。合成分析显示,与常规涡旋相比,反常涡旋形态更偏离圆形,振幅和SSTA变幅较小。

本文引用格式

姚翔妤 , 时云龙 , 陈实 . 西北太平洋中尺度涡旋分类统计与海表温度特征分析[J]. 海洋学研究, 2026 , 44(2) : 35 -42 . DOI: 10.3969/j.issn.1001-909X.2026.02.004

Abstract

Based on a satellite altimetry-derived eddy dataset, this study conducted a classification-based statistical and characteristic analysis of mesoscale eddies in the Northwestern Pacific. A composite analysis method was further employed to reconstruct the spatial structures of sea surface temperature anomalies (SSTAs) and sea level anomalies (SLAs) associated with different eddy categories and to investigate the distribution characteristics of mesoscale eddies in the study area. The study region was divided into three subregions: the North Equatorial Current (NEC), the Subtropical Countercurrent (STCC), and the Kuroshio Extension (KE). November to December and January to April were defined as the cold season, while May to October were defined as the warm season. Eddies were classified, counted, and analyzed according to their polarity. The results show that mesoscale eddies in the study region are generally characterized by cold-core cyclonic eddies and warm-core anticyclonic eddies. However, two types of abnormal eddies, namely warm-core cyclonic eddies and cold-core anticyclonic eddies, are also identified, accounting for approximately 22.5%of the total eddy population. The occurrence probability of abnormal eddies is higher at low latitudes than at high latitudes, and higher in the warm season than in the cold season. For normal eddies, SSTA is positively correlated with eddy amplitude, increases with latitude, and is generally stronger in the cold season than in the warm season. In contrast, abnormal eddies exhibit overall weaker SSTAs than normal eddies and show no obvious regional or seasonal differences. Composite analysis further reveals that compared with normal eddies, abnormal eddies are less circular in shape and have smaller amplitudes and weaker SSTA variations.

0 引言

在海洋大尺度环流中存在多种中尺度现象,包括中尺度涡旋、锋面、跃层等。海洋中尺度涡旋(以下简称“涡旋”)的时间尺度在几十天到数百天,空间尺度在几千米到几百千米之间,垂直影响深度可达几千米[1],在物质能量输运和生物化学过程中起着重要的作用[2-3]。
近年来,卫星高度计海面高度观测数据已成为海洋涡旋研究的基础数据源。基于该数据的研究表明,海洋涡旋在空间分布、尺度特征及生命周期等关键特征上,呈现出显著的区域性和季节性差异。例如在西北太平洋(115°E—140°E, 5°N—30°N),多数涡旋的半径集中在80~180 km之间,生命周期短于10周,反气旋涡的数量明显多于气旋涡[1]。在黑潮延伸体邻近海区(135°E—175°W, 25°N—45°N),涡旋半径从南至北呈现“小—大—小”的纬向分布,数量上有明显的季节变化,春夏季较多[4]。通常,在涡旋强度较大的区域,其海表面温度异常(sea surface temperature anomaly, SSTA)表现为单极子,与海面高度异常(sea level anomaly, SLA)相似;而在涡旋强度较弱的区域,SSTA表现为偶极子[5-6] ,与SLA的空间模式不一致。在北半球,通常气旋涡对应负的SSTA(冷涡),反气旋涡对应正的SSTA(暖涡),但在中国南海[7]、太平洋中纬度[8]以及墨西哥湾海域[9],部分涡旋表现出与常规涡旋相反的SSTA结构,即SSTA为正的气旋涡与SSTA为负的反气旋涡,其强度弱于常规涡旋。
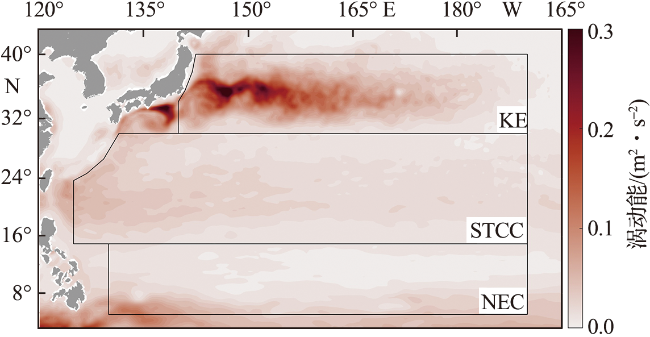
西北太平洋在全球和局地气候中扮演着十分重要的角色,是赤道太平洋和亚热带太平洋热、盐和能量交换的重要区域[10],涡旋活动十分活跃(图1)。本文基于卫星高度计涡旋数据集,对西北太平洋涡旋进行区域、季节、极性等的分类统计,并结合SSTA、SLA数据合成各类型涡旋典型结构,以开展不同类型涡旋的空间特征分析。
图1 西北太平洋海表涡动能空间分布及研究海域划分

(NEC表示北赤道流区, STCC表示副热带逆流区,KE表示黑潮延伸体区。)

Fig.1 Spatial distribution of sea surface eddy kinetic energy and division of study regions in the Northwestern Pacific

(NEC refers to the North Equatorial Current region, STCC refers to the Subtropical Countercurrent region, and KE refers to the Kuroshio Extension region.)

1 数据及方法

1.1 数据

本研究中的涡旋数据来自CHELTON等[11]开发的2.0版全球海洋涡旋数据集(https://aviso.altimetry.fr)。该数据集基于卫星高度计SLA数据,采用连通像元准则完成涡旋识别与追踪,时间分辨率为1 d,涵盖涡旋时间、经纬度、振幅、半径、极性及轨迹等参数。该数据集已被广泛用于全球海洋涡旋相关研究[12-13]。海表温度(sea surface temperature, SST)数据来自OSTIA(Operational Sea Surface Temperature and Sea Ice Analysis)全球业务化海表温度和海冰再分析数据集,数据来源于CMEMS(The Copernicus Marine Environment Monitoring Service),产品编号为 SST_GLO_SST_L4_REP_OBSERVATIONS_ 010_011。该数据集为L4级产品,无时空缺测数据,空间分辨率为0.05°×0.05°,时间分辨率为1 d。SLA数据源自AVISO(Archiving, Validation and Interpretation of Satellite Oceanographic Data),现由CMEMS发布(www.copernicus.eu/en/services/marine)。所用的L4级网格化数据集融合多源卫星高度计资料,空间分辨率为0.25°×0.25°,时间分辨率为1 d。本文中各数据的时间范围均为2010年1月1日—2019年10月15日。

1.2 计算方法

1.2.1 涡旋SSTA计算

对于半径为r的涡旋,选取以涡心为圆心,1倍半径区为涡旋的核心区,1倍半径与2倍半径之间为涡旋的环境区。涡旋SSTA为核心区SST平均值减去环境区SST平均值:
te=tc-tb
式中:tc为核心区SST平均值,tb为环境区SST平均值,te为涡旋SSTA。te为正值,涡旋为暖涡;te为负值,涡旋为冷涡。

1.2.2 涡旋SSTA/SLA合成方法

本文将研究海域划分为3个区域,分别为北赤道流区(North Equatorial Current,NEC)、副热带逆流区(Subtropical Countercurrent,STCC)和黑潮延伸体区(Kuroshio Extension,KE)(图1)。按照研究海域(NEC、STCC、KE)、季节(冷季:11—12月和1—4月;暖季:5—10月)、涡旋类型(气旋涡、反气旋涡)以及te值的正负进行分类、统计,按类别对所有涡旋做空间对齐归一化处理后进行复合平均,得到不同类别涡旋的复合SSTA/SLA空间结构场。

2 结果及分析

2.1 涡旋分类及数量

2010年1月1日—2019年10月15日,在研究海域共识别出278 985个气旋涡,262 492个反气旋涡,统计结果见表1。已有研究认为,通常情况下,气旋涡具有冷核心,即气旋冷涡(cold-core cyclonic eddy,CCE),反气旋涡具有暖核心,即反气旋暖涡(warm-core anticyclonic eddy,WAE)[14],但也存在反常涡旋,即气旋暖涡(warm-core cyclonic eddy,WCE)或反气旋冷涡(cold-core anticyclonic eddy,CAE)。本研究中,在NEC、STCC、KE三个区域,不论是暖季还是冷季,常规涡旋的数量均大于反常涡旋。
表1 西北太平洋不同区域、季节和类型涡旋数量统计

Tab.1 Statistics of mesoscale eddy counts for different regions,seasons, and types in the Northwestern Pacific

季节 涡旋类型 区域
NEC STCC KE
暖季 WCE* 6 307 23 761 9 791
CCE 9 571 54 110 39 238
WAE 7 033 53 313 37 535
CAE* 6 548 20 717 7 575
冷季 WCE* 5 563 13 941 4 380
CCE 9 825 61 674 40 824
WAE 7 960 60 457 38 029
CAE* 5 383 13 754 4 188

注:*表示反常涡旋,WCE表示气旋暖涡,CCE表示气旋冷涡,WAE表示反气旋暖涡,CAE表示反气旋冷涡。NEC表示北赤道流区, STCC表示副热带逆流区, KE表示黑潮延伸体区。

本研究中反常涡旋共有121 908个,约占涡旋总数的22.5%,相较全球平均海洋反常涡旋占比的平均值(约1/3[15])偏低。暖季, NEC、STCC、KE海域气旋涡中反常涡旋的占比分别为40%、31%、20%,反气旋涡中反常涡旋的占比分别为48%、28%、17%;冷季,气旋涡中反常涡旋的占比分别为36%、18%、10%,反气旋涡中反常涡旋的占比分别为40%、19%、10%。总体而言,从空间分布看,低纬度海域反常涡旋的发生概率高于高纬度海域;从时间上看,暖季反常涡旋的发生概率明显高于冷季。

2.2 不同类型涡旋的SSTA与振幅

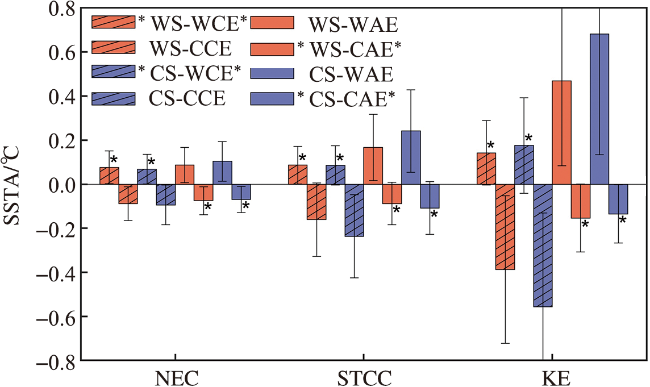
NEC海域涡旋的SSTA在0.1 ℃左右,常规涡旋与反常涡旋间的差异较小;STCC海域涡旋的SSTA整体较NEC海域增大,特别是冷季常规涡旋,SSTA达到了0.25 ℃;在KE海域,各类涡旋的SSTA进一步增大,冷季常规涡旋的SSTA可达0.68 ℃。总体而言,在西北太平洋,涡旋的SSTA由南向北逐渐递增,反常涡旋变化幅度小于常规涡旋(图2)。
图2 西北太平洋涡旋的海表温度异常平均值与标准差统计分布

(WS代表暖季,CS代表冷季,“*”表示反常涡旋。)

Fig.2 Statistical distribution of mean SSTAs and standard deviations for eddies in the Northwestern Pacific

(WS represents the warm season, CS represents the cold season,and “*” indicates abnormal eddies.)

涡旋的SSTA存在季节差异。冷季常规涡旋的SSTA均高于暖季,在KE海域差异尤为明显,差值大于0.2 ℃;反常涡旋的SSTA季节差异不大,且与常规涡旋不同,存在暖季高于冷季的情况。
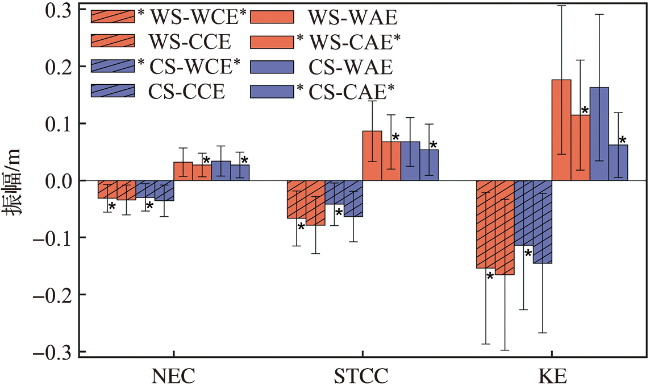
在西北太平洋,涡旋振幅由南向北整体递增,在NEC海域平均值约为0.05 m,STCC海域为0.08 m,KE海域在0.10 m以上;常规涡旋振幅均大于对应的反常涡旋。NEC海域,涡旋振幅的季节差异不明显,STCC、KE海域涡旋振幅的季节差异明显,暖季均大于冷季(图3)。
图3 西北太平洋涡旋的平均振幅与标准差统计分布

(WS代表暖季,CS代表冷季,“*”表示反常涡旋。)

Fig.3 Statistical distribution of mean amplitudes and standard deviations for eddies in the Northwestern Pacific

(WS represents the warm season, CS represents the cold season,and “*” indicates abnormal eddies.)

本研究中涡旋振幅与SSTA绝对值并非单纯正相关,这与对南海涡旋的研究结论[7]一致。纬向上,涡旋振幅与SSTA强度同步递增;季节上,常规涡旋振幅与SSTA强度的变化不同步。暖季海水层结增强,抑制了涡旋垂向运动,致使SSTA较冷季时偏小。反常涡旋的振幅和SSTA均小于常规涡旋,其中,SSTA的区域和季节间差异更不显著。

2.3 涡旋SSTA与SLA合成分析

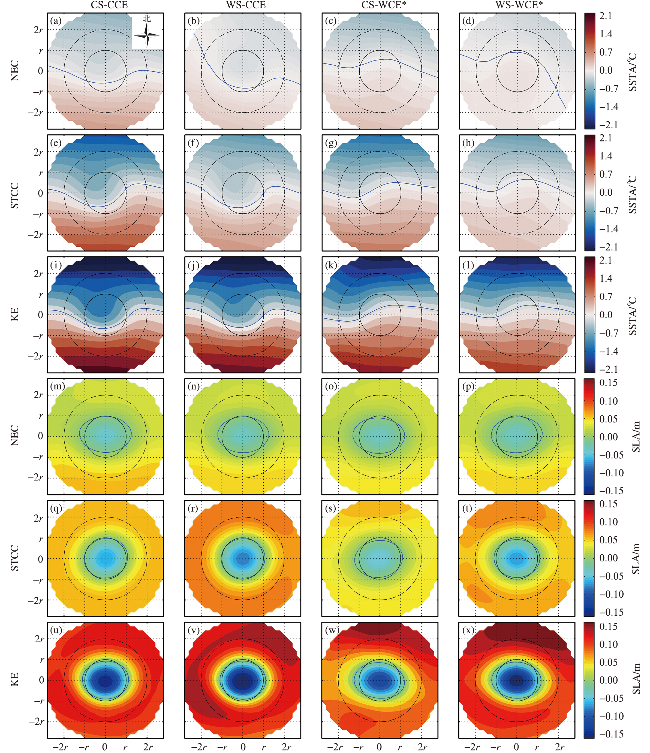
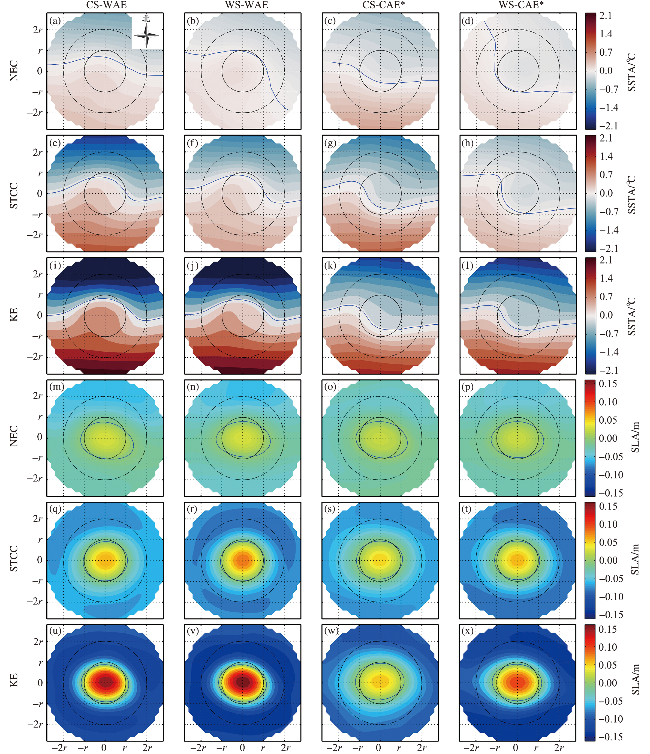
理想海洋背景下,北半球气旋(反气旋)涡呈逆(顺)时针旋转:涡旋西(东)侧的高纬冷水向南输送,涡旋东(西)侧的低纬暖水向北输送;同时,受海水辐散(聚)的影响,深层海水上涌(表层海水下沉),形成海表温度冷(暖)异常[16]。涡旋合成结果显示(图4和图5),常规涡旋的SSTA和SLA空间形态符合理想背景下海水运动规律,气旋(反气旋)涡的SSTA等值线向南(北)弯曲,SLA为负(正)值。在空间上,纬度越高,常规涡旋的SSTA和SLA幅值越大;在季节尺度上,冷、暖季SSTA和SLA空间分布的差异不明显。
图4 合成气旋涡的SSTA和SLA

[SSTA(SLA)图中蓝色实线表示0 ℃(0 m)等值线,黑色实线表示1倍涡旋半径,黑色虚线表示2倍涡旋半径。]

Fig.4 Composite SSTA and SLA of cyclonic eddies

[The blue solid line indicates the 0 ℃ (0 m) contour in the SSTA (SLA). The black solid line represents one times eddy radius,and the black dashed line represents twice eddy radius.]

图5 合成反气旋涡的SSTA和SLA

[SSTA(SLA)图中蓝色实线表示0 ℃(0 m)等值线,黑色实线表示1倍涡旋半径,黑色虚线表示2倍涡旋半径。]

Fig.5 Composite SSTA and SLA of anticyclonic eddies

[The blue solid line indicates the 0 ℃ (0 m) contour in the SSTA (SLA). The black solid line represents one times eddy radius,and the black dashed line represents twice eddy radius.]

与常规涡旋相比,反常涡旋的SSTA等值线弯曲方向相反、幅值较小,SLA振幅也较小、形状偏离圆形;空间上,低纬海域的涡旋振幅较中高纬海域的小,整体形态更偏离圆形,对称性差;SSTA、SLA的季节差异不明显。研究认为,反常涡旋的生成机制复杂,通常由常规涡旋在局地风场[17]或在其衰减阶段不稳定性[18]的影响下演化形成,因此其振幅、SSTA均较常规涡旋偏小。另外,边界流的斜压不稳定性[19]、涡旋内部与周围水团交换[20-21]以及涡旋内障碍层的影响[22]等也可能导致反常涡旋的生成。

3 结论

本文利用2010年1月1日—2019年10月15日的涡旋数据,按照海域(NEC、STCC、KE)、气旋涡与反气旋涡、冷季与暖季、SSTA正负,对西北太平洋中尺度涡进行分类、统计,分析SSTA和振幅特征,并通过合成分析探讨各类涡旋的SSTA和SLA空间结构。
对研究海域涡旋分类和统计的结果表明,研究海域主导涡旋类型为气旋冷涡与反气旋暖涡;同时也存在气旋暖涡或反气旋冷涡两类反常涡旋,其数量占涡旋总数的比例约为22.5%。空间上,低纬度NEC海域反常涡旋发生概率最高,高纬度KE海域发生概率最低;时间上,暖季反常涡旋的出现概率高于冷季。
西北太平洋,常规涡旋的SSTA幅值整体大于反常涡旋,且随纬度升高呈递增趋势;反常涡旋SSTA的海区间差异较小,各海区幅值均低于常规涡旋。常规涡旋SSTA的季节间差异大,冷季幅值高于暖季,而反常涡旋无明显季节差异。同时,常规涡旋平均振幅均高于反常涡旋;涡旋振幅均由南向北递增,其中在STCC与KE海域,振幅的季节变化显著,暖季大于冷季。
涡旋合成分析显示,常规涡旋SSTA的空间形态主要受涡旋极性与表层海水运动共同影响;相比于常规涡旋,反常涡旋SSTA的振幅小,SLA形态更偏离圆形,可能与其复杂的生成机制相关。
[1]
杨光. 西北太平洋中尺度涡旋研究[D]. 青岛: 中国科学院研究生院(中国科学院海洋研究所), 2013.

YANG G. A study on the mesoscale eddies in the northwestern Pacific Ocean[D]. Qingdao: Institute of Oceanology, Chinese Academy of Sciences, 2013.

[2]
DAI J, WANG H Z, ZHANG W M, et al. Observed spatiotemporal variation of three-dimensional structure and heat/salt transport of anticyclonic mesoscale eddy in Northwest Pacific[J]. Journal of Oceanology and Limnology, 2020, 38(6): 1654-1675.

DOI

[3]
WANG Y, ZHANG J H, YU J C, et al. Anticyclonic mesoscale eddy induced mesopelagic biomass hotspot in the oligotrophic ocean[J]. Journal of Marine Systems, 2023, 237: 103831.

DOI

[4]
胡冬, 陈希, 毛科峰, 等. 黑潮延伸体邻近区域中尺度涡特征统计分析[J]. 海洋与湖沼, 2018, 49(3):497-511.

HU D, CHEN X, MAO K F, et al. Statistical characteristics of mesoscale eddies near the Kuroshio extension region[J]. Oceanologia et Limnologia Sinica, 2018, 49(3): 497-511.

[5]
HAUSMANN U, CZAJA A. The observed signature of mesoscale eddies in sea surface temperature and the associated heat transport[J]. Deep Sea Research Part I: Oceanographic Research Papers, 2012, 70: 60-72.

DOI

[6]
LÜ M K, WANG F, LI Y L, et al. Structure of sea surface temperature anomaly induced by mesoscale eddies in the north Pacific Ocean[J]. Journal of Geophysical Research: Oceans, 2022, 127(3): e2021JC017581.

[7]
刘颖洁, 田丰林, 陈戈. 南海中尺度涡旋海表温度特征统计研究[J]. 中国海洋大学学报:自然科学版, 2020, 50(5):146-156.

LIU Y J, TIAN F L, CHEN G. Statistical characterization of sea surface temperature over mesoscale eddies in the South China Sea[J]. Periodical of Ocean University of China, 2020, 50(5): 146-156.

[8]
张铷火, 陈旭, 宁珏, 等. 太平洋中纬度不同区域气旋式暖涡和反气旋式冷涡的结构研究[J]. 海洋与湖沼, 2024, 55(3):599-612.

ZHANG R H, CHEN X, NING J, et al. Structures of “abnormal” eddies in different regions of the mid-latitude Pacific Ocean[J]. Oceanologia et Limnologia Sinica, 2024, 55(3): 599-612.

[9]
BROKAW R J, SUBRAHMANYAM B, TROTT C B, et al. Eddy surface characteristics and vertical structure in the Gulf of Mexico from satellite observations and model simulations[J]. Journal of Geophysical Research: Oceans, 2020, 125(2): e2019JC015538.

[10]
JULIAN P, PENG L. Interaction between the subtropical and equatorial ocean circulations: The subtropical cell[J]. Journal of Physical Oceanography, 1994, 24 (2): 466-497.

DOI

[11]
CHELTON D B, SCHLAX M G, SAMELSON R M. Global observations of nonlinear mesoscale eddies[J]. Progress in Oceanography, 2011, 91(2): 167-216.

DOI

[12]
HE Q Y, ZHAN H G, CAI S Q, et al. A new assessment of mesoscale eddies in the South China Sea: Surface features, three-dimensional structures, and thermohaline transports[J]. Journal of Geophysical Research: Oceans, 2018, 123(7): 4906-4929.

DOI

[13]
汤博, 侯一筠, 殷玉齐, 等. 北太平洋副热带逆流区中尺度涡旋的统计特征及其分布规律[J]. 海洋与湖沼, 2019, 50(5):937-947.

TANG B, HOU Y J, YIN Y Q, et al. Statistical characte-ristics of mesoscale eddies and the distribution in the north Pacific subtropical countercurrent[J]. Oceanologia et Limnologia Sinica, 2019, 50(5): 937-947.

[14]
SANDALYUK N V, BOSSE A, BELONENKO T V. The 3-D structure of mesoscale eddies in the Lofoten Basin of the Norwegian Sea: A composite analysis from altimetry and in situ data[J]. Journal of Geophysical Research: Oceans, 2020, 125(10): e2020JC016331.

[15]
LIU Y J, ZHENG Q A, LI X F. Characteristics of global ocean abnormal mesoscale eddies derived from the fusion of sea surface height and temperature data by deep learning[J]. Geophysical Research Letters, 2021, 48(17): e2021GL094772.

[16]
GAUBE P, CHELTON D B, SAMELSON R M, et al. Satellite observations of mesoscale eddy-induced Ekman pumping[J]. Journal of Physical Oceanography, 2015, 45(1): 104-132.

DOI

[17]
NI Q B, ZHAI X M, YANG Z B, et al. Generation of cold anticyclonic eddies and warm cyclonic eddies in the tropical oceans[J]. Journal of Physical Oceanography, 2023, 53(6): 1485-1498.

DOI

[18]
SUN W J, DONG C M, TAN W, et al. Statistical characteristics of cyclonic warm-core eddies and anticyclonic cold-core eddies in the north Pacific based on remote sensing data[J]. Remote Sensing, 2019, 11(2): 208.

DOI

[19]
TIMMERMANS M L, TOOLE J, PROSHUTINSKY A, et al. Eddies in the Canada Basin, Arctic Ocean, observed from ice-tethered profilers[J]. Journal of Physical Oceanography, 2008, 38(1): 133-145.

DOI

[20]
ITOH S, YASUDA I. Water mass structure of warm and cold anticyclonic eddies in the western boundary region of the subarctic north Pacific[J]. Journal of Physical Oceanography, 2010, 40(12): 2624-2642.

DOI

[21]
SUN W J, LIU Y, CHEN G X, et al. Three-dimensional properties of mesoscale cyclonic warm-core and anticyclonic cold-core eddies in the South China Sea[J]. Acta Oceanologica Sinica, 2021, 40(10): 17-29.

DOI

[22]
HE Q Y, ZHAN H G, CAI S Q. Anticyclonic eddies enhance the winter barrier layer and surface cooling in the Bay of Bengal[J]. Journal of Geophysical Research: Oceans, 2020, 125(10): e2020JC016524.

文章导航

/

〈 〉