
0 引言
1 数据与方法
1.1 涡动能
1.2 气候指数
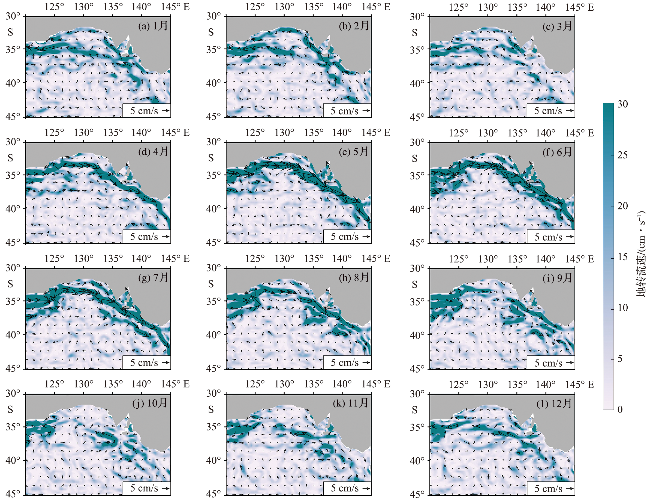
2 南澳大利亚海盆涡动能的空间分布和季节变化
3 涡动能的年际变化
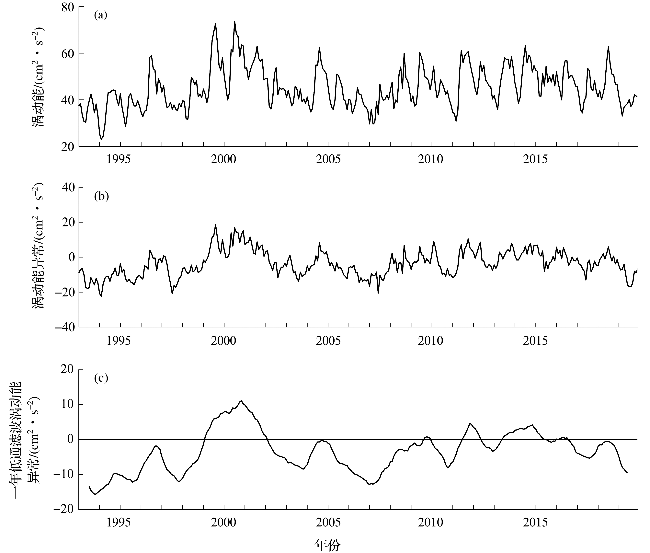
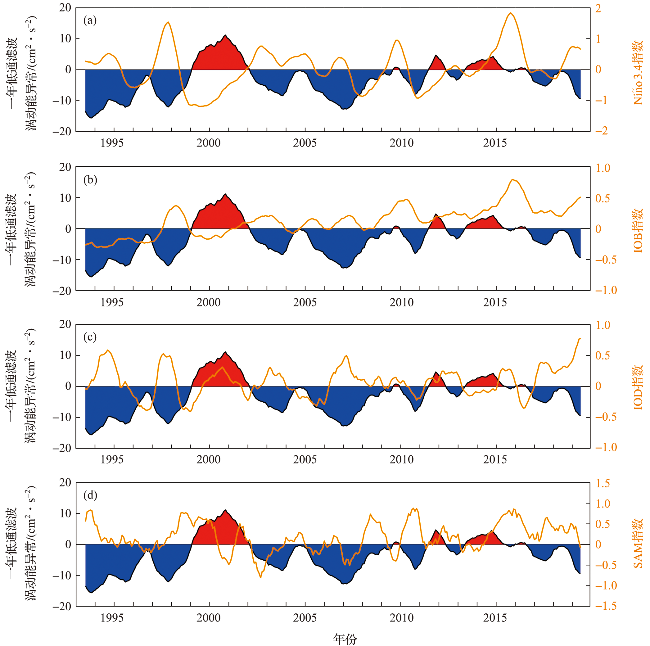
图7 南澳大利亚海盆一年低通滤波涡动能异常和Niño3.4指数(a)、IOB指数(b)、IOD指数(c)及SAM指数(d)的时间变化(红色表示涡动能正异常,蓝色表示涡动能负异常。) Fig.7 Time series of one year low-pass filtered EKE anomaly and Niño3.4 index (a), IOB index (b), IOD index (c) and SAM index (d) in the South Australian Basin (The red indicates positive EKE anomaly and blue indicates negative EKE anomaly.) |
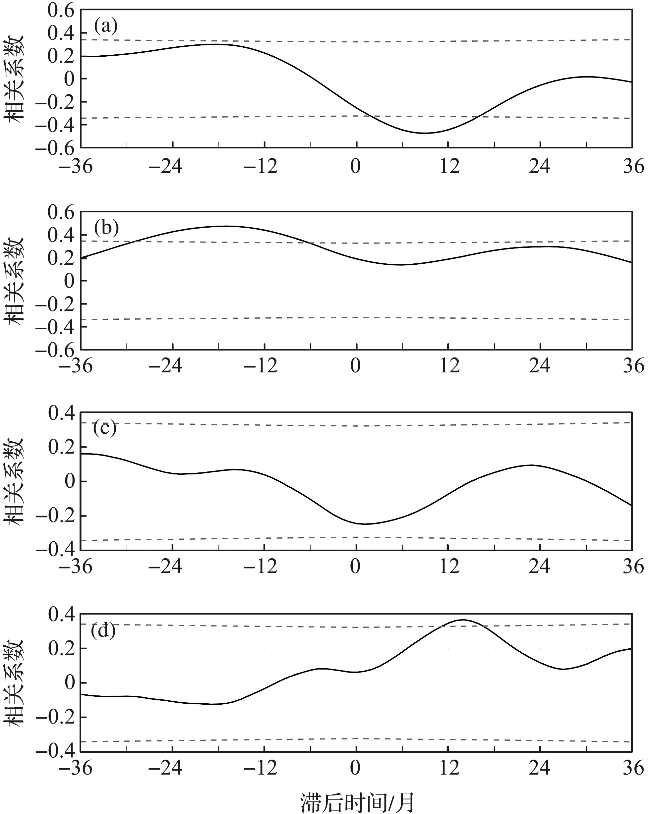
图8 一年低通滤波涡动能异常与Niño3.4指数(a)、IOB指数(b)、IOD指数(c)和SAM指数(d)的相关关系(滞后时间正值表示异常滞后于气候指数,负值表示异常超前于气候指数。虚线为95%的置信水平。) Fig.8 The correlations between one year low-pass filtered EKE anomaly and Niño3.4 index (a), IOB index (b), IOD index (c), and SAM index (d) (The positive value of lag time indicates that EKE anomaly lags the index and a negative value indicates that EKE anomaly leads the index, and dash lines represent 95% confidence level.) |
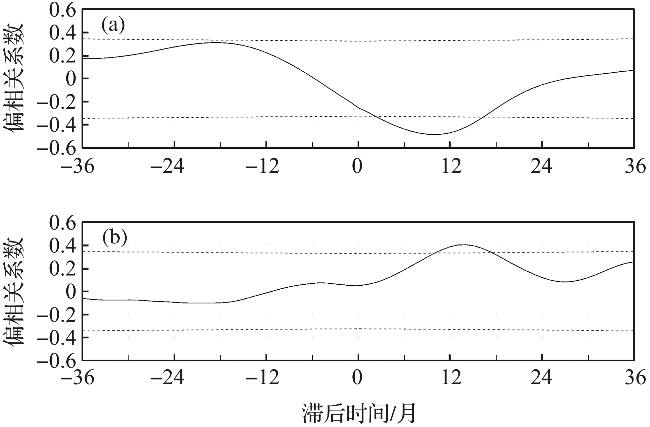
图9 一年低通滤波涡动能异常与Niño3.4指数(a)、SAM指数(b)的偏相关关系(滞后时间正值表示异常滞后于气候指数,负值表示异常超前于气候指数。虚线为95%的置信水平。) Fig.9 The partial correlations between one year low-pass filtered EKE anomaly and Niño3.4 index, after removing the SAM (a), between one year low-pass filtered EKE anomaly and SAM index, after removing the ENSO (b) (The positive value of lag time indicates that EKE anomaly lags the index and a negative value indicates that EKE anomaly leads the index, and dash lines represent 95% confidence level.) |