
0 引言
波浪是重要的海洋水文要素,是海洋工程建设和海洋生态保护的重要参数之一。随着浙江省海洋经济的快速发展,各种大型海洋工程陆续开工建设,诸如海上风电场、跨海桥梁隧道、海底管线等。在台风等极端天气条件下,波浪的巨大破坏力会给海洋工程构筑物带来极大的安全隐患。因此,对工程海域的波浪参数分布特征、尤其台风浪特征进行研究具有理论意义和工程实用价值。
现场实测和数学模型是研究波浪的两种常用手段。浙江海域的波浪研究主要集中在杭州湾、舟山群岛、三门湾、台州湾、南麂列岛等区域。杨斌 等[1-2]利用杭州湾中部一年实测波浪资料分析了波参数年内变化特征、波参数相关关系和频谱特性,还利用过境舟山东北部海域的6个台风浪资料分析了台风浪期间的波高、周期、频谱变化过程,并探讨了舟山东北部海域在不同台风路径、不同台风强度影响下的波浪成长衰减过程。周阳 等[3]利用三门湾一年实测波浪资料进行波参数统计和线性回归分析,探讨了台风影响下波参数和波浪谱的变化过程。刘海源 等[4]根据台州湾外海大陈岛40年的风浪资料建立波浪数学模型,计算台州湾不同重现期波浪要素,分析波浪年分频分级情况,得出H4%超过1 m的频率在每年20天以下,建港的波浪条件较好。郭敬 等[5]利用1949—2016年期间对南麂列岛海域影响严重的118场台风浪资料,基于SWAN波浪模型计算年极值波浪场,分析了不同重现期波浪空间分布场,从防灾减灾的角度为当地渔业养殖的规划布局提供参考依据。黄树生[6]统计分析了南麂岛站1960—1989年的实测波浪数据,发现该海域以3级波浪(轻浪)为主,各向平均波高为0.8~1.4 m,各向平均周期为4.7~5.7 s,7—10月的最大波高较大,测得的最大波高为10.0 m。
由于长周期波浪观测具有成本高、设备维护困难等特性,因此苍南近岸海域长周期现场实测波浪资料较少。因苍南近岸海域距离南麂列岛较近,在一般工程应用上常用南麂岛站波浪数据通过数值模拟推算苍南近岸工程海域的设计波浪。局部海域的波浪特征与其具体的水文气象动力条件和地形地貌条件有关[7],考虑到数值模拟的精确度问题,对于大型工程而言不能用南麂岛海域的波浪特征完全代表苍南近岸海域的波浪特征。本文利用苍南近岸海域波浪观测站一年实测波浪资料,统计分析各波参数的分布特征和波高-周期的联合分布特征,运用最小二乘法拟合分析波参数的相关关系,估算波浪能水平,分析典型台风浪特征,以期为该局部海域的海洋工程建设、防灾减灾和海洋生态环境保护提供相对精确的基础资料。
1 数据获取和处理
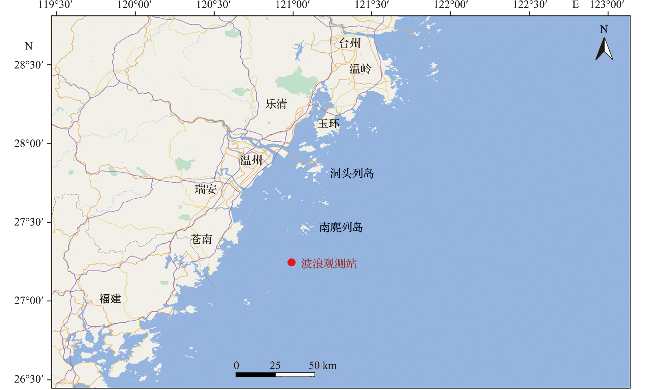
波浪观测站位于苍南近岸(见图1),离岸约40 km,距离南麂列岛以南约30 km,水深约30 m。观测站周围无明显遮挡,可观测到各方向的来波,波浪代表性较好。采用挪威Nortek公司的声学多普勒波浪流速剖面仪(acoustic wave and current meter,AWAC ) “浪龙”座底观测。“浪龙”采用声学表面跟踪(acoustic surface tracing,AST)法测波,每小时测量一次波面,采样频率为1 Hz,一次可采集1 024个波面数据,观测周期为2019年7月1日—2020年6月30日。处理异常数据后共计获取8 774组完整波浪数据,获取率为99.89%。用配套的Storm软件处理数据,可得到波高、周期、波向等波要素,包括最大波高Hmax及其对应周期Tmax、十分之一波高H1/10及其对应周期T1/10、有效波高H1/3及其对应周期T1/3、平均波高Hmean及其对应平均周期Tmean以及谱峰周期Tp等。
2 波浪要素统计分析
2.1 波高、周期年内变化特征
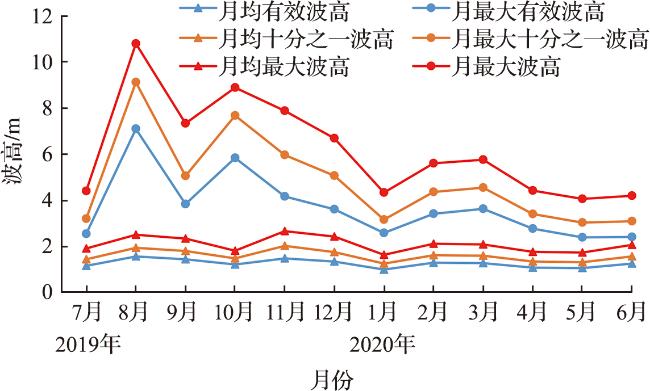
各波要素特征值见表1。图2为观测期间有效波高和平均周期随时间的变化过程曲线。在观测期内,年平均周期为4.5 s,年最大平均周期为9.2 s;年均有效波高为1.25 m,年最大有效波高为7.09 m;年均十分之一波高为1.58 m,年最大十分之一波高为9.12 m;年均最大波高为2.07 m,年最大波高为10.80 m。在2019年8月和2019年10月,受台风“利奇马”和“米娜”影响,各级波高均明显存在一个极值和次极值,期间最大波高分别为10.80 m和8.89 m。8—10月南麂岛站最大波高较大,文献[6]中实测最大波高为10.0 m,与本文较为一致。图3为有效波高、十分之一波高和最大波高的逐月变化过程,可以看出:月均有效波高、月均十分之一波高和月均最大波高在年内变化较为稳定,总体上在8—9月、11—12月相对较高;月最大有效波高、月最大十分之一波高和月最大波高具有明显的波动性, 8月和10月存在明显的增大过程,这与夏、秋季台风较为活跃有关。
表1 波要素特征值统计表Tab.1 Statistical table of wave characteristics |
| 年 | 月 | 月平均 周期/s | 月最大平均 周期/s | 月均有效 波高/m | 月最大有效 波高/m | 月均十分之一 波高/m | 月最大十分之一 波高/m | 月均最大 波高/m | 月最大 波高/m |
|---|---|---|---|---|---|---|---|---|---|
| 2019年 | 7月 | 4.2 | 6.5 | 1.14 | 2.53 | 1.43 | 3.19 | 1.90 | 4.39 |
| 8月 | 4.7 | 8.4 | 1.55 | 7.09 | 1.93 | 9.12 | 2.49 | 10.80 | |
| 9月 | 4.5 | 7.5 | 1.43 | 3.82 | 1.79 | 5.05 | 2.33 | 7.33 | |
| 10月 | 4.8 | 8.1 | 1.20 | 5.83 | 1.47 | 7.67 | 1.80 | 8.89 | |
| 11月 | 5.1 | 9.2 | 1.47 | 4.16 | 2.01 | 5.96 | 2.65 | 7.88 | |
| 12月 | 4.9 | 8.9 | 1.33 | 3.60 | 1.74 | 5.06 | 2.41 | 6.68 | |
| 2020年 | 1月 | 4.4 | 6.3 | 0.98 | 2.57 | 1.24 | 3.15 | 1.62 | 4.32 |
| 2月 | 4.5 | 6.0 | 1.28 | 3.40 | 1.60 | 4.35 | 2.10 | 5.60 | |
| 3月 | 4.1 | 5.9 | 1.26 | 3.62 | 1.58 | 4.54 | 2.07 | 5.75 | |
| 4月 | 4.1 | 5.8 | 1.06 | 2.76 | 1.33 | 3.39 | 1.75 | 4.41 | |
| 5月 | 4.4 | 6.7 | 1.04 | 2.38 | 1.30 | 3.02 | 1.72 | 4.05 | |
| 6月 | 3.8 | 5.0 | 1.24 | 2.40 | 1.55 | 3.08 | 2.05 | 4.19 |
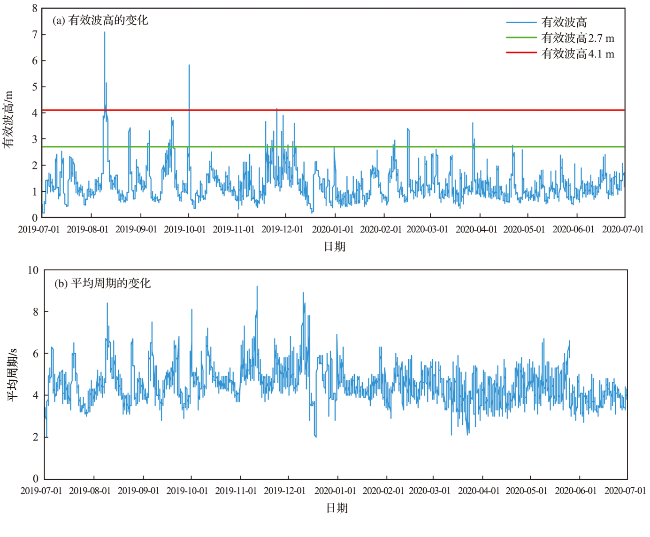
图2 观测期间有效波高(a)和平均周期(b)随时间的变化过程Fig.2 Change process of annual significant wave height (a) and average period with time (b) |
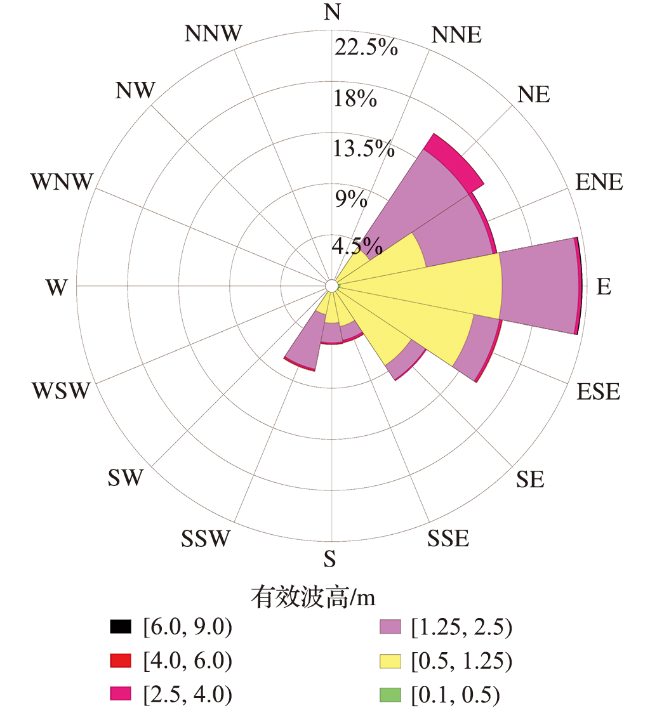
2.2 波级、波向、周期分布特征
表2 各级有效波高出现频率Tab.2 Occurrence frequency of the significant wave height at all levels |
| 波级 | 有效波高/m | 出现频率/% | ||||
|---|---|---|---|---|---|---|
| 观测期间 | 春季 | 夏季 | 秋季 | 冬季 | ||
| 小浪 | [0.1,0.5) | 2.98 | 0.23 | 0.80 | 0.81 | 1.14 |
| 轻浪 | [0.5,1.25) | 57.46 | 17.62 | 13.52 | 12.35 | 13.97 |
| 中浪 | [1.25,2.5) | 35.90 | 6.94 | 9.80 | 9.99 | 9.17 |
| 大浪 | [2.5,4.0) | 3.16 | 0.30 | 0.64 | 1.68 | 0.54 |
| 巨浪 | [4.0,6.0) | 0.42 | 0 | 0.34 | 0.08 | 0 |
| 狂浪 | [6.0,9.0) | 0.08 | 0 | 0.08 | 0 | 0 |
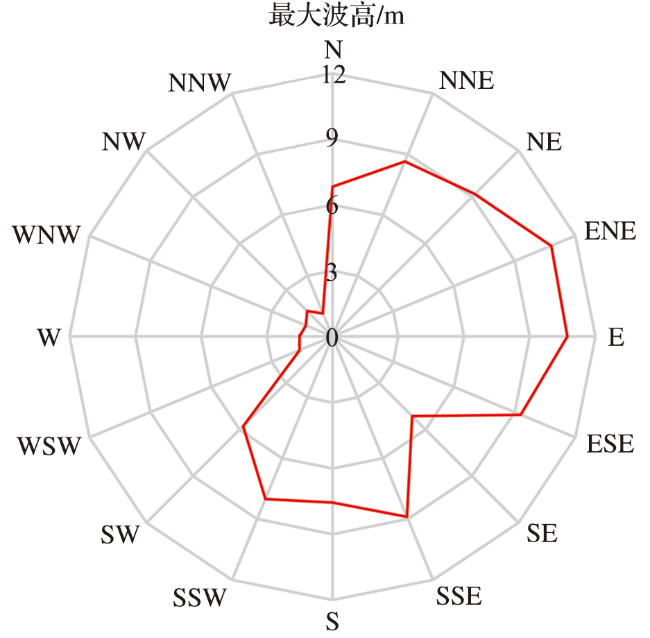
表3 各级有效波高各向出现频率Tab.3 Occurrence frequency of the significant wave height of all levels and directions |
| 波向 | 出现频率/% | ||||||
|---|---|---|---|---|---|---|---|
| 小浪 | 轻浪 | 中浪 | 大浪 | 巨浪 | 狂浪 | 合计 | |
| N | 0 | 0.05 | 0.02 | 0 | 0.01 | 0 | 0.08 |
| NNE | 0 | 0.07 | 0.26 | 0.03 | 0.03 | 0 | 0.39 |
| NE | 0.42 | 3.70 | 10.68 | 1.69 | 0.03 | 0 | 16.52 |
| ENE | 0.31 | 8.37 | 6.12 | 0.35 | 0.01 | 0.02 | 15.18 |
| E | 0.66 | 14.6 | 6.87 | 0.28 | 0.01 | 0.06 | 22.48 |
| ESE | 0.77 | 12.38 | 2.35 | 0.21 | 0.08 | 0 | 15.79 |
| SE | 0.47 | 8.15 | 1.53 | 0.14 | 0 | 0 | 10.29 |
| SSE | 0.17 | 3.54 | 1.24 | 0.19 | 0.07 | 0 | 5.21 |
| S | 0.09 | 3.25 | 1.76 | 0.13 | 0.07 | 0 | 5.30 |
| SSW | 0.07 | 2.55 | 4.99 | 0.13 | 0.10 | 0 | 7.84 |
| SW | 0 | 0.34 | 0.08 | 0.01 | 0 | 0 | 0.43 |
| WSW | 0.01 | 0.25 | 0 | 0 | 0 | 0 | 0.26 |
| W | 0.01 | 0.11 | 0 | 0 | 0 | 0 | 0.12 |
| WNW | 0 | 0.03 | 0 | 0 | 0 | 0 | 0.03 |
| NW | 0 | 0.06 | 0 | 0 | 0.01 | 0 | 0.07 |
| NNW | 0 | 0.01 | 0 | 0 | 0 | 0 | 0.01 |
| 合计 | 2.98 | 57.46 | 35.90 | 3.16 | 0.42 | 0.08 | 100 |
各级平均波周期的出现频率如表4所示。研究海域以平均周期3~5 s的短周期波浪为主,合计出现频率76.67%,其中又以平均周期4~5 s为最多,出现频率49.46%。从季节特征看,四季均以平均周期4~5 s为多, 5 s以上的略长平均周期的波浪呈现夏、冬季出现频率高于春、秋季的特征,这与夏季台风和冬季寒潮多引起海域较长周期波浪有关。
表4 不同平均周期出现频率Tab.4 Occurrence frequency of the different average wave period |
| 平均周期/s | 出现频率/% | ||||
|---|---|---|---|---|---|
| 观测期间 | 春季 | 夏季 | 秋季 | 冬季 | |
| (0,3) | 1.04 | 0.42 | 0.22 | 0.09 | 0.31 |
| [3,4) | 27.21 | 9.81 | 10.39 | 2.97 | 4.04 |
| [4,5) | 49.46 | 11.92 | 10.76 | 13.39 | 13.39 |
| ≥5 | 22.29 | 2.94 | 7.13 | 4.45 | 7.77 |
2.3 波高-周期联合分布
研究海域有效波高和谱峰周期的联合分布(表5)以谱峰周期5~9 s的轻浪为主,合计出现频率43.22%。从波级和对应谱峰周期看,轻浪和中浪谱峰周期以5~7 s和7~9 s为多,大浪谱峰周期以7~9 s和9~11 s为多,巨浪谱峰周期以9~11 s和11 s以上为多,狂浪的谱峰周期则均在11 s以上,总体上有效波高和谱峰周期呈现浪大、周期长的特征。
表5 有效波高和谱峰周期联合分布Tab.5 Joint distribution of significant wave height and spectral peak period |
| 谱峰 周期/s | 出现频率/% | ||||||
|---|---|---|---|---|---|---|---|
| 小浪 | 轻浪 | 中浪 | 大浪 | 巨浪 | 狂浪 | 合计 | |
| [3,5) | 0.28 | 5.09 | 0.63 | 0.02 | 0 | 0 | 6.02 |
| [5,7) | 1.27 | 21.18 | 13.95 | 0.51 | 0.05 | 0 | 36.96 |
| [7,9) | 0.98 | 22.04 | 13.00 | 1.28 | 0.05 | 0 | 37.35 |
| [9,11) | 0.14 | 5.84 | 6.12 | 1.03 | 0.17 | 0 | 13.30 |
| ≥11 | 0.32 | 3.28 | 2.12 | 0.40 | 0.17 | 0.08 | 6.37 |
3 波参数相关性分析
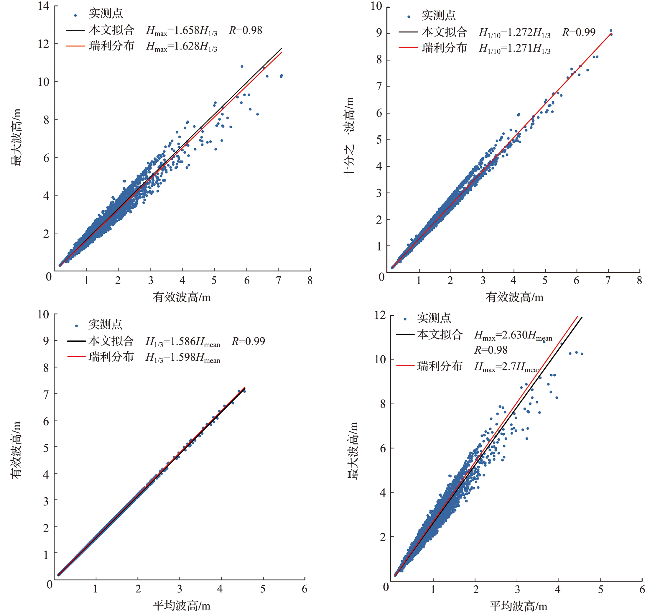
3.1 波高
3.2 周期
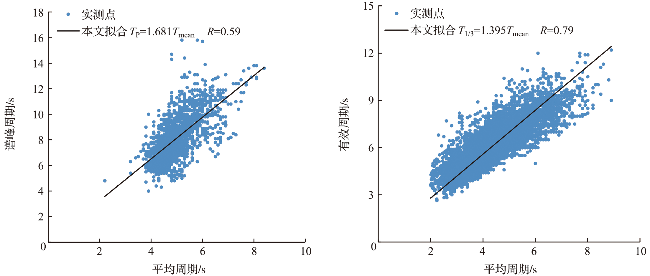
采用与特征波高相同的拟合方法,对几种特征周期进行拟合分析,结果如图7所示:Tp和Tmean、T1/3和Tmean之间的线性相关系数分别为0.59和0.79,其中,Tp和Tmean的相关性一般,T1/3和Tmean的相关性相对较好。
3.3 波高和周期
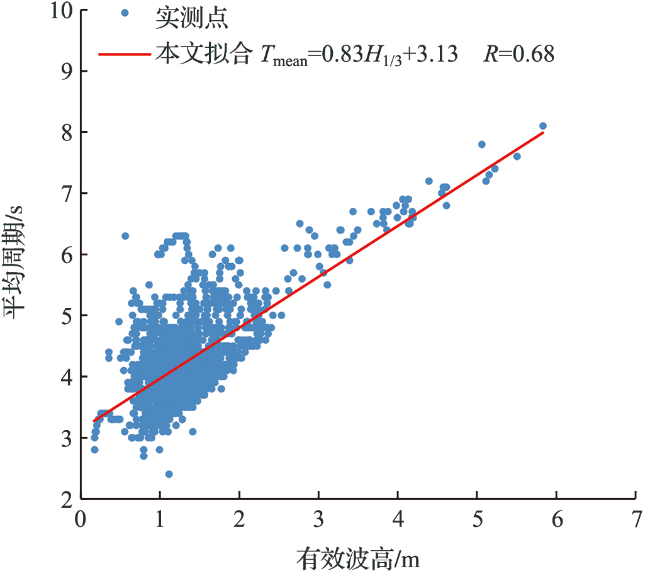
关于波高和周期的相关性,徐啸 等[11]用线性关系表征了台湾海峡中部波高与周期的关系:T1/3=0.73H1/3+5.43。本文对平均周期Tmean和有效波高H1/3进行拟合,得到相关系数为0.45,相关性并不显著。将波向按16个方位进行划分,分别拟合各波向的平均周期Tmean和有效波高H1/3相关关系(需指出的是,WSW—NNE(顺时针)向波浪出现较少,拟合误差较大,不予拟合计算)。由图8可知,NE—SE向浪(顺时针)Tmean和H1/3的相关系数较小,其余偏南向浪(SSE—S—SSW)(顺时针)的相关系数相对较大。对SSE—S—SSW浪的波高、周期进行拟合,相关系数为0.68(图9),相关性略好,其拟合关系Tmean=0.83H1/3+3.13可为该海域的波高、周期关系研究提供一定参考。
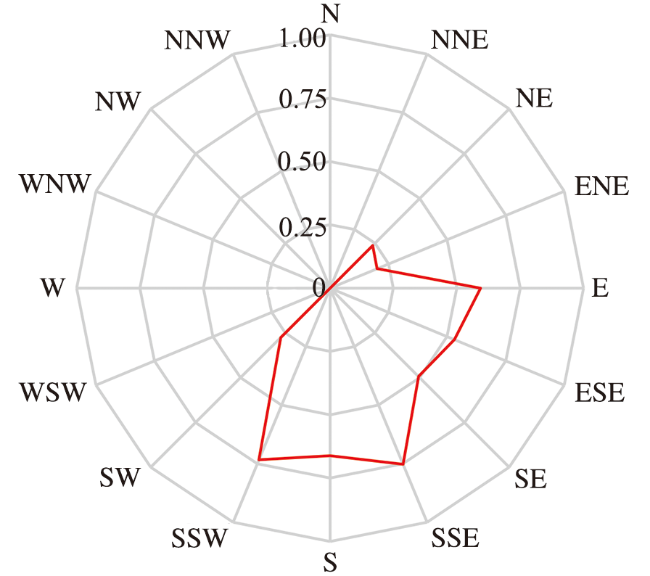
图8 NE—SW向有效波高和平均波周期相关系数玫瑰图Fig.8 Rose diagram of correlation coefficient of significant wave height and mean wave period from northeast to southwest direction |
3.4 波浪持续时间和波高的关系
波浪持续时间指的是大于等于某特定波高所持续的时间,波浪平均持续时间是指某特定波高所对应的各次持续时间的平均值。波浪的波高和持续时间都是表征波浪能水平的重要参数, LAWSON 等[12]提出波浪平均持续时间和波高之间存在着指数关系:
D=α×Hβ
式中:α和β为拟合参数,H为设定波高,D为大于等于设定波高H的平均持续时间。
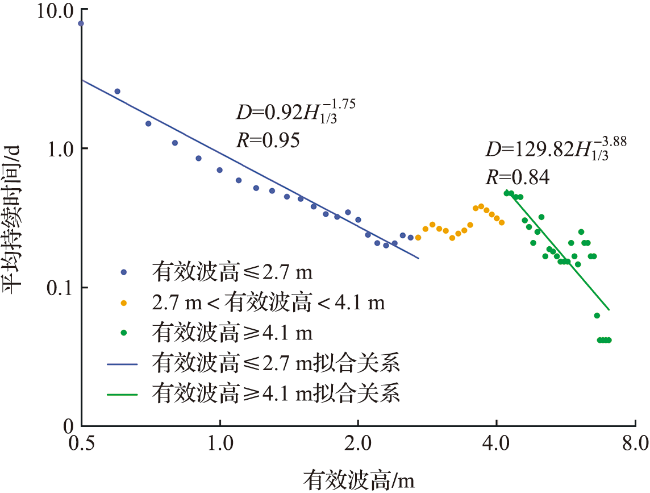
本文以有效波高为例,以0.5 m为起点,按0.1 m的幅度递增,统计了对应的平均持续时间(表6),其拟合关系如图10所示,平均持续时间随波高主要呈现三个变化过程。当设定有效波高在2.7 m以下时,平均持续时间随设定波高的增大而衰减,拟合结果D=0.92 ,相关系数为0.95,相关性较好。当设定有效波高在2.7~4.1 m范围内时,平均持续时间随设定波高的增大呈现两段先增长后衰减的过程,其中,有效波高在2.7~3.7 m时,波浪平均持续时间总体趋势是随设定波高的增大而增长,这是因为该范围内的波高在夏、秋季台风和冬季寒潮期间均有出现(图2)。有效波高继续增大至3.7~4.1 m时,由寒潮产生的大波高减少,平均持续时间随设定波高的增加而略有小幅衰减。由于2.7~4.1 m范围的样本数较少,波高和平均持续时间的拟合效果一般,相关性并不显著。当设定有效波高在4.1 m以上时,波浪全部由台风所致(图2),平均持续时间随设定波高的增加而衰减,且衰减速率高于设定有效波高在2.7 m以下时,拟合结果D=129.82 ,相关系数为0.84,相关性较好。综上,本研究海域在大多时段内,即有效波高在2.7 m以下的非台风、非寒潮期以及有效波高在4.1 m以上的台风期,平均持续时间随波高的增大而减小,符合LAWSON 等[12]提出的指数衰减关系,且有效波高在4.1 m以上的台风期的衰减速率高于有效波高在2.7 m以下的非台风、非寒潮期的衰减速率。
表6 设定有效波高和对应平均持续时间统计表Tab.6 Statistical table of setting significant wave height and corresponding average duration |
| 有效波高/m | 0.5 | 0.6 | 0.7 | 0.8 | 0.9 | 1.0 | 1.1 | 1.2 | 1.3 | 1.4 | 1.5 | 1.6 | 1.7 | 1.8 | 1.9 | 2.0 | 2.1 | 2.2 | 2.3 | 2.4 | 2.5 | 2.6 |
|---|---|---|---|---|---|---|---|---|---|---|---|---|---|---|---|---|---|---|---|---|---|---|
| 平均持续时间/d | 7.86 | 2.56 | 1.50 | 1.09 | 0.84 | 0.69 | 0.59 | 0.52 | 0.49 | 0.45 | 0.43 | 0.38 | 0.34 | 0.32 | 0.35 | 0.30 | 0.24 | 0.21 | 0.20 | 0.21 | 0.24 | 0.23 |
| 有效波高/m | 2.7 | 2.8 | 2.9 | 3.0 | 3.1 | 3.2 | 3.3 | 3.4 | 3.5 | 3.6 | 3.7 | 3.8 | 3.9 | 4.0 | 4.1 | 4.2 | 4.3 | 4.4 | 4.5 | 4.6 | 4.7 | 4.8 |
| 平均持续时间/d | 0.23 | 0.26 | 0.28 | 0.26 | 0.25 | 0.23 | 0.24 | 0.26 | 0.28 | 0.37 | 0.38 | 0.36 | 0.33 | 0.31 | 0.29 | 0.47 | 0.47 | 0.44 | 0.44 | 0.30 | 0.27 | 0.21 |
| 有效波高/m | 4.9 | 5.0 | 5.1 | 5.2 | 5.3 | 5.4 | 5.5 | 5.6 | 5.7 | 5.8 | 5.9 | 6.0 | 6.1 | 6.2 | 6.3 | 6.4 | 6.5 | 6.6 | 6.7 | 6.8 | 6.9 | 7.0 |
| 平均持续时间/d | 0.25 | 0.32 | 0.17 | 0.19 | 0.18 | 0.17 | 0.15 | 0.15 | 0.15 | 0.21 | 0.17 | 0.15 | 0.25 | 0.21 | 0.21 | 0.17 | 0.17 | 0.06 | 0.04 | 0.04 | 0.04 | 0.04 |
4 波浪能估算
式中:Pw为波浪能流密度,H1/3为有效波高,Tmean为平均周期。
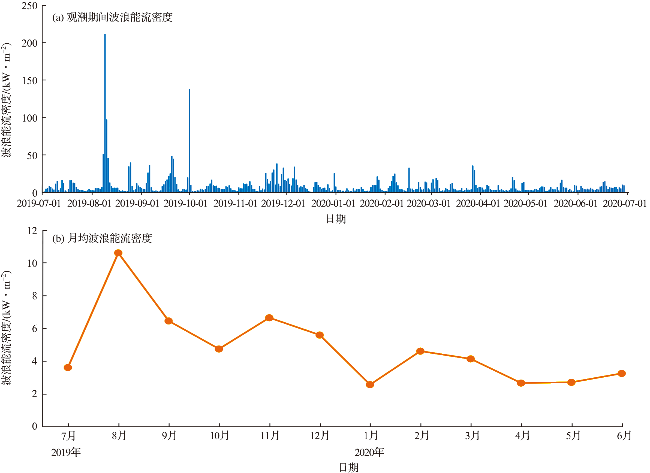
和前人的数模计算[16-17]相对比,本文计算结果与之较为一致。需指出的是,与文献[16]和文献[17]采用长周期波浪资料不同,本文计算所采用的是一年实测波浪资料,因此本文计算结果仅供参考。由公式(2)计算的观测期间和各月月均波浪能流密度的变化过程见图11。波浪能流密度在2019年8月和2019年10月均出现明显的极大值(图11a),这分别对应台风“利奇马”和“米娜”的过境影响。波浪能流密度在观测期间的变化幅度相对较大,月均波浪能流密度介于2.58~10.61 kW/m2,总体上夏、秋季的波浪能流密度大于冬、春季,最大值出现在2019年8月(图11b)。冯兴如 等[13]和任建莉 等[18]认为波浪能流密度大于2 kW/m2时,波浪能的开发利用价值相对较好。研究海域观测期间波浪能流密度大于2 kW/m2的出现频率为61%,波浪能的开发条件较为适宜。
5 台风浪特征
以观测期内最大波高10.80 m所对应的台风“利奇马”为例,分析观测海域的台风浪特征。
5.1 台风浪的发展
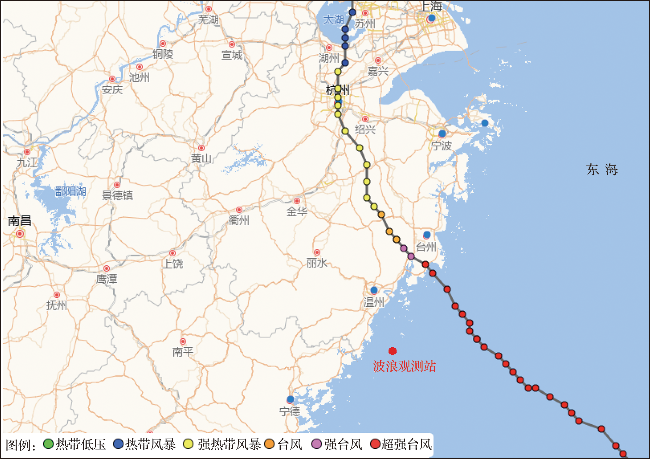
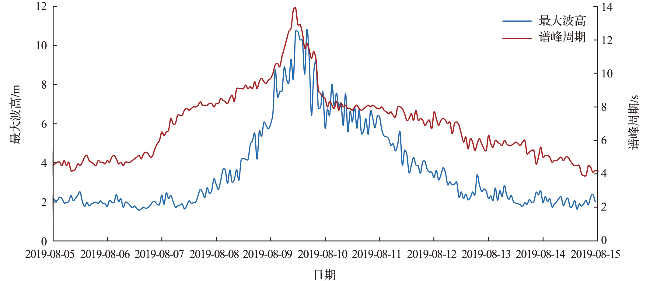
2019年8月4日,台风“利奇马”在菲律宾以东洋面生成,随后强度逐渐加强并向我国沿海移动,于8月9日以超强台风等级进入东海,于8月10日2时前后以超强台风等级在浙江省台州市温岭沿海登陆,登陆后台风强度逐渐减弱。“利奇马”的移动路径见图12,台风影响期间的最大波高和谱峰周期见图13。可以看出台风对观测海域的影响大约持续了3天,即2019年8月8日—10日,期间最大波高和谱峰周期均经历了明显的先增大后减小的过程,其中影响最为显著的是8月9日,最大波高和谱峰周期的波动最为剧烈。当与台风相距较远时,观测海域的最大波高和谱峰周期较小,分别维持在2 m和4 s左右;8月7日起,随着台风的靠近,台风引起的外海涌浪开始影响观测海域,最大波高和谱峰周期开始逐渐增大;8月9日11时记录到谱峰周期的峰值13.9 s以及最大波高的第一个峰值10.72 m,此后谱峰周期和最大波高明显下降,但此时台风浪的影响仍在持续,最大波高再次增大,至14时记录到最大波高的峰值10.80 m;此后最大波高和谱峰周期同步明显下降,至8月10日2时台风登陆,谱峰周期降至8 s左右,最大波高降至6 m左右;随着台风的远去,最大波高和谱峰周期的下降趋缓,至8月14日恢复至台风影响前。
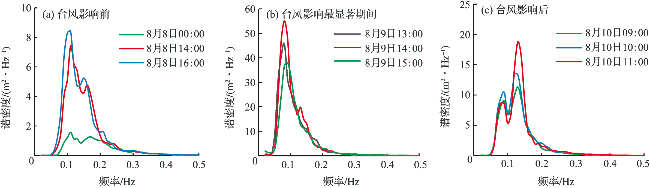
5.2 台风浪谱
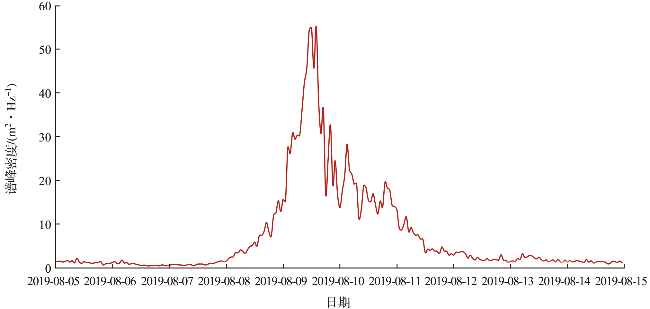
图14 台风“利奇马”期间波浪谱峰密度变化过程Fig 14 Variation process of wave spectrum peak density during typhoon “Lekima” |
6 结语
利用苍南近岸海域一年实测波浪数据,分析了波参数分布特征、波参数之间的相关关系以及波浪持续时间和波高的关系,估算了波浪能水平,并以台风“利奇马”为例分析了典型台风浪特征,相关成果可为该海域的海洋工程、防灾减灾、生态环保提供科学依据,也可为进一步开展与南麂列岛海域波浪特征的异同研究提供基础资料。
1)研究海域年平均有效波高为1.25 m,年平均十分之一波高为1.58 m,年平均最大波高为2.07 m,年平均周期为4.5 s。平均波高总体上夏、秋季略大于冬、春季,而最大波高则波动明显。夏季8月和秋季10月的最大波高存在明显增大过程,原因是夏、秋季台风活动的影响。年最大波高10.80 m出现在2019年8月台风“利奇马”过境时。
2)研究海域以轻浪和中浪为主,出现频率分别为57.46%和35.90%。主要盛行NE—E—SE向浪,常浪向为E,次常浪向为NE。强浪向为ENE,对应最大波高10.80 m;次强浪向为E,对应最大波高10.72 m,均出现在台风“利奇马”过境时。平均周期以3~5 s短周期为主。有效波高和谱峰周期联合分布表明该海域以谱峰周期5~9 s的轻浪为主,总体上波级增大则谱峰周期增长,呈现浪大周期长的特征。特征波高之间存在显著的线性相关关系,符合典型的瑞利分布;特征波周期之间的相关性则较为一般。
3)有效波高2.7 m以下的非台风期、非寒潮期以及4.1 m以上的台风期,波浪平均持续时间和有效波高符合指数衰减关系,平均持续时间随有效波高的增大而减小,且4.1 m以上台风期的波浪衰减速率高于2.7 m以下的非台风期、非寒潮期。
4)观测期间波浪能流密度在夏、秋季大于冬、春季,在夏季8月最大,波浪能流密度在2 kW/m以上的出现频率为61%,总体上波浪能的开发条件较为适宜。
5)台风“利奇马”影响期间,最大波高、谱峰周期、谱峰密度呈现基本同步的先增大后减小的过程,最大谱峰密度为55.10 m2/Hz。台风影响前、后的台风浪谱型均呈双峰谱,台风影响最显著期间的波浪谱型呈单峰谱。