Distribution and interannual changes of PAHs in surface sediments from the adjacent waters of the green petrochemical project

  • REN Shijun , 1 ,
  • ZHANG Li 1 ,
  • WANG Hongguang 1 ,
  • ZHANG Qinghong 1 ,
  • ZHUANG Tonghui 1 ,
  • WEI Na 1 ,
  • SONG Jihong 1 ,
  • CHENG Luxian 1 ,
  • WANG You 2 ,
  • MU Qinglin , 1, *
Expand
  • 1. Zhejiang Marine Ecology and Environment Monitoring Center, Zhoushan 316000, China
  • 2. College of Marine Life Sciences, Ocean University of China, Qingdao 266000, China

Received date: 2022-09-06

  Revised date: 2023-02-27

  Online published: 2023-10-24

Abstract

To evaluate the environmental changes before and after the operation of the green petrochemical project, polycyclic aromatic hydrocarbons (PAHs) in the surface sediments of the adjacent sea area of Yushan Island where the project is located, were investigated and monitored for four consecutive years from 2018 to 2021. The results showed the total PAHs contents ranged from 16.9 to 178.0 μg·kg-1 with the average content of 75.9±24.0-102.6±41.4 μg·kg-1, showing an overall downward trend over the past four years, with a lower overall concentration compared to other sea areas in China. The average content of different PAHs components in the investigated surface sediments from high to low were: 4 rings PAHs, 5 rings PAHs, 3 rings PAHs, 6 rings PAHs and 2 rings PAHs. The surface sediments of the surveyed sea area was mainly composed of silt, and the spatial distribution of PAHs was influenced by various factors. The sources of PAHs in the surveyed sea area were relatively stable, with small interannual differences, mainly originating from the long-distance migration of combustion products of substances such as oil, firewood, and coal. According to the sediments quality baseline method evaluation, the ecological risk level of PAHs in the surveyed sea area sediments was relatively low. The green petrochemical project did not cause an increase in PAHs of sediments in adjacent sea areas during the construction and production periods. However, as the project continues to operate, its impact on the surrounding ecological environment still needs to be continuously monitored.

Cite this article

REN Shijun , ZHANG Li , WANG Hongguang , ZHANG Qinghong , ZHUANG Tonghui , WEI Na , SONG Jihong , CHENG Luxian , WANG You , MU Qinglin . Distribution and interannual changes of PAHs in surface sediments from the adjacent waters of the green petrochemical project[J]. Journal of Marine Sciences, 2023 , 41(3) : 83 -91 . DOI: 10.3969/j.issn.1001-909X.2023.03.008

0 引言

多环芳烃(PAHs)是一类持久性有机污染物,具有疏水亲脂的特性,易通过有机颗粒吸附而沉降于海底,或通过水生生物的吸收、利用,进入食物链,或随沉积物再悬浮进入水体,造成二次污染[1-3]。PAHs是石化行业特征污染物之一,而石化行业是国民经济的基础产业和重要支柱[4]。绿色石化项目地处长三角一体化国家战略区,生产规模较大,投产后是否会造成周边海域沉积物中PAHs含量升高?其邻近海域沉积物中PAHs的主要来源是什么?这些问题都需要引起关注。
本研究监测了绿色石化项目建设期及运营期邻近海域表层沉积物中PAHs的时空分布和变化,结合建设前海域海洋沉积物PAHs的调查数据[5],分析了其来源及生态风险,可为绿色石化项目的环境管理和可持续发展提供科学依据。

1 材料与方法

1.1 样品采集

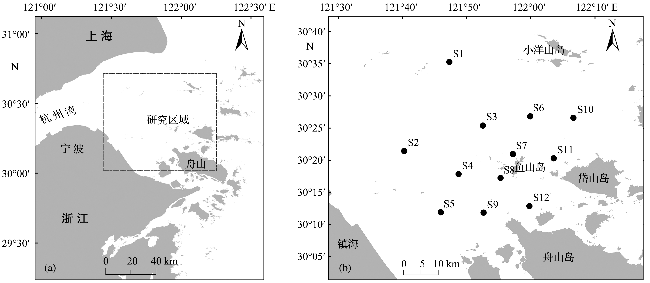
在绿色石化项目所在地鱼山岛邻近海域设置12个监测站位,站位见图1。调查海域东北角为小洋山岛,东侧为岱山岛,西侧为杭州湾,东南侧为舟山岛,西南角毗邻宁波镇海,其沿岸为产能2 000万吨/年的镇海炼化项目。2018—2021年每年的4月,采用抓斗式采样器采集表层(0~1 cm)沉积物样品,用铝箔包好,置于不锈钢盒中,-20 ℃冰冻保存。
图1 研究区及采样站位图

Fig.1 Study area and sampling sites

1.2 样品处理与分析

沉积物样品进行冷冻干燥,研磨过筛后待测,前处理及测定参照《土壤和沉积物 多环芳烃的测定 气相色谱-质谱法》(HJ 805—2016)[6]。取30.0 g样品(干样),用1∶1的丙酮-正己烷提取,提取液浓缩后采用GPC净化,再次浓缩,用正己烷定容到1.00 mL,上GC-MS测定。共测定16种PAHs,分别是萘(Nap)、苊烯(Acy)、苊(Act)、芴(Flu)、菲(Phe)、蒽(Ant)、荧蒽(Fla)、芘(Pyr)、苯并[a]蒽(BaA)、屈(Chr)、苯并[b]荧蒽(BbF)、苯并[k]荧蒽(BkF)、苯并[a]芘(BaP)、二苯并[a.h]蒽(DBA)、茚并[1.2.3-cd]芘(InP)和苯并[g.h.i]苝(BgP)。16种PAHs的苯环个数见表1,其中2环、3环的6种为低分子量PAHs(LMW),4~6环的10种为高分子量PAHs(HMW)。沉积物有机碳测定采用重铬酸钾氧化-还原容量法,粒度通过激光粒度仪(microtrac 3500型)测定。
表1 调查海域表层沉积物中PAHs含量

Tab.1 PAHs contents in surface sediments of survey areas

PAHs 苯环个数/个 含量/(μg·kg-1)
2018年 2019年 2020年 2021年
PAHs 27.8~163.0 (89.7±38.5) 27.5~149.0 (102.6±41.4) 24.7~178.0(79.0±40.4) 16.9~114.0 (75.9±24.0)
Nap 2 1.4~7.9 (4.4±1.8) 1.2~11.9 (6.3±3.5) ND~16.1 (5.4±6.4) 0.4~5.4 (2.8±1.4)
Acy 3 ND~1.3 (0.6±0.3) 0.2~3.0 (0.9±0.7) ND~20.3 (4.2±6.4) 0.2~1.5 (0.8±0.4)
Act 3 0.3~2.8 (1.3±0.7) ND~1.9 (0.9±0.4) ND~1.4 (0.7±0.3) 0.1~0.9 (0.6±0.2)
Flu 3 1.6~4.6 (2.7±0.8) 0.6~4.7 (2.4±1.2) 0.8~3.7 (1.9±0.8) 0.6~3.3 (1.7±0.6)
Phe 3 5.5~17.6 (10.8±3.9) 2.5~16.5 (9.9±4.2) 2.9~16.8 (8.5±3.5) 2.0~18.1 (8.6±3.8)
Ant 3 0.6~4.0 (2.1±0.9) 0.5~5.9 (2.4±1.4) 0.6~3.9 (1.8±1.0) 0.5~3.5 (2.1±1.0)
Fla 4 4.2~19.8 (10.7±4.5) 2.7~16.0 (10.3±4.3) 3.9~20.1 (9.8±4.1) 2.5~14.4 (10.0±3.0)
Pyr 4 2.6~16.8 (8.7±4.0) 2.2~14.7 (8.9±3.9) 2.8~20.1 (8.5±4.5) 2.1~13.6 (9.1±2.8)
BaA 4 0.8~7.7 (4.1±2.0) 0.8~4.9 (3.3±1.4) 0.9~6.4 (2.8±1.5) 0.7~6.4 (3.7±1.4)
Chr 4 2.5~17.9 (10.0±4.6) 3.0~17.7 (12.0±4.8) 2.4~16.4 (8.1±3.6) 1.1~11.5 (6.5±2.4)
BbF 5 3.0~13.0 (7.9±3.0) 6.1~29.2 (20.3±8.1) 2.6~15.5 (7.3±3.4) 2.4~13.5 (9.1±2.7)
BkF 5 1.0~14.6 (7.5±3.9) 1.2~10.1 (4.8±2.3) 1.0~7.6 (3.7±1.8) 0.9~6.4 (3.9±1.3)
BaP 5 0.8~10.4 (5.4±2.7) 1.0~9.3 (6.1±2.9) 1.4~15.4 (5.7±3.7) 0.8~11.7 (6.4±2.9)
DBA 5 0.5~3.7 (2.0±0.9) 0.3~2.9 (1.6±0.8) 0.3~3.2 (1.2±0.8) 0.3~2.3 (1.0±0.5)
InP 6 1.3~10.1 (5.4±2.5) 2.0~14.2 (6.7±3.4) 1.7~13.4 (5.5±3.0) 1.0~6.7 (4.2±1.4)
BgP 6 1.9~10.8 (6.4±2.6) 1.7~9.0 (6.0±2.6) 3.3~14.7 (6.6±2.9) 1.3~6.9 (4.9±1.4)

注:“ND”为未检出,括号内为平均值。

1.3 质量控制

采用内标法进行定量,16种PAHs氘代内标为:Nap-d8、Acy-d8、Act-d10、Flu-d10、Phe-d10、Ant-d10、Fla-d10、Pyr-d10、BaA-d12、Chr-d12、BbF-d12、BkF-d12、BaP-d12、DBA-d14、InP-d12、BgP-d12,检出限为0.10 μg·kg-1,定量限为0.40 μg·kg-1。通过全程序空白样品、平行样品、加标样品(实际样品加标)进行质量控制,确保测定的准确、可靠。在全程序空白样品中16种PAHs均未检出,加标样品的回收率为72.3%~114.2%,平行样品的相对偏差均小于20%。

2 结果与分析

2.1 PAHs含量分布及年际变化

2018—2021年调查海域表层沉积物中PAHs总量及各组分结果见表1。除2018年有2个站位的Acy未检出,2019年有1个站位的Act未检出,2020年有4个站位的Nap未检出、2个站位的Acy未检出和1个站位的Act未检出外,其余站位各PAHs组分检出率均为100%。未检出的组分Nap、Acy和Act均为低分子量PAHs。4年中 PAHs含量为16.9~178.0 μg·kg-1,平均值为75.9±24.0~102.6±41.4 μg·kg-1,整体呈下降趋势,但在2019年略有回升。各组分中,Act、Flu的平均值呈逐年下降的趋势,Acy的平均值在2020年有显著升高,Chr、BbF、InP在2019年有明显上升。
绿色石化项目于2017年7月1日开工建设,2019年底一期建成投产。2013年该海区的PAHs为60~100 μg·kg-1[5],该值可以反映项目建设前的本底情况。本次调查中2018年、2019年的数据反映了项目建设期海域PAHs水平,2020年、2021年的数据反映了项目一期投产后海域的PAHs状况。结合项目建设周期分析,建设期沉积物中PAHs略有上升,而投产后2020年、2021年,PAHs略有降低,并且2021年PAHs水平低于2018年,表明项目投产未造成海域沉积物中PAHs的上升。
取本次调查中PAHs平均值最高(2019年)和最低的年份(2021年)数据,与我国其他海域进行对比(表2)。结果显示,本次调查结果与周边海域相比略低,如长江口及浙江近岸海域[5]、舟山海域[7]和台州湾[8];与厦门湾[9]、湄洲湾[10]、环渤海渔港[11]、青岛近海[12]、深圳近岸海域[13]等地相比处于较低水平;与广西三娘湾[14]和南黄海西部[15]等地相比,水平相近;与南海北部[16]相比则处于较高水平。
表2 不同海区表层沉积物中PAHs检出种数和含量的比较

Tab.2 Comparison of species and content of PAHs detected in surface sediments from different sea areas

海区 检出PAHs种数/种 PAHs含量/(μg·kg-1) 数据来源
范围 平均值
绿色石化项目邻近海域 16 27.5~149.0 102.6 本研究2019年
绿色石化项目邻近海域 16 16.9~114.0 75.9 本研究2021年
长江口及浙江近岸海域 16 31.8~384.0 131.1 文献[5]
舟山海域 15 10.5~521.8 138.6 文献[7]
台州湾 15 85.4~167.6 138.6 文献[8]
厦门湾 16 204.0~1 590.5 670.0 文献[9]
湄洲湾 16 196.7~299.7 256.1 文献[10]
环渤海渔港 16 1 092.9~4 196.9 2 642.0 文献[11]
青岛近海 16 255.8~1 884.1 684.8 文献[12]
深圳近岸海域 16 227.5~3 897.4 文献[13]
广西三娘湾 16 37.0~241.8 90.8 文献[14]
南黄海西部 16 19.8~172.0 67.2 文献[15]
南海北部 16 8.6~17.5 10.9 文献[16]
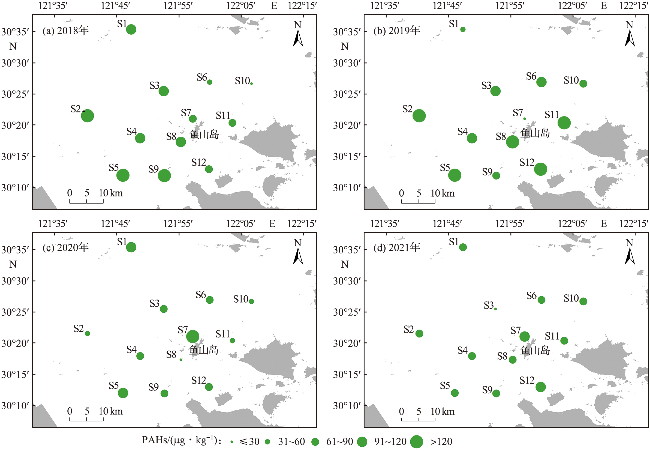
调查海域PAHs的年度空间分布如图2所示。2018年,西南部站位PAHs含量普遍较高。2019年PAHs分布与2018年相似,除了西南部站位普遍较高外,在鱼山岛的东、西、南方向,S11、S8、S12站位的值均略有上升。2020年,鱼山岛北部S7站位PAHs较2018年、2019年有一定升高,而其余大部分站位均有降低趋势。2021年,大部分站位的值低于上一年。整体看来,PAHs在各年度的空间分布虽略有不同,但有两个共同点:一是西南角,如靠近宁波的S5站位,值相对较高;二是东北部站位的PAHs相对较低。其原因可能为西南部离岸较近,受到陆源输入的影响较大,而东北部靠近外海,周边没有明显的污染源。从4年PAHs的分布来看,除了个别站位有升高外,海域整体呈下降趋势。
图2 表层沉积物中PAHs含量分布

Fig.2 Distribution of PAHs content in surface sediments

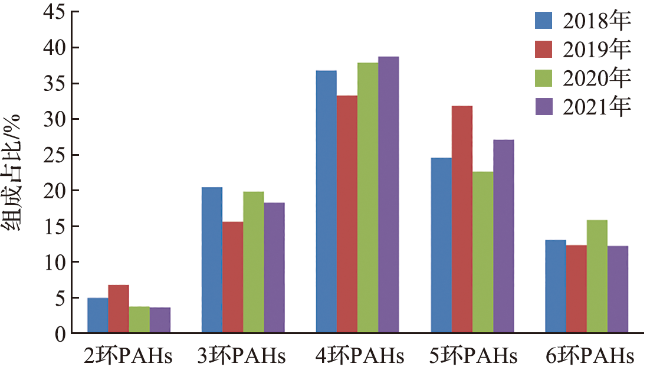
不同苯环数PAHs的年际组成变化如图3所示。占比最高的为4环PAHs,其次为5环PAHs,2环PAHs最低,各年比例基本一致,以4环、5环等中、高分子量PAHs为主。
图3 不同环数PAHs的年际变化

Fig.3 Interannual changes of PAHs with different ring numbers

2.2 海域沉积环境及与PAHs的相关性
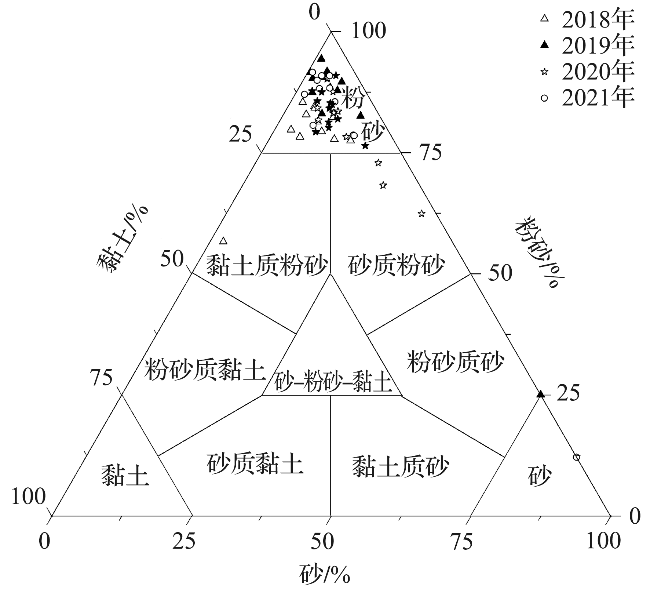
表3列出了2018—2021年绿色石化项目邻近海域表层沉积物的组成类型、平均粒径和有机碳含量。其中组成类型以粉砂占比最大,均值在80%左右,各年较稳定。2018—2021年沉积物平均粒径为3.10 Ф~7.44 Ф,其中,2018年沉积物粒径相对较细,而其他3年的差异较小,略粗于2018年。根据砂、粉砂和黏土的百分含量,采用福克-沃克三角图解法(图4),可将调查海域沉积物划分为砂、粉砂质砂、砂质粉砂、粉砂、黏土质粉砂等5类。总体上,粒级组成以粉砂为主,沉积物集中分布在三角图上方;黏土占比相对较小,仅有2018年的1个站位黏土含量达到41.0%,其余年份各站位含量均低于20.0%。
表3 表层沉积物组成类型、平均粒径及有机碳含量

Tab.3 Type composition, average particle size and organic carbon content of surface sediments

年份 砂/% 粉砂/% 黏土/% 平均粒径Ф 有机碳/%
2018年 2.2~14.7(6.4±3.9) 56.7~85.5(79.2±7.6) 7.8~41.0(14.4±8.8) 5.57~7.44(6.17±0.52) 0.36~0.81(0.58±0.12)
2019年 0.4~75.0(10.7±20.6) 25.0~94.6(83.6±18.8) 0.0~9.9(5.7±2.9) 3.25~6.45(5.79±0.86) 0.14~0.56(0.44±0.12)
2020年 4.1~34.1(12.3±9.5) 63.3~90.4(80.7±8.4) 2.7~11.4(7.0±2.4) 4.62~6.18(5.66±0.45) 0.42~0.66(0.55±0.07)
2021年 0.9~87.8(12.7±24.1) 12.2~91.6(80.3±21.9) 0.0~12.7(7.0±3.1) 3.10~6.38(5.84±0.89) 0.33~0.61(0.49±0.10)

注:括号内为平均值。

图4 沉积物类型

Fig.4 Sediment types

2018—2021年,绿色石化项目邻近海域表层沉积物中有机碳含量为0.14%~0.81%,总体含量较低,平均值与已报道的东海有机碳值(0.54%)[17]接近。
多环芳烃在沉积物中的分布受到多因素的影响,如沉积物中有机碳在其吸附和运移过程中起着重要的作用[18],其中对高分子量PAHs(HMW)的吸附强于低分子量PAHs(LMW)[5,9,19]。一些研究表明,沉积物中PAHs与有机碳和粒度之间有明显的线性关系。对调查海域PAHs和LMW、HMW、有机碳、沉积物粒度(Ф)进行了相关性分析,结果显示沉积物中PAHs与有机碳、粒度没有明显的相关关系(表5),表明调查海域沉积物中PAHs分布受到多种因素的影响。
表4 沉积物中PAHs含量与影响因子间的相关系数

Tab.4 Correlations coefficient between PAHs content and its influencing factors in surface sediments

项目 PAHs LMW HMW 有机碳 粒度
PAHs 1.00
LMW 0.87* 1.00
HMW 0.98* 0.77* 1.00
有机碳 0.14 0.18 0.12 1.00
粒度 0.04 0.09 0.02 0.38* 1.00

注:LMW为低分子量PAHs,HMW为高分子量PAHs。*表示p≤0.05。

2.3 PAHs来源解析

环境中PAHs来源十分广泛,主要分为自然源和人为源[20-21]。人为源被认为是环境中PAHs的主要来源,主要产生于石油的运输、加工,生物质、化石燃料及副产品的高温燃烧[22]。PAHs来源的识别对环境污染控制具有重要的意义。
通过PAHs化学结构中苯环的个数及分子量大小,可以初步判断其来源。当PAHs组成以LMW占优势时,其来源以石油泄漏为主;当PAHs组成以HMW为主时,其来源以各种物质的高温燃烧释放为主[14]。本次调查中,HMW明显高于LMW,反映出调查海域沉积物PAHs主要来源于燃烧。
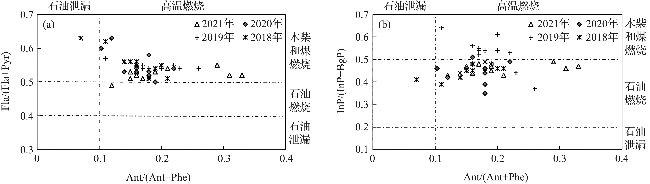
进一步通过3对同分异构体比值判别PAHs的来源。Ant/(Ant+Phe)比值大于0.1指示为燃烧源,小于0.1指示为石油泄漏;Fla/(Fla+Pyr)、InP/(InP+BgP)比值分别小于0.4和0.2时指示为石油泄漏,两者比值分别在0.4~0.5和0.2~0.5时指示为石油燃烧源,大于0.5时指示为木柴和煤燃烧源[5,22-24]图5a中Ant/(Ant+Phe) 的比值显示,除2018年有1个站位小于0.1外,其余值均大于0.1,表明PAHs主要来源于高温燃烧。Fla/(Fla+Pyr)比值均大于0.4,表明PAHs来源于各种物质的燃烧,其中,仅2021年1个站位的值介于0.4~0.5,其余均大于0.5,表明其主要来源于木柴和煤的燃烧。图5b中,InP/(InP+BgP)的比值均大于0.2,表明PAHs均来源于各种物质的燃烧,其中仅2019年和2020年的小部分值显示为木柴和煤燃烧源,其余大部分显示为石油燃烧源。综合3对同分异构体比值可知,调查海域PAHs主要来源于燃烧,是石油、木柴、煤等多种物质燃烧的混合产物,这与依据PAHs苯环个数及分子量的判定一致,与文献[5]的结果也一致。
图5 表层沉积物PAHs来源分析

Fig.5 Sources analysis of PAHs in surface sediments

另外,在PAHs迁移过程中BaA相比其同分异构体Chr更容易发生光降解,BaA/Chr比值越小,表明其光降解程度越高,迁移距离越远[16]。本次调查中BaA/Chr比值较小,为0.27~0.57,均值为0.40,表明调查海域的PAHs来源于远距离的输入,而非周边石化项目。

2.4 PAHs风险评价

沉积物PAHs的风险评价对生态环境管理具有重要的意义。应用沉积物质量基准法,通过风险效应低值(effects range low, ERL)和风险效应高值(effects range median, ERM)指标[25](表5),对环境中PAHs的风险水平进行评价。若PAHs含量小于ERL,表明其产生负面生态效应的可能性较小;若PAHs的含量在ERL和ERM之间,表明其有潜在的生态风险;若PAHs的含量大于ERM,表明其可能产生严重的生态风险。对比表1表5可以发现,12种PAHs组分含量均低于ERL值,表明调查海域表层沉积物中PAHs的生态风险水平较低。
表5 沉积物中PAHs的质量评价基准[25]

Tab.5 Criteria for the quality assessment of PAHs in sediment[25]单位:μg·kg-1

项目 Nap Acy Act Flu Phe Ant Fla Pyr Chr BaA BaP DBA
ERL 160 16 44 19 240 85.3 600 665 384 261 430 63.4
ERM 2 100 500 640 540 1 500 1 100 5 100 2 600 2 800 1 600 1 600 260

注:ERL表示风险效应低值,ERM表示风险效应高值。

还有一些PAHs组分在表5中未列出,其只要存在于环境中就会产生毒副作用[16],如BbF、BkF、InP和BgP。在本次调查中,这些组分均有检出,应该引起关注。

3 结论

基于前期研究及4年调查数据,比较了沉积物中PAHs的分布及年际变化,得到如下结论。
1)2018—2021年绿色石化项目邻近海域表层沉积物中PAHs含量为16.9~178.0 μg·kg-1,平均值为75.9±24.0~102.6±41.4 μg·kg-1,从建设到投产的4年来PAHs整体呈下降趋势。与国内其他海区相比,调查海域PAHs处于较低水平。
2)绿色石化项目邻近海域表层沉积物中各年PAHs组成占比为4环PAHs>5环PAHs>3环PAHs>6环PAHs>2环PAHs,各年PAHs来源相对稳定,主要来源于石油、木柴、煤等燃烧产物的远距离迁移。
3)目前调查海域表层沉积物中PAHs的生态风险水平较低,但随着项目运营,其周边生态环境状况需要长期关注。
[1]
CHIOU C T, MCGRODDY S E, KILE D E. Partition characteristics of polycyclic aromatic hydrocarbons on soils and sediments[J]. Environmental Science & Technology, 1998, 32(2): 264-269.

DOI

[2]
MAI B X, QI S H, ZENG E Y, et al. Distribution of polycyclic aromatic hydrocarbons in the coastal region off Macao, China: Assessment of input sources and transport pathways using compositional analysis[J]. Environmental Science & Technology, 2003, 37(21): 4855-4863.

DOI

[3]
SHI Z, TAO S, PAN B, et al. Partitioning and source diagnostics of polycyclic aromatic hydrocarbons in rivers in Tianjin, China[J]. Environmental Pollution, 2007, 146(2): 492-500.

PMID

[4]
冉丽君, 蔡梅. 石化行业建设项目环评管理发展历程及趋势[J]. 环境影响评价, 2023, 45(1):20-25.

RAN L J, CAI M. Development process and trend of EIA management of construction projects in petrochemical industry[J]. Environmental Impact Assessment, 2023, 45(1): 20-25.

[5]
母清林, 方杰, 邵君波, 等. 长江口及浙江近岸海域表层沉积物中多环芳烃分布、来源与风险评价[J]. 环境科学, 2015, 36(3):839-846.

MU Q L, FANG J, SHAO J B, et al. Distribution, sources and risk assessment of polycyclic aromatic hydrocarbons(PAHs) in surface sediments of Yangtze Estuary and Zhejiang coastal areas[J]. Environmental Science, 2015, 36(3): 839-846.

[6]
中华人民共和国环境保护部. 土壤和沉积物多环芳烃的测定气相色谱-质谱法: HJ 805—2016[S]. 北京: 中国环境科学出版社, 2016.

Ministry of Environmental Protection of the People’s Republic of China. Soil and Sediment-Determination of polycyclic aromatic hydrocarbon by Gas chromatography-Mass Spectrometry Method: HJ 805—2016[S]. Beijing: China Environmental Science Press, 2016.

[7]
李鹏辉, 林嫣, 柯宏伟. 舟山海域沉积物中多环芳烃的分布及来源[J]. 厦门大学学报:自然科学版, 2020, 59(S1):124-127.

LI P H, LIN Y, KE H W. Distribution and sources of polycyclic aromatic hydrocarbons in surface sediments in the Zhoushan Sea area[J]. Journal of Xiamen University: Natural Science, 2020, 59(S1): 124-127.

[8]
江锦花. 台州湾海域表层沉积物中多环芳烃的浓度水平、富集规律及来源[J]. 海洋通报, 2007, 26(4):85-90.

JIANG J H. Concentration, accumulation and sources of polycyclic aromatic hydrocarbons in surface sediments in Taizhou Bay[J]. Marine Science Bulletin, 2007, 26(4): 85-90.

[9]
李庆召, 李国新, 罗专溪, 等. 厦门湾海域表层沉积物重金属和多环芳烃污染特征及生态风险评价[J]. 环境化学, 2009, 28(6):869-875.

LI Q Z, LI G X, LUO Z X, et al. Pollution characteristics and ecological risk assessment of heavy metals and polycyclic aromatic hydrocarbons(PAHs) in sediment from Xiamen Bay[J]. Environmental Chemistry, 2009, 28(6): 869-875.

[10]
林建清, 王新红, 洪华生, 等. 湄洲湾表层沉积物中多环芳烃的含量分布及来源分析[J]. 厦门大学学报:自然科学版, 2003, 42(5):633-638.

LIN J Q, WANG X H, HONG H S, et al. PAHs’ distribution and source analysis in surface sediments of the Meizhou Bay[J]. Journal of Xiamen University: Natural Science, 2003, 42(5): 633-638.

[11]
张文博, 刘宾绪, 江涛, 等. 环渤海渔港沉积物多环芳烃的污染特征和生态风险评价[J]. 环境化学, 2022, 41(2):561-571.

ZHANG W B, LIU B X, JIANG T, et al. Pollution characteristics and ecological risk assessment of polycyclic aromatic hydrocarbons in sediments from fishing ports along the coast of Bohai Sea[J]. Environmental Chemistry, 2022, 41(2): 561-571.

[12]
王江涛, 谭丽菊, 张文浩, 等. 青岛近海沉积物中多环芳烃、多氯联苯和有机氯农药的含量和分布特征[J]. 环境科学, 2010, 31(11):2713-2722.

WANG J T, TAN L J, ZHANG W H, et al. Concentrations and distribution characteristic of PAHs, PCBs and OCPs in the surface sediments of Qingdao coastal area[J]. Environmental Science, 2010, 31(11): 2713-2722.

[13]
唐俊逸, 刘晓东, 周连宁, 等. 深圳近岸海域表层沉积物中多环芳烃(PAHs)的风险评估研究[J]. 海洋环境科学, 2017, 36(6):838-843.

TANG J Y, LIU X D, ZHOU L N, et al. Risk assessment research of polycyclic aromatic hydrocarbons in marine surface sediments of Shenzhen nearshore[J]. Marine Environmental Science, 2017, 36(6): 838-843.

[14]
庞国涛, 阎琨, 李伟. 广西三娘湾海域表层沉积物多环芳烃特征及风险评价[J]. 中国地质调查, 2021, 8(5):95-100.

PANG G T, YAN K, LI W. Characters and risk assessment of hydrocarbons in surface sediments of Sanniang Bay in Guangxi Province[J]. Geological Survey of China, 2021, 8(5): 95-100.

[15]
邹伟明, 母清林, 黄家海, 等. 南黄海西部表层沉积物中多环芳烃分布特征[J]. 环境科学与技术, 2015, 38(7):53-57,76.

ZOU W M, MU Q L, HUANG J H, et al. Distribution of polycyclic aromatic hydrocarbons in surface sediments of the western South Yellow Sea[J]. Environmental Science & Technology, 2015, 38(7): 53-57, 76.

[16]
高苑, 夏嘉, 司徒嘉杰, 等. 南海北部近海柱状沉积物多环芳烃组成及来源分析[J]. 广东海洋大学学报, 2021, 41(2):111-116.

GAO Y, XIA J, SITU J J, et al. Composition and source analysis of polycyclic aromatic hydrocarbons in columnar sediments in the northern South China Sea[J]. Journal of Guangdong Ocean University, 2021, 41(2): 111-116.

[17]
邹景忠. 海洋环境科学[M]. 济南: 山东教育出版社, 2004:147.

ZOU J Z. Marine environmental science[M]. Ji’nan: Shandong Education Press, 2004: 147.

[18]
MOON J W, GOLTZ M N, AHN K H, et al. Dissolved organic matter effects on the performance of a barrier to polycyclic aromatic hydrocarbon transport by groundwater[J]. Journal of Contaminant Hydrology, 2003, 60(3/4): 307-326.

DOI

[19]
赵健, 周怀东, 富国, 等. 河北西大洋水库沉积物中多环芳烃的分布、来源及生态风险评价[J]. 湖泊科学, 2011, 23(5):701-707.

ZHAO J, ZHOU H D, FU G, et al. Distributions, sources and ecological risk assessment of polycyclic aromatic hydrocarbons in sediments from Xidayang Reservoir, Hebei Province[J]. Journal of Lake Sciences, 2011, 23(5): 701-707.

DOI

[20]
徐红, 汪青, 华德武, 等. 芜湖市沉积物-水体PAHs扩散行为研究[J]. 中国环境科学, 2018, 38(8):3094-3103.

XU H, WANG Q, HUA D W, et al. Sediment-water diffusion of PAHs in Wuhu city, China[J]. China Environmental Science, 2018, 38(8): 3094-3103.

[21]
昌盛, 耿梦娇, 刘琰, 等. 滹沱河冲洪积扇地下水中多环芳烃的污染特征[J]. 中国环境科学, 2016, 36(7):2058-2066.

CHANG S, GENG M J, LIU Y, et al. Pollution characteristic of polycyclic aromatic hydrocarbons in the groundwater of Hutuo River Pluvial Fan[J]. China Environmental Science, 2016, 36(7): 2058-2066.

[22]
LATIMER J S, ZHENG J S. The sources, transport, and fate of PAHs in the marine environment[M]//DOUBEN P E T. PAHs:An ecotoxicological perspective. Chichester, UK: John Wiley & Sons, Ltd, 2003: 7-33.

[23]
WANG X C, SUN S, MA H Q, et al. Sources and distribution of aliphatic and polyaromatic hydrocarbons in sediments of Jiaozhou Bay, Qingdao, China[J]. Marine Pollution Bulletin, 2006, 52(2): 129-138.

DOI

[24]
YUNKER M B, MACDONALD R W, VINGARZAN R, et al. PAHs in the Fraser River Basin: A critical appraisal of PAH ratios as indicators of PAH source and composition[J]. Organic Geochemistry, 2002, 33(4): 489-515.

DOI

[25]
LONG E R, MACDONALD D D, SMITH S L, et al. Incidence of adverse biological effects within ranges of chemical concentrations in marine and estuarine sediments[J]. Environmental Management, 1995, 19(1): 81-97.

DOI

Outlines

/