
0 引言
1 材料与方法
1.1 研究海域
1.2 数据来源
1.2.1 BGC-Argo浮标数据
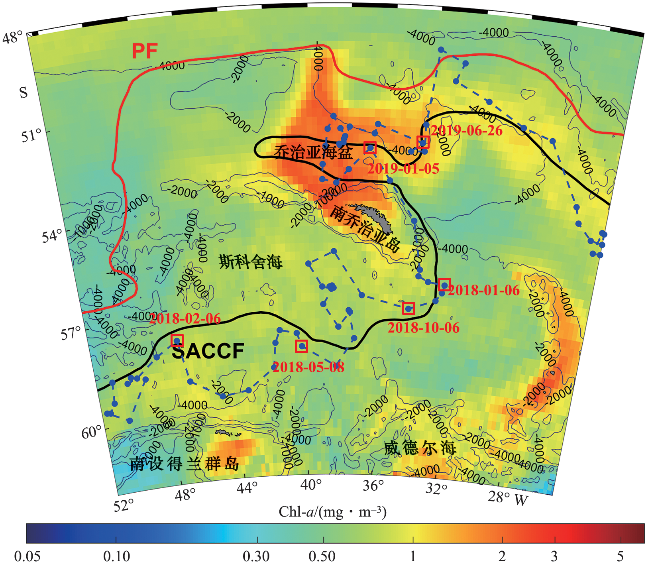
图1 研究海域及BGC-Argo的移动轨迹(图中等值线表示水深,单位:m;蓝色点表示浮标剖面站点;黑粗线和红粗线分别为南极绕极流南锋(SACCF)和极锋(PF);色标采用对数处理,颜色反映1997年至2017年南半球12月至次年2月气候态Chl-a分布,数据来自欧洲航天局GlobColour项目的多元数据融合产品,空间分辨率为25 km×25 km,时间分辨率为1个月。) Fig.1 Study area and the movement trajectory of BGC-Argo floats (Contour lines represent water depth, unit: m. Blue dots represent the profiling float stations. The thick black line and red line indicate the southern Antarctic circumpolar current front (SACCF) and polar front (PF), respectively. Color bar uses log transformation, and the color represents the climatological distribution of Chl-a from December to February in the southern hemisphere from 1997 to 2017. The data are from the multi-sensor merged product of the European Space Agency’s GlobColour project with a spatial resolution of 25 km × 25 km and a temporal resolution of 1 month.) |
1.2.2 卫星遥感数据
1.3 数据处理
1.3.1 硝酸盐季节性消耗与POC输出通量
表1 基于BGC-Argo的夏季平均混合层深度、POC储量、NCP和POC输出通量Tab.1 Summer mean values of MLD, POC storage, NCP, and POC export flux based on BGC-Argo |
| 年份 | 位置 | 混合层深度/m | POC储量/(mmol·m-2) | NCP/(mmol·m-2) | POC输出通量/(mmol·m-2·d-1) |
|---|---|---|---|---|---|
| 2017/2018 | 南极半岛东北部海域 | 38.49±18.93 | 610.32±124.83 | 3 976.14±124.53 | 7.12±3.90 |
| 2018/2019 | 乔治亚海盆 | 62.40±24.55 | 691.62±158.92 | 4 591.86±316.12 | 45.29±5.40 |
1.3.2 卫星遥感数据与BGC-Argo数据匹配
1.3.3 混合层深度计算
2 结果
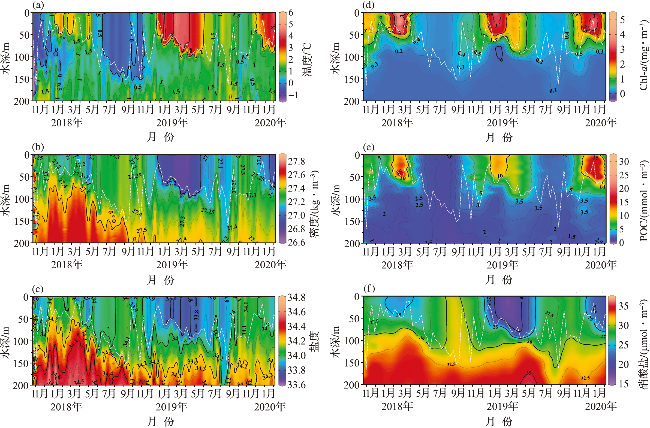
2.1 生化参数的时空分布
2.2 卫星遥感与BGC-Argo观测的Chl-a差异
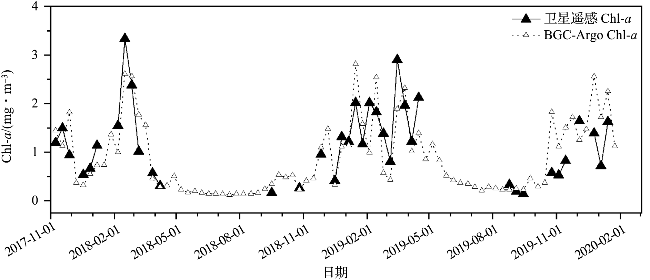
图3 卫星遥感和BGC-Argo获取的表层Chl-a质量浓度时间序列对比Fig.3 Comparison of time series of Chl-a mass concentration observed by remote sensing and BGC-Argo |
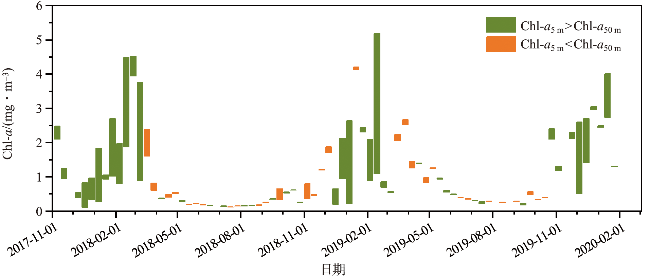
图4 BGC-Argo观测到5 m和50 m处Chl-a质量浓度差异的浮动柱状图(柱形顶部和底部分别表示Chl-a5 m和Chl-a50 m,绿色柱形表示Chl-a5 m大于Chl-a50 m,橙色反之,柱长表示二者的差异。) Fig.4 Floating bar chart of the difference in Chl-a mass concentration between 5 m and 50 m observed by BGC-Argo (The top and bottom of the bars represent Chl-a5 m or Chl-a50 m respectively. Green bars indicate that Chl-a5 m is higher than Chl-a50 m, while orange bars indicate the opposite, and the length of the bars represents the difference.) |
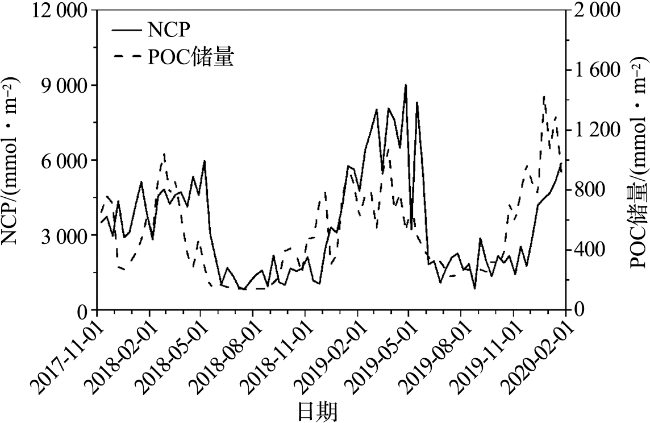
2.3 NCP与POC输出通量
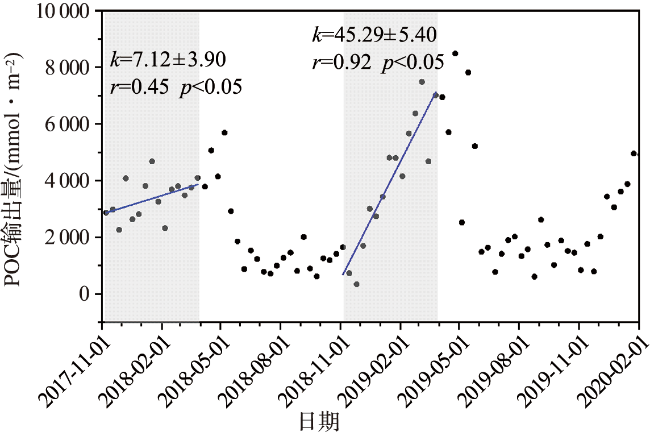
图6 南乔治亚岛附近海域POC输出量时间序列变化(阴影部分表示2017/2018年和2018/2019年夏季;趋势线分别为两个夏季POC输出量相对时间的变化趋势。) Fig.6 Time series of POC export in the waters near South Georgia Island (The shaded area represents the summer seasons of 2017/2018 and 2018/2019; the trend line shows the temporal variation of POC export) |