
0 引言
鸢乌贼(Sthenoteuthis oualaniensis)隶属头足纲(Cephalopoda),枪形目(Idiosepiida),柔鱼科(Ommas-trephidae),鸢乌贼属(Sthenoteuthis),广泛分布在印度洋、太平洋的赤道和亚热带等海域[1],具有生命周期短、繁殖力强和产量高等特点[2]。在我国南海,鸢乌贼年可捕量为130万~200万t,是灯光罩网渔船捕捞的重要经济种类之一[3-4]。目前我国鸢乌贼资源处于未开发状态,年捕捞量远小于年可捕量,开发潜力巨大。招春旭等[5]研究发现,海表温度(sea surface temperature,SST)变化可能引起鸢乌贼栖息水层的变化,从而影响鸢乌贼群体的分布。郭有俊等[6]研究发现,温跃层、SST、海平面高度异常以及涡旋等可能影响海南东南部海域春季鸢乌贼的单位捕捞努力量渔获量(catch per unit effort,CPUE)。余景等[7]研究发现春季西沙-中沙海域,SST为27~28.5℃,叶绿素a质量浓度为0.11~0.13 mg/m3,是鸢乌贼资源量分布的高值区。
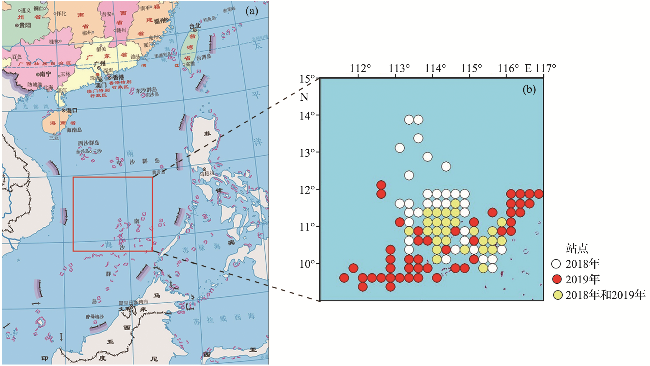
南沙海域位于南海南部,生物资源丰富,是鸢乌贼的主要渔场之一[14]。本文分析了南沙海域SST的时空变化特征及其对鸢乌贼资源变动的影响。
1 材料与方法
1.1 数据来源
鸢乌贼捕捞数据来源于广州远洋渔业有限公司两艘规模相同的灯光罩网渔船——“粤穗渔30033”和“粤穗渔30035”。渔船长55 m,主机功率622 kW,净高90 m,每船配置700盏捕鱼灯(功率为1 kW /盏)。捕捞数据包含每网的作业时间、地点(经度和纬度)以及鸢乌贼的渔获量,时间为2018年1月至2019年12月(2019年1月因渔船维修,无数据),共作业143 d,下网2 301次。数据的空间范围为9.4°N—14.0°N,111.5°E—116.8°E,分辨率为0.25°×0.25°。
SST数据来源于美国国家海洋和大气管理局(National Oceanic and Atmospheric Administration,NOAA, https://oceanwatch.pifsc.noaa.gov),单位是℃,空间范围为8.025°N—13.975°N,111.025°E—116.975°E,分辨率为0.25°×0.25°。2018年1月至2019年12月的数据分辨率为1 d, 2010年1月至2020年12月的数据分辨率为30 d。海洋尼诺指数(Oceanic Niño Index,ONI)下载自NOAA网站 (https://psl.noaa.gov/data/correlation/nina34.anom.data)。
1.2 数据分析与处理
利用Python 3.11.5,对南沙海域2010—2020年SST进行经验正交函数(empirical orthogonal function,EOF)分解,提取SST的主要变化特征。采用ONI判定厄尔尼诺和拉尼娜现象,当Niño3.4区海表温度异常(sea surface temperature anomaly, SSTA)连续5个月的滑动平均值(即ONI)超过0.5℃,判定海域发生了厄尔尼诺;当Niño3.4区SSTA连续5个月的滑动平均值低于-0.5℃,判定海域发生了拉尼娜[15]。
将研究区划分成0.25°×0.25°网格,计算每个网格内鸢乌贼的单位捕捞努力量渔获量(CPUE),公式为
CPUE=Y/N
式中:Y为网格内鸢乌贼的捕捞量,N表示网格内的总下网次数。
通过渔场重心指标描述渔场分布的时空变化,公式如下[16]:
式中:X和Y分别为渔场重心的经度和纬度;Xi和Yi分别为渔区i中心点的经度和纬度;Ci为鸢乌贼在渔区i的CPUE;k为总渔区数,即网格数。
log(CPUE)=s(mon)+s(SST)+s(lat)+s(lon)
式中:s()为平滑函数,用于捕捉数据间的非线性关系;mon表示月份,SST表示海表温度,lat表示纬度,lon表示经度。
最优模型的选择通过赤池信息准则(Akaike infor-mation criterion, AIC)判定,AIC值越小,表示模型拟合度越高。GAM构建和检验通过R4.0.5软件实现。
2 结果
2.1 南沙海域SST变化
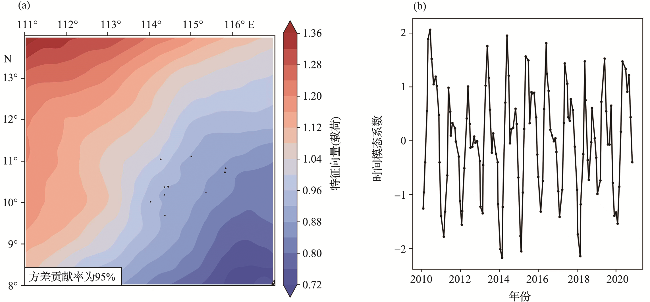
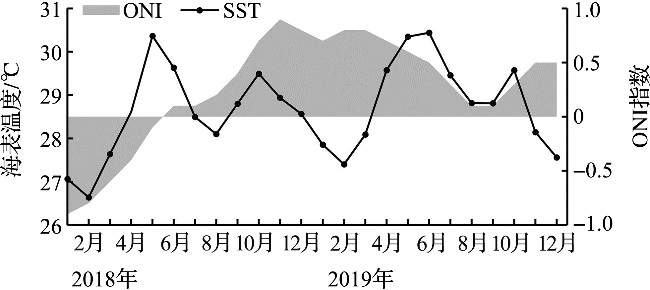
图3为南沙海域SST在2018—2019年的逐月变化:2月起,SST逐渐升高,至5月或6月达到第一个峰值,之后SST下降,至8月或9月小幅回升,于10月达到第二个峰值,之后下降,2月SST为全年最低。2019年月平均SST普遍高于2018年,年平均SST比2018年高0.3℃,并且第一峰值和回温时间均较2018年晚1个月,变化幅度也小于2018年。ONI指数显示2019年该海域发生了厄尔尼诺。
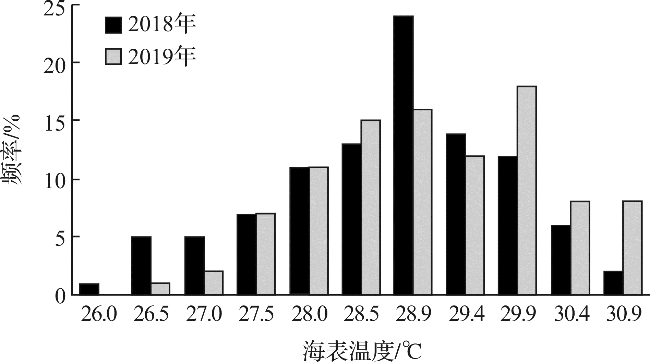
SST数据频率分布(图4)显示,2018年出现频率最大的SST为28.9℃;2019年出现频率最大为29.9℃,其次为28.9℃,高温(>29.9℃)出现频率明显高于2018年。
2.2 南沙海域鸢乌贼CPUE月变化
图5为鸢乌贼CPUE的逐月变化。除了2月与7月外,其余各月CPUE均为2018年远高于2019年。2018年1—4月,鸢乌贼CPUE逐月增加,4月达到317.13 kg/网后下降,6月出现谷值,仅为57.74 kg/网,8月达到全年峰值,为511.52 kg/网,9—12月, CPUE波动较小,保持在119.21~235.94 kg/网。2019年CPUE峰值出现在2月,为492.92 kg/网,谷值出现在6月,仅2.5 kg/网,7—10月持续下降,11月略有回升,达到167.14 kg/网,12月CPUE再次下降。
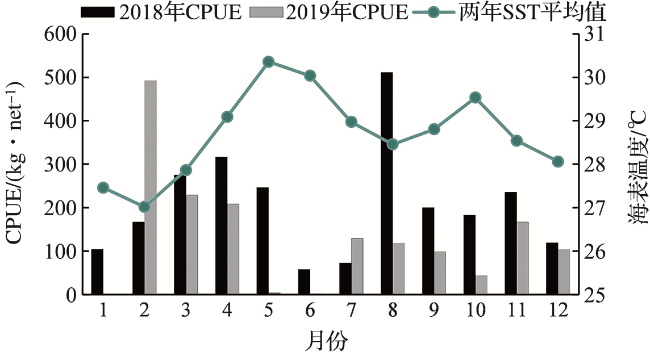
图6显示了南沙海域鸢乌贼渔场重心在2018年、2019年各月的分布。2018年1—2月,渔场重心在11.6°N—11.9°N,113.7°E—114.0°E海域;3—5月,渔场重心向东、向南移动,东至115.3°E,南至10.4°N;6—12月,渔场重心整体向西移动,其中6—7月、11—12月小幅向东移动,8—10月大幅向北移动,10—11月大幅向西、向南移动; 10—12月鸢乌贼的渔场分布重心回到11.0°N—11.5°N,113.5°E—114.0°E,即1—2月分布位置附近。
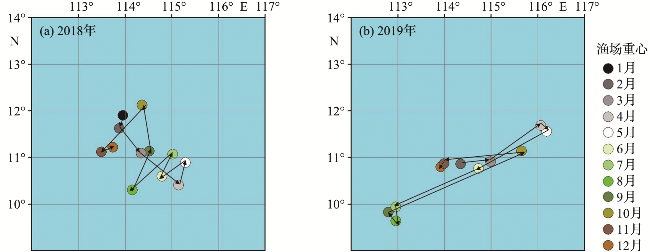
2019年各月鸢乌贼的渔场重心沿NE—SW方向变化。2月渔场重心在10.9°N,114.4°E附近;3—5月向东移动,6—9月,渔场重心西移,其中6—7月西移幅度最大;9—10月,重心大幅度东移;10月渔场重心向西移动至10.8°N—10.9°N,113.9°E—114.0°E附近海域,于11月再次回归至年初位置。2019年鸢乌贼CPUE分布重心在纬度上变化较小,主要在9.7°N—11.7°N之间。
2.3 鸢乌贼CPUE与环境因子关系分析
表1 GAM模型的统计参数Tab.1 Statistical parameters of different GAM models |
| 模型 | AIC | 偏差解释度/% | 决定系数R2 |
|---|---|---|---|
| 模型1 | 650.714 | 37.6 | 0.35 |
| 模型2 | 611.052 | 51.6 | 0.48 |
| 模型3 | 608.688 | 53.9 | 0.49 |
| 模型4 | 608.285 | 55.0 | 0.50 |
注:模型1:log(CPUE)~s(month) 模型2:log(CPUE)~s(month)+ s(SST) 模型3:log(CPUE)~s(month)+s(SST)+s(latitude) 模型4:log(CPUE)~s(month)+s(SST)+s(latitude)+s(longitude) |
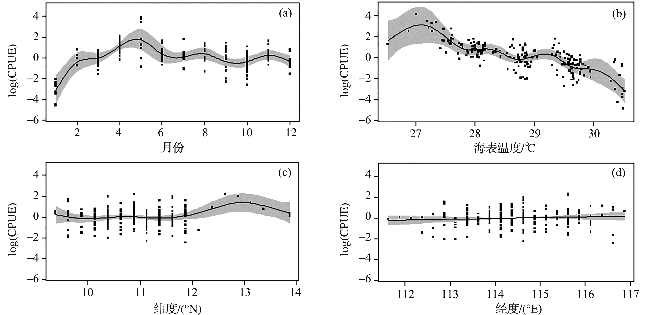
图7 环境变量对南沙海域鸢乌贼CPUE的影响(阴影部分表示置信区间,实线表示解释变量对鸢乌贼CPUE的平滑拟合。) Fig.7 Effects of environmental variables on the CPUE of S.oualaniensis in Nansha sea area (The shadow part represents confidence interval, and the solid line represents the smooth fit of the explanatory variables to the CPUE of S. oualaniensis.) |
3 讨论
3.1 鸢乌贼CPUE的时空变化
3.2 南沙海域SST时空变化及其与鸢乌贼CPUE的关系
SST影响海洋生物分布,如刘杉等[24]研究海表面温度变化下秘鲁外海茎柔鱼栖息地的时空变动发现, SST上升剧烈时会直接影响茎柔鱼栖息地面积。本研究中2019年南沙海域鸢乌贼CPUE远低于2018年,可能与2019年发生了厄尔尼诺,年均SST较2018年上升了0.3℃,高温(29.5℃以上)频率升高,SST不适于鸢乌贼生活有关。周甦芳[21]研究发现厄尔尼诺引起的温度上升会导致鲣渔获量下降;招春旭等[5]研究发现厄尔尼诺导致的海水增温会直接或间接影响鸢乌贼资源量;余景等[7]的研究表明西沙-中沙海域2008年春季鸢乌贼资源量的较大波动与同期发生的拉尼娜事件有关;陈杭徽等[25]研究表明超强厄尔尼诺事件的发生会导致西北太平洋海域柔鱼的资源量骤减。上述研究均表明厄尔尼诺引起海域SST变化,进而引发当地渔业资源量波动。
4 结论
本研究通过南沙海域SST与2018—2019年鸢乌贼渔获数据分析了南沙海域鸢乌贼CPUE与环境因子之间的关系,得到以下结论。
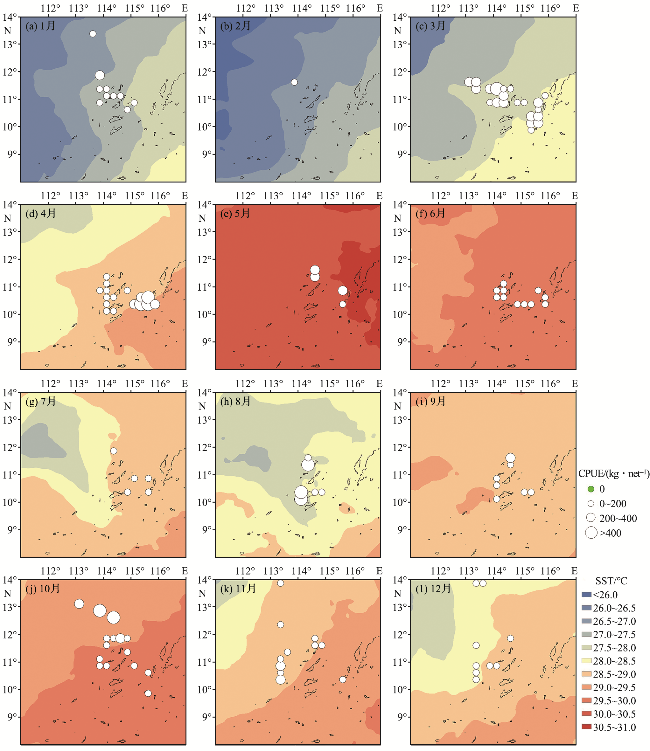
1)受太阳辐射周期变化影响,南沙海域SST呈明显的季节变化,SST月平均变化呈双峰型,峰值在春季和秋季。SST多年平均等值线呈NW—SE向带状分布,随着纬度降低,温差变小。
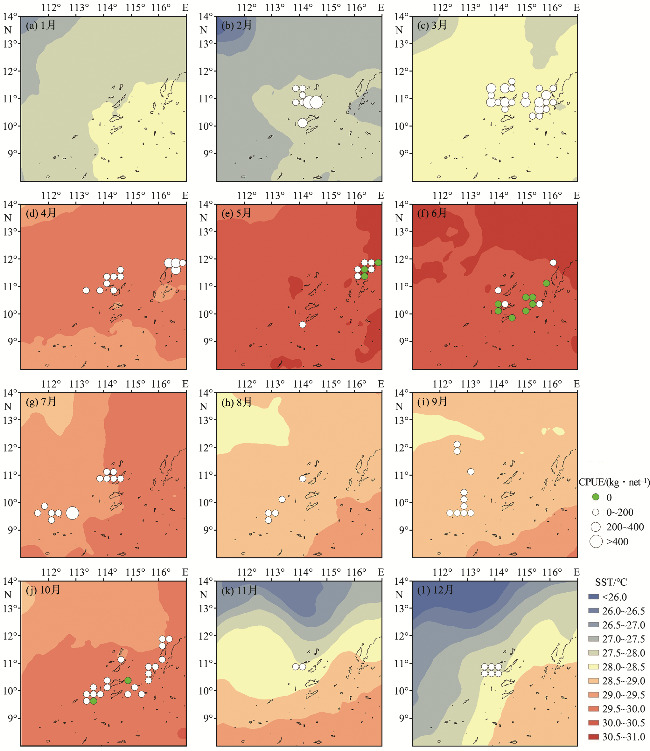
2)南沙海域鸢乌贼CPUE具明显季节特征,春季高,夏季低。鸢乌贼主要分布在10°N—12°N,113°E—116°E,鸢乌贼渔场重心移动与SST变化有关,表现为低温时东移,高温时西移。
3)南沙海域鸢乌贼分布的适宜温度为27.5~29.5℃,SST超过29.5℃时,海域鸢乌贼的CPUE降低。夏季海域SST普遍高于29.5℃,该季节鸢乌贼CPUE在全年中较低。厄尔尼诺使海域SST高值频率增加,导致2019年CPUE低于2018年。