
0 引言
1 研究区、数据与方法
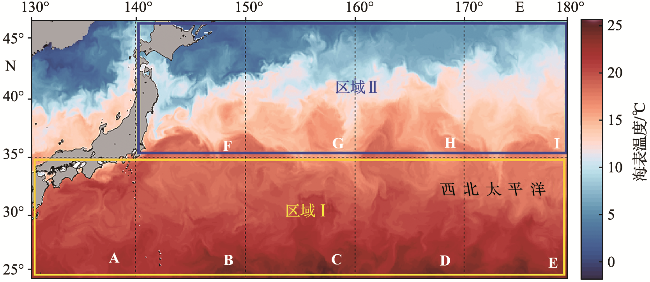
1.1 研究区
1.2 数据来源与处理
1.2.1 AVISO卫星高度计资料
1.2.2 Argo资料及处理
1.2.3 CARS09气候态资料及处理
1.3 研究方法
1.3.1 涡旋自动探测
1.3.2 数据匹配
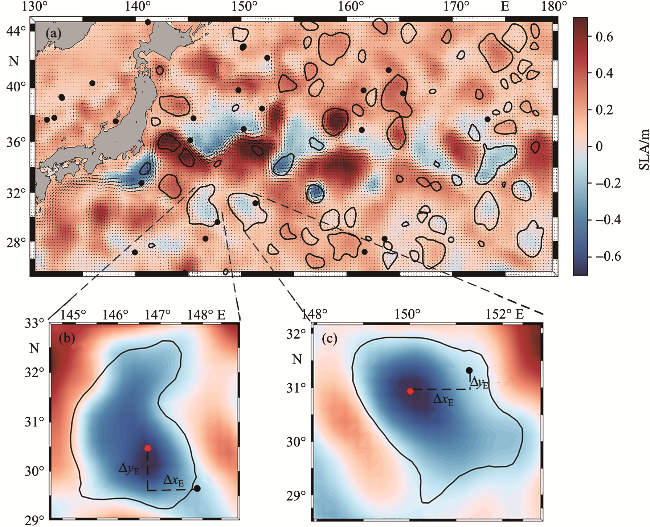
图2 西北太平洋海表高度异常与涡旋的分布(2015-10-18)(图b表示Argo浮标位于涡旋外;图c表示Argo浮标位于涡旋内部;闭合曲线代表涡旋边界;红点代表涡旋中心;黑点代表Argo浮标位置;ΔxE代表Argo浮标到涡心的经向距离,ΔyE代表纬向距离。) Fig.2 The distribution of SLA and eddy in the Northwest Pacific Ocean (2015-10-18) (Figure b shows that Argo buoy is located outside the eddy; Figure c shows that Argo buoy is located inside the eddy; the closed curve represents the eddy boundary; red dot represents the center of the eddy; the black dot represents the Argo buoy location; the ΔxE represents the meridional distance from Argo buoy to the eddy center, and the ΔyE represents the zonal distance.) |
表1 西北太平洋9个子区域内符合匹配条件的Argo剖面数据Tab.1 Number of Argo profiles conforming to the matching conditions in 9 subregions of the Northwest Pacific Ocean |
| 区域 | 子区域 | Argo剖面资料数量 | |
|---|---|---|---|
| 与暖涡匹配/条 | 与冷涡匹配/条 | ||
| 区域Ⅰ 黑潮延伸体 | A | 736 | 494 |
| B | 736 | 388 | |
| C | 376 | 354 | |
| D | 309 | 229 | |
| E | 287 | 259 | |
| 区域Ⅱ 亲潮延伸体 | F | 280 | 413 |
| G | 509 | 302 | |
| H | 267 | 222 | |
| I | 147 | 105 | |
1.3.3 涡旋三维合成
1.3.4 射线声学模型
2 涡旋结构特征分析
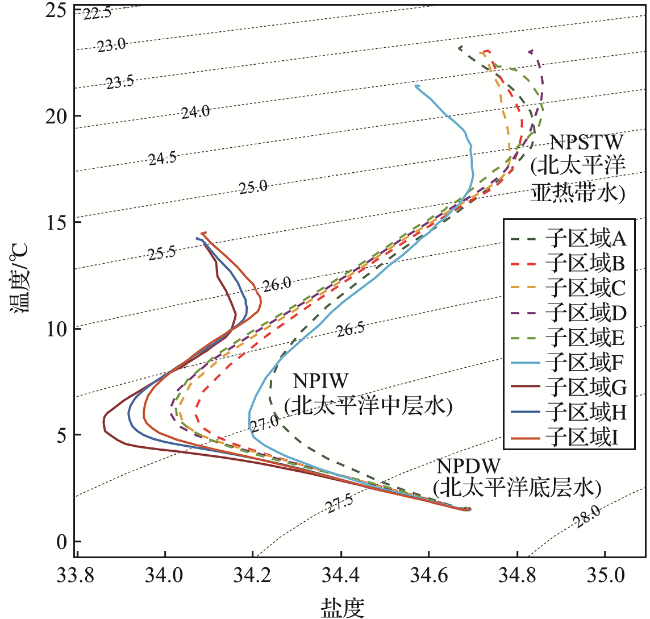
2.1 水团特征
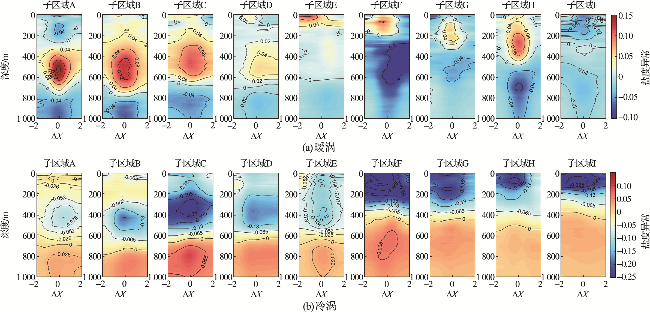
2.2 温度异常
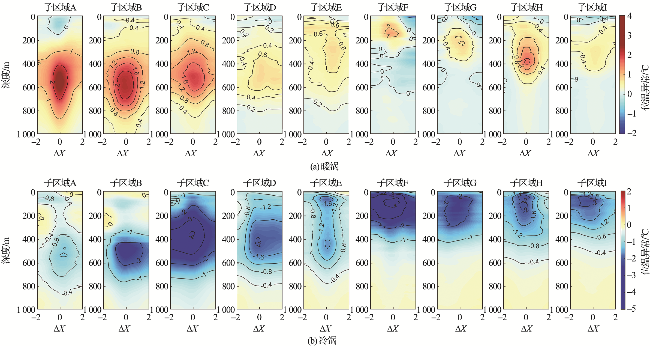
2.3 盐度异常
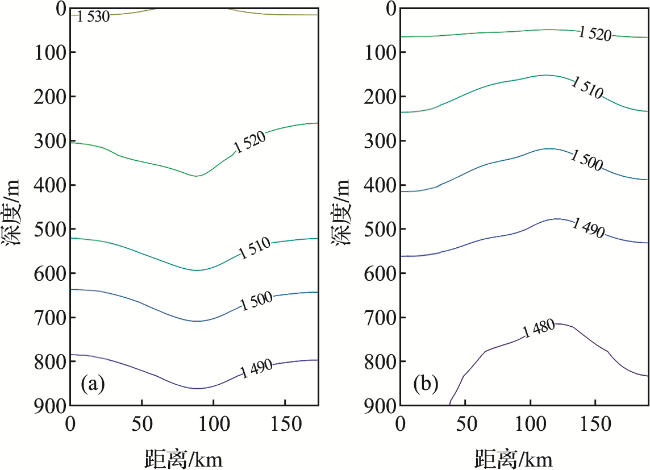
2.4 声速分布特征
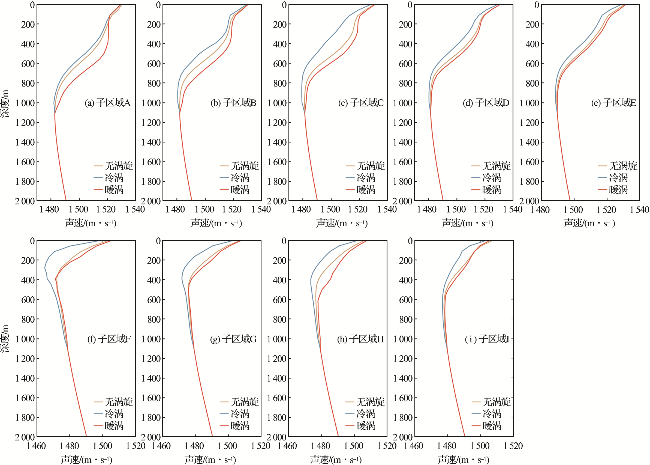
图6 西北太平洋9个子区域在无涡旋情况、冷涡和暖涡背景下涡心位置的声速剖面图Fig.6 Sound velocity profiles at the eddy center under without eddy, cold eddy and warm eddy background in the 9 subregions of the Northwest Pacific Ocean |
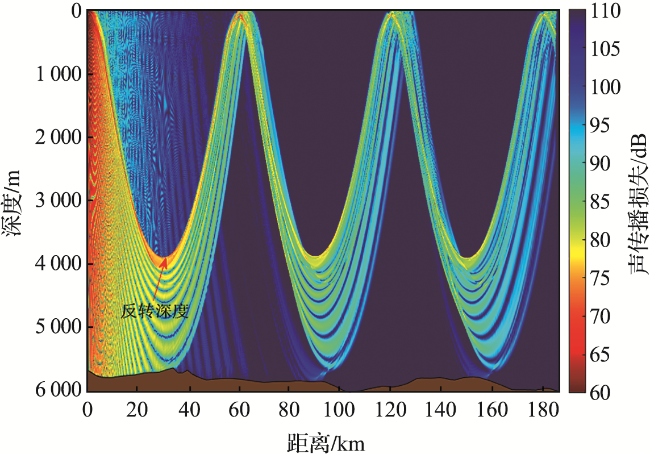
3 声传播的模拟仿真
3.1 中尺度涡对声会聚区的影响
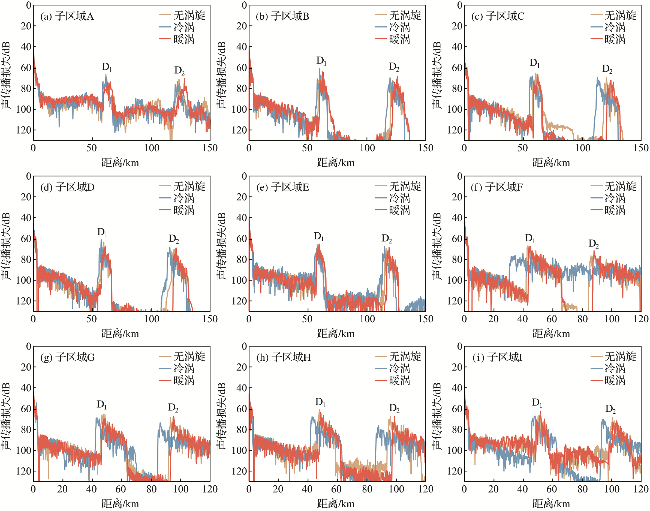
表2 西北太平洋9个子区域暖涡、冷涡、无涡旋背景下会聚区位置与宽度Tab.2 Location and width of convergence zone under the background of warm eddy, cold eddy and without eddy in 9 subregions of the Northwest Pacific Ocean |
| 区域 | 环境背景 | 最大声速差 /dB | 会聚区与声源的距离/km | 会聚区宽度/km | 反转深度/m | ||||
|---|---|---|---|---|---|---|---|---|---|
| d1 | d2 | W1 | W2 | ||||||
| 区域I 黑潮延伸体 | A | 无涡旋 | 62.25 | 123.24 | 8.34 | 8.82 | 4 026 | ||
| 冷涡 | 4.042 | 61.63 | 122.05 | 8.10 | 8.60 | 3 927 | |||
| 暖涡 | 10.867 | 64.07 | 127.09 | 8.68 | 9.44 | 4 058 | |||
| B | 无涡旋 | 62.05 | 122.80 | 8.12 | 8.52 | 3 885 | |||
| 冷涡 | 9.539 | 60.60 | 119.83 | 7.84 | 7.98 | 3 831 | |||
| 暖涡 | 7.958 | 63.52 | 125.78 | 8.37 | 8.98 | 3 961 | |||
| C | 无涡旋 | 61.40 | 121.76 | 8.03 | 8.26 | 3 820 | |||
| 冷涡 | 14.457 | 59.02 | 116.90 | 7.61 | 7.59 | 3 625 | |||
| 暖涡 | 6.519 | 62.64 | 124.21 | 8.22 | 8.59 | 3 847 | |||
| D | 无涡旋 | 61.05 | 121.03 | 7.55 | 8.03 | 3 809 | |||
| 冷涡 | 6.957 | 59.87 | 118.38 | 7.35 | 7.60 | 3 670 | |||
| 暖涡 | 3.254 | 61.48 | 121.95 | 7.66 | 8.45 | 3 831 | |||
| E | 无涡旋 | 59.65 | 119.00 | 7.33 | 7.9 | 3 744 | |||
| 冷涡 | 5.526 | 58.80 | 117.68 | 7.29 | 7.64 | 3 654 | |||
| 暖涡 | 1.978 | 59.83 | 119.51 | 7.44 | 8.12 | 3 821 | |||
| 区域Ⅱ 亲潮延伸体 | F | 无涡旋 | 45.12 | 85.82 | 5.72 | 8.86 | 1 742 | ||
| 冷涡 | 16.106 | ||||||||
| 暖涡 | 4.094 | 45.74 | 86.15 | 5.81 | 6.32 | 1 763 | |||
| G | 无涡旋 | 50.22 | 92.56 | 6.65 | 7.10 | 2 189 | |||
| 冷涡 | 10.023 | 42.24 | 85.54 | 5.42 | 5.62 | 1 948 | |||
| 暖涡 | 3.222 | 45.93 | 93.92 | 6.84 | 7.40 | 2 229 | |||
| H | 无涡旋 | 44.96 | 93.85 | 7.01 | 7.64 | 2 328 | |||
| 冷涡 | 8.884 | 44.02 | 91.56 | 5.80 | 6.26 | 2 119 | |||
| 暖涡 | 7.227 | 47.52 | 97.13 | 7.64 | 8.43 | 2 376 | |||
| I | 无涡旋 | 48.40 | 99.55 | 7.17 | 7.74 | 2 461 | |||
| 冷涡 | 7.563 | 45.97 | 97.16 | 6.07 | 6.31 | 2 167 | |||
| 暖涡 | 2.048 | 48.75 | 100.94 | 7.34 | 8.12 | 2 480 | |||
注:d1,d2分别为第一会聚区和第二会聚区与声源的距离;W1,W2分别为第一会聚区与第二会聚区宽度;空白表示数据缺失。 |