
0 引言
1 数据和方法
1.1 海面观测数据及其分析方法
1.2 风场数据及其分析方法
1.3 Argo剖面数据及其分析方法
2 暖涡的响应特征
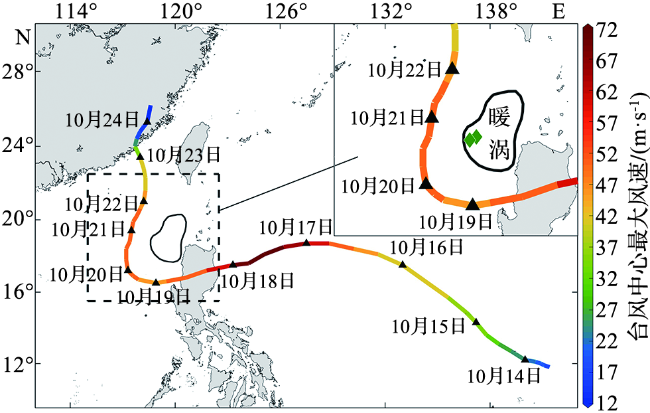
图1 台风“鲇鱼”的移动路径与强度(彩色线条代表台风移动路径,其颜色表示台风中心最大风速,虚线方框表示研究区域,黑色三角表示当日0时的台风中心位置,绿色菱形为Argo浮标位置,黑色粗实线为10月24日的暖涡范围。) Fig.1 Trajectory and intensity of typhoon Megi (The colored line represents the trajectory of the typhoon, its color represents the maximum wind speed at the typhoon center, the dashed line box represents the research area, the black triangles represent the location of the typhoon center at 0 o’clock on that day, the green diamonds are the location of the Argo station, and the black thick lines are the region of the warm eddy on October 24.) |
2.1 暖涡增强
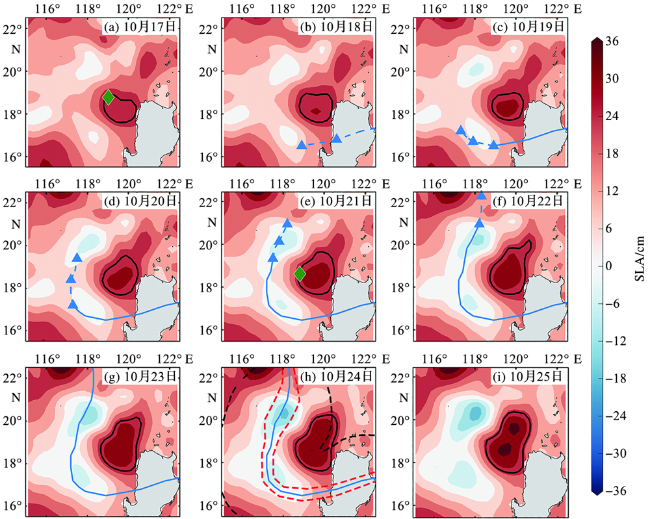
图2 台风“鲇鱼”过境南海期间海表面高度距平(SLA)的逐日变化(蓝色实线表示台风路径,蓝色虚线表示台风当日轨迹,蓝色三角形表示当日0时、12时、24 时的台风中心位置,黑色实线表示暖涡范围,绿色菱形表示Argo浮标位置。图2h中的黑色虚线和红色虚线分别为台风7级风圈包络线和最大风速圈包络线。后文图中符号同此。) Fig.2 Daily mean SLA during the passage of typhoon Megi in the South China Sea (The blue solid line represents the trajectory of typhoon Megi, the blue dashed line represents the trajectory of typhoon Megi on that day, the blue triangles represent the center of the typhoon at 00:00, 12:00, and 24:00 on that day, the black solid line represents the region of the warm eddy, the green diamond marks the location of the Argo station. The black dashed line and the red dashed line in figure 2h represent the envelope of typhoon’s force 7 wind circle and the envelope of maximum wind speed circle, respectively. The symbols in the following figure are the same.) |
2.2 暖涡边缘海水下沉
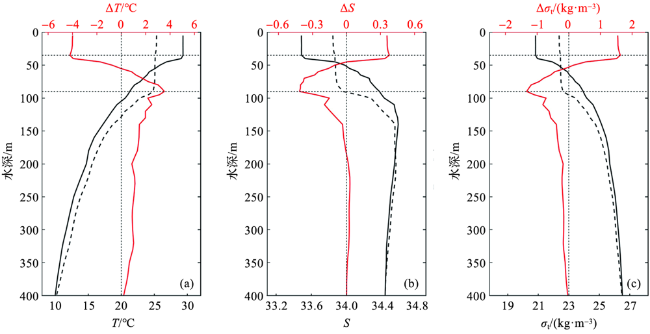
图4 台风过境前、后Argo站位处的温度(a)、盐度(b)、密度超量(c)及其变化的垂向分布(黑色实线表示台风过境前(10月17日)的数据,黑色虚线表示台风过境后(10月21日)的数据,红色实线表示台风过境后数据减去台风过境前数据。两条黑色横虚线分别对应台风过境前、后的上混合层深度:35 m和90 m。) Fig.4 The vertical profile and corresponding variation of temperature (a), salinity (b) and density excess (c) before and after the typhoon Megi at Argo station (The black solid line represents the data before the typhoon passes through, the black dashed line represents the data after the typhoon passes through, the red solid line represents the difference between the data after and before the typhoon passes through. The two black horizontal dashed lines correspond to the depths of the upper mixed layer before and after the typhoon passes through: 35 m and 90 m, respectively.) |
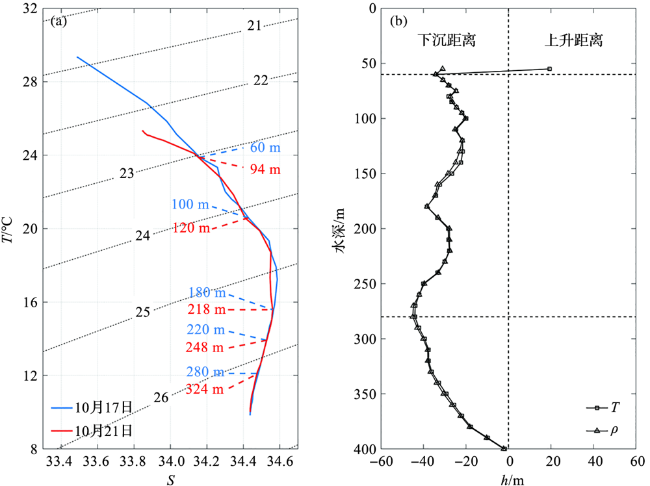
图5 Argo站位处的T-S曲线(a)和基于温度、密度剖面计算的海水升降距离(b)(图5a中黑色数字为密度超量,蓝色和红色数字分别为部分海水下沉极值点对应的下沉前后深度。图5b中的黑色横向虚线标出了下沉距离的两个特征水层:60 m和280 m。) Fig.5 The T-S plot (a) and the upwelling/downwelling distances calculated based on temperature and density profiles (b) at Argo station (In figure 5a, the black numbers indicate the density excesses, the blue and red numbers indicate the depths before and after sinking of some seawater sinking extreme points, respectively. In figure 5b, the black horizontal dashed lines mark the two characteristic water layers for the sinking distance: 60 m and 280 m.) |
3 暖涡的响应机制探讨
3.1 风应力旋度对暖涡的影响
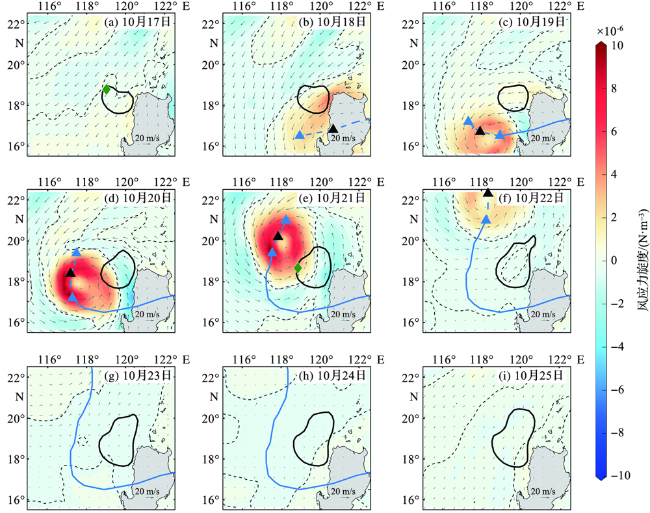
图6 台风“鲇鱼”过境南海期间研究海区逐日12时的风场及风应力旋度(黑色虚线表示风应力旋度为0的等值线,灰色箭头表示风矢量。) Fig.6 Daily wind field and wind stress curl at 12:00 during the passage of typhoon Megi in the South China Sea (The black dashed line represents the contours where wind stress curl is zero, the gray arrows represent wind vectors.) |
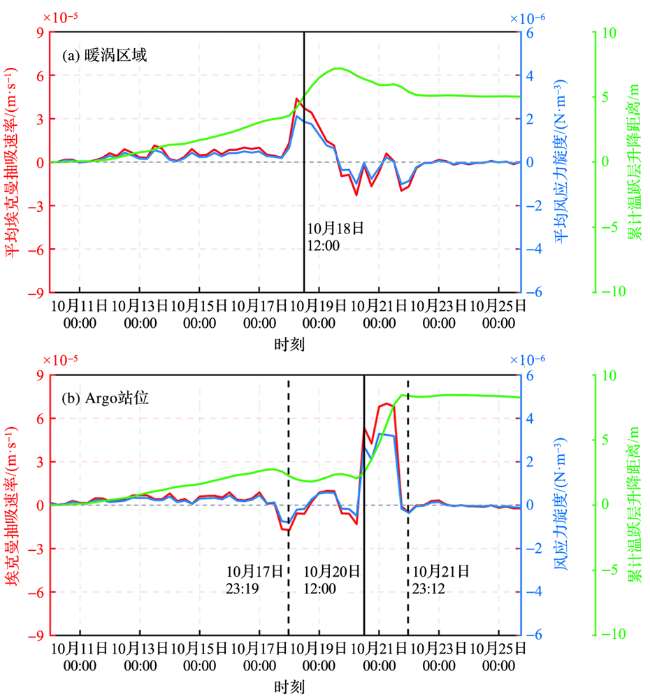
图7 埃克曼抽吸速率、风应力旋度和累计温跃层升降距离的时间变化(图7a中的黑色实线表示暖涡与台风“鲇鱼”距离最近时刻。图7b中的黑色实线表示Argo浮标与台风“鲇鱼”距离最近时刻,黑色虚线表示Argo浮标的两次观测时间。) Fig.7 Time-variation of Ekman pumping velocity, wind stress curl and accumulated thermocline upwelling/downwelling distances (The black solid line in figure 7a represents the moment when the warm eddy is closest to typhoon Megi. The black solid line in figure 7b represents the moment when the Argo station is closest to typhoon Megi, and the black dashed lines represent the time of the two observations at the Argo station.) |
3.2 实际流场变化对暖涡的影响
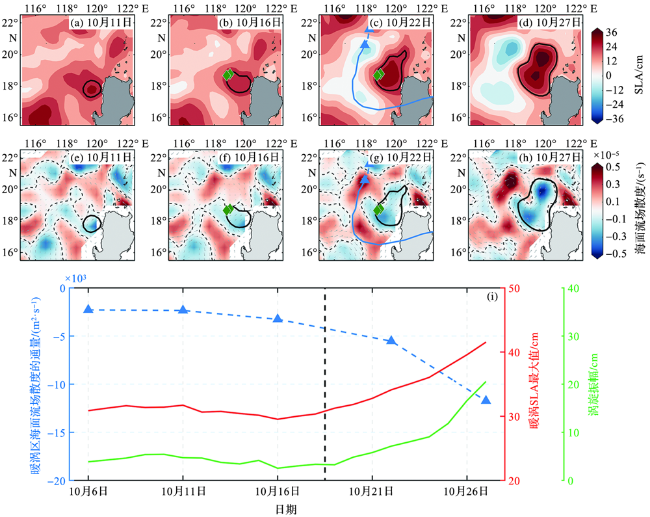
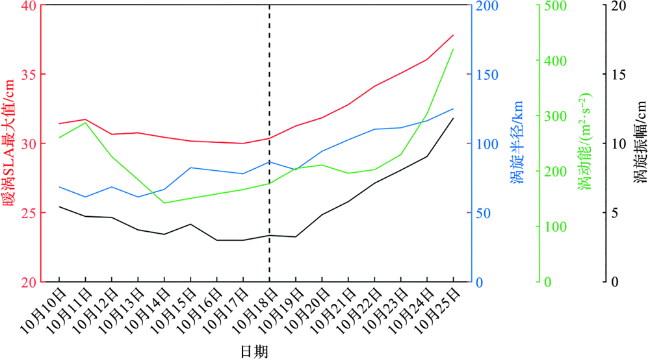
图8 海面高度异常的变化(a~d),海面流场散度的变化(e~h)以及暖涡区域海面流场散度的通量、暖涡SLA最大值、暖涡振幅随时间的变化(i)(图8i中的竖虚线表示台风“鲇鱼”开始影响暖涡的时间。) Fig.8 Time-variations of SLA (a-d); divergence of sea surface flow(e-h); flux of divergence, SLA maximum and amplitude within the warm eddy extent(i) (The vertical dashed line in figure 8i represents the time when typhoon Megi begin to affect the warm eddy.) |