
0 引言
涌潮是发生于喇叭形河口或海湾的一种潮差增大的特殊潮汐现象。涨潮时,潮波进入河口或海湾后,因水域骤然缩窄,底坡变陡,大量水体进入窄道,能量集中,潮波振幅骤增。同时,潮波靠近底部的水体,受底部摩阻等影响,其运动速度较上部水体为小,从而使潮波波峰的前坡面变陡,并随着水深的减小和河水径流的顶托而逐渐加剧。在传播一定距离后,潮峰壅高前倾,形成潮头,状如直立的水墙向前推进,来势极其迅猛,称为涌潮[1]。涌潮存在并被观测到的历史悠久[2]。并非所有的河口都会发生涌潮,据估计,全世界发生涌潮的河口有将近450个[3],其中钱塘江出口段是最为人所熟知的涌潮地段,每年都有大量的游客前去观潮。然而,在壮阔的钱塘江大潮的背后潜藏着严重的自然灾害。
目前研究涌潮的手段主要有涌潮观测分析、涌潮理论分析、涌潮数学模型和涌潮数值模拟等,其中涌潮数值模拟因花费时间短、成本低,已成为主流研究方法。1871年,Saint-Venant提出了意义非凡的圣维南方程,该方程对于解决具有自由表面的水体的渐变不恒定流的计算具有重要意义,Saint-Venant在之后的测试中又提出了用来流的弗劳德数(Froude number,简称Fr数)来判断涌潮是否产生[4];苏铭德等[5]首次将无结构网格上的无波动无自由耗散 (non-oscillatory and non-free dissipative, NND)格式用于求解二维圣维南方程,对于涌潮在钱塘江段的形成、发展以及消亡过程进行了更深层次的研究;林炳尧等[6-7]进行了波状水跃与波状涌潮的相似性分析以及不同的Fr数下涌潮状态的改变情况研究,较为深入地验证了尺度模型在研究涌潮问题中的重要性,并以涌潮阶跃模型为基础,运用数学研究方法,探讨了涌潮的反射以及碰撞对于现实生活中的回头潮、交叉潮形成的影响;FAN等[8]进行了弯曲通道中波状涌潮和滚旋涌潮传播的水槽实验,获得弯曲通道两侧的涌潮传播特征,为有涌潮存在的河口地区的海滩和海堤防护、减少侵蚀、促进淤积的工程设计提供了实验参考;戚蓝等[9]改进了传统生涌方法,采用大涡模拟技术模拟紊流,利用流体体积法追踪自由表面,建立了涌潮水动力自由模型,更好地预演及模拟了涌潮的产生及发展过程;PUTRA等[10]利用OpenFOAM中的LES 湍流模型进行了涌潮流动模拟,模拟值与实验测量值具有很好的一致性,补充了涌潮过程的数值模拟方法。
涌潮的形成主要与天体之间的引力作用相关,尤其是太阳和月球对地球的引力影响最为显著。由于地球的自转和公转,这些引力的作用效果会在不同的时间产生变化。每逢农历初一和十五,地球、月球和太阳会处于一条直线上,引力作用相互叠加,这时会产生更大的潮汐。而在中秋前后,地球、月球和太阳不仅共线,而且地球距离月球最近,这时的潮汐规模会达到峰值,如钱塘江大潮潮头一般高1~2 m,最高达3 m;潮水涌进速度一般为5~7 m/s,最高达10 m/s,每平方米有逾 7 t的冲击力[11-12]。可想而知,如此强的冲击力以及巨浪会对沿岸建筑、港口等基础设施以及航运和渔业造成巨大的影响,对于经济发展以及人类活动产生极大的阻碍作用[13]。在此背景下,政府为防止涌潮灾害对沿岸居民以及观潮游客造成经济损失和安全威胁修建了大量的堤坝、丁坝等防护措施,并加强潮水预测预报,在潮灾到来前对人民群众进行及时的疏散、转移[14]。目前,防汛决策主要采用经验预报模式,精度差、预见期短,难以对潮灾发展的过程进行预测。近年来,以BP神经网络(back propagation neural network)、支持向量机为代表的传统机器学习方法被广泛应用于水位预报中[15-16]。卷积神经网络(convolutional neural network,CNN)相对于传统的机器学习方法具有局部连接(减少训练量)、权值共享(避免了梯度消失的问题)、多层卷积(可处理更复杂的输入数据)、高效的GPU加速(更适用于大规模数据集的分类)、自动特征学习(无需手动设计特征,更加灵活)等优势。这些优势使卷积神经网络可以避免大部分梯度消失的问题且更易于训练[17]。
本文使用OpenFOAM软件模拟生成涌潮水动力发展过程,通过数值模拟结果与物理实验数据的对比,确定相关数值模拟数据的可靠性。然后使用通过验证的数值模拟数据对卷积神经网络CONV1D模型进行训练,成功预测钱塘江实际物理环境下的涌潮水动力过程,并对相关误差进行分析,以此来评估CONV1D模型的预测精度。
1 涌潮的数值模拟
1.1 数值模型方法
1.1.1 控制方程
本文基于开源程序OpenFOAM建立涌潮数值水槽,求解雷诺时均的Navier-Stokes方程,其连续性方程(1)和动量守恒方程(2)如下:
=0
+ =- +gi+ -
式中:对于二维数值波浪水槽, i, j=1,2;t为时间;xi为笛卡尔坐标系下的i方向坐标; xj为笛卡尔坐标系下的j方向坐标;ui为笛卡尔坐标系下的i方向速度分量;uj为笛卡尔坐标系下的j方向速度分量;ρ为流体密度;p为压力;gi为重力加速度分量;τij为湍流剪应力; 为雷诺切应力。其中,τij和 的表达式为
τij=μ(+ )
= kδij-vt(+ )
式中: μ为动力黏度,k为湍动能,δij为克罗内克符号,vt为湍流运动黏度。
1.1.2 湍流模型
对于湍流运动的模拟,本文运用雷诺时均方法,采用剪切应力输运(shear stress transport,SST) k-ω 湍流模型来计算湍流黏性系数,其控制方程如下所示:
=τij -β*ρωk+ [(μ+σkμt) ]
= τij -βρω2k+ [(μ+σωμt) ]+2(1-F1)ρσω2
1.1.3 自由边界条件
本文采用修正的流体体积法来捕捉水和空气的自由液面,其控制方程如下所示:
+Ñ·(αui)+Ñ·[α(1-α)u'i]=0
式中:Ñ为梯度算子,Ñ·[α(1-α)u'i]为人工压缩项,保证了方程的解在界面附近满足有界性,并对外部流场无影响。u'i 为 i 方向的相对速度,由 i 方向两相流体的速度相减计算得到。α为计算单元中水相体积分数,不同的水相体积分数值代表不同的含义:
1.1.4 离散方法
使用有限体积法对控制方程进行离散,其中时间离散采用Euler格式,压力梯度离散采用 Gauss线性离散格式,拉普拉斯项离散采用修正的Gauss线性离散格式,散度项采用高斯类方法进行离散。本文采用PIMPLE算法(该算法是SIMPLE算法与PISO算法的耦合)对压力-速度进行耦合求解。该方法在对速度场进行相邻校正的同时,通过亚松弛方法解决了相邻时间步长内流动差异过大的问题,使求解更加精确,效率更高。
1.2 数值验证
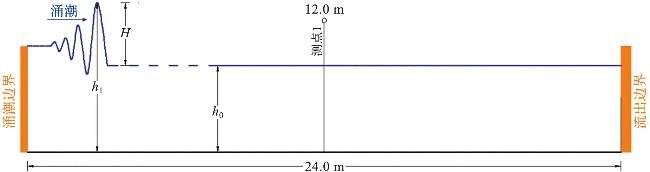
本文基于OpenFOAM的SST k-ω湍流模型,搭建潮波数值模型水槽。根据ZHANG等[20]所做的空水槽涌潮验证实验,数值计算了涌潮在水平地形传播的过程,并将数值计算结果与实际物理实验数据进行对比,验证了潮波数值模型计算涌潮水动力特性的能力。
式中:Xmodel和Xobs分别表示数值计算值和实验观测值,上划线表示取平均值。skill数越接近于1,表示模型计算精度越高;skill数越接近于0,表示模型计算精度越低。
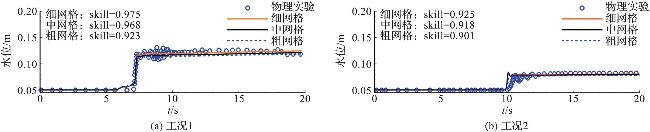
图2 物理实验验证工况下x=10 m处的水位时程曲线Fig.2 Temporal evolution of water level in verification of physical experimental conditions at x=10 m |
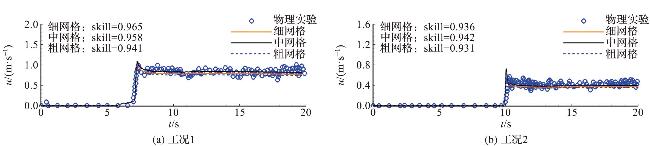
由上述物理验证实验可知,本文所搭建的涌潮数值计算模型能够较好地模拟涌潮在传播过程中水动力特性的变化规律,可以为预测涌潮在斜坡地形上的传播,提供计算服务的优化。
1.3 波状涌潮在斜坡地形上传播演变的数值模拟
本节在涌潮数值模型在水平地形传播过程检验合理的基础上,计算了涌潮在斜坡上传播的水动力过程,创建了一个二维数值水槽(图4)。水槽全长L=40.0 m,在x=15.0 m处有一个坡度比为1∶3,坡高H1为0.2 m的斜坡,坡后为一段长L1=24.4 m的平坦地形。总共设置了44个测点,从x=10.0 m处开始每隔0.5 m设置一个,在斜坡处进行密布,每隔0.1 m设置一个测点,坡后测点分布情况与坡前一致,直至x=30.0 m处,全部测点布置完毕。数值水槽的参数选取参考了钱塘江盐官段真实的地形数据,并运用相似理论按比例缩小。这样可以较准确地模拟钱塘江涌潮的水动力传播过程以及涌潮在传播至陆地两侧堤岸后冲上堤岸的具体流态。由于盐官段的涌潮基本为波状涌潮(Fr=1.2~1.3)[9,24],因此本节设置的25种工况所生成的涌潮均为Fr=1.2~1.3范围内的波状涌潮(表2)。图5和图6为1~5号数值模拟工况中具有代表意义的测点的自由水面水位时程曲线。
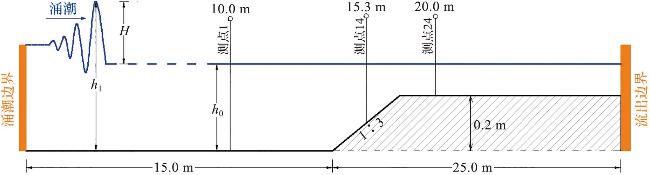
表2 数值模拟工况Tab.2 Numerical simulation conditions |
| 工况序号 | 潮前水深 h0/m | 波高H/m | 潮后水深 h1/m | 潮后流速 u1/(m·s-1) | Fr | 工况序号 | 潮前水深 h0/m | 波高H/m | 潮后水深 h1/m | 潮后流速 u1/(m·s-1) | Fr |
|---|---|---|---|---|---|---|---|---|---|---|---|
| 1 | 0.36 | 0.14 | 0.50 | 0.678 | 1.288 | 14 | 0.42 | 0.16 | 0.58 | 0.718 | 1.282 |
| 2 | 0.38 | 0.14 | 0.52 | 0.662 | 1.273 | 15 | 0.44 | 0.16 | 0.60 | 0.703 | 1.269 |
| 3 | 0.40 | 0.14 | 0.54 | 0.647 | 1.259 | 16 | 0.37 | 0.12 | 0.49 | 0.579 | 1.241 |
| 4 | 0.42 | 0.14 | 0.56 | 0.633 | 1.247 | 17 | 0.38 | 0.12 | 0.50 | 0.572 | 1.234 |
| 5 | 0.44 | 0.14 | 0.58 | 0.620 | 1.236 | 18 | 0.40 | 0.13 | 0.53 | 0.603 | 1.241 |
| 6 | 0.37 | 0.15 | 0.52 | 0.715 | 1.300 | 19 | 0.42 | 0.13 | 0.55 | 0.590 | 1.230 |
| 7 | 0.38 | 0.15 | 0.53 | 0.706 | 1.292 | 20 | 0.44 | 0.13 | 0.57 | 0.578 | 1.219 |
| 8 | 0.40 | 0.15 | 0.55 | 0.690 | 1.278 | 21 | 0.37 | 0.11 | 0.48 | 0.533 | 1.221 |
| 9 | 0.42 | 0.15 | 0.57 | 0.676 | 1.265 | 22 | 0.38 | 0.11 | 0.49 | 0.527 | 1.215 |
| 10 | 0.44 | 0.15 | 0.59 | 0.662 | 1.253 | 23 | 0.40 | 0.12 | 0.52 | 0.559 | 1.223 |
| 11 | 0.37 | 0.13 | 0.50 | 0.624 | 1.260 | 24 | 0.42 | 0.12 | 0.54 | 0.547 | 1.212 |
| 12 | 0.38 | 0.13 | 0.51 | 0.617 | 1.254 | 25 | 0.44 | 0.12 | 0.56 | 0.535 | 1.203 |
| 13 | 0.40 | 0.16 | 0.56 | 0.734 | 1.296 |
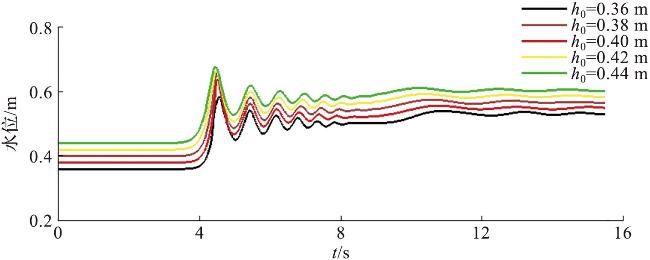
图5 在1~5号数值模拟工况下x=10 m处的水位时程曲线Fig.5 Temporal evolution of water level in numerical simulation conditions 1-5 at x=10 m |
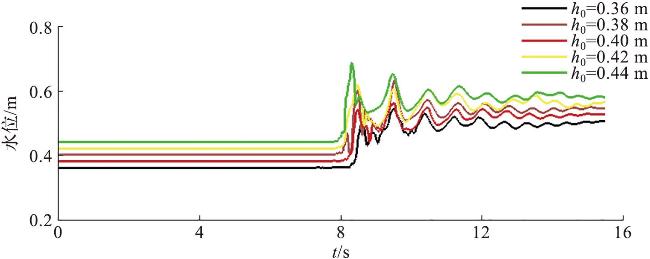
由图6可见,涌潮经过之后,潮头出现了轻微的破碎现象,导致波形变得较为紊乱。这种现象可能是由于涌潮在经过x=15.0 m 处的斜坡后,部分动能被转化为势能,从而导致水头壅高,进而引发潮头的破碎。值得注意的是,由于5组工况下的涌潮均为波状涌潮,因此在涌潮向后传播的过程中,我们可以看到x=15.0 m 处的水位逐渐趋于稳定。这一现象充分展示了波状涌潮的特征,即涌潮传播后水位逐渐趋于平稳。
2 卷积神经网络在涌潮预测中的应用
CONV1D模型是卷积神经网络在特定应用场景中的一个变体,它专门针对一维数据设计。这种模型在自然语言处理、时间序列分析以及信号处理等领域中表现出了卓越的性能。本文运用CONV1D模型预测了涌潮在斜坡地形下的水动力发展演变过程。
2.1 数据集
用于CONV1D模型预测的数据集包含了使用OpenFOAM进行的100次涌潮演变数值模拟(每次的涌潮过程时长为15.5 s),这些模拟主要针对具有斜坡的地形。数据集分为90组训练集和10组测试集。训练集是机器学习中的重要组成部分,其主要作用是训练模型,使其能够自动学习和适应数据中的特征和规律,从而完成分类、回归等任务。在训练过程中,模型会不断地从训练集中获取数据,并尝试通过学习数据中的特征和规律来预测新的数据。训练集中的数据通常包含已知标签,即已知正确的分类结果,这些标签可以用于评估模型的性能和调整模型参数。训练集的规模和质量对模型的训练效果和泛化能力都有重要影响。测试集在机器学习中起着至关重要的作用,它们用于评估模型的性能和泛化能力,避免过拟合并验证模型稳定性。在机器学习中,通常会先对训练数据进行训练,然后再用测试数据进行验证。在涌潮演变的数值模拟中,设置不同的涌潮波高、水深以及来流速度等数据;选择在斜坡上具有不同发展规律的测点,其本身的水面时程曲线所表现出的水文特征以及波面发展趋势不同,保证了其具有独立性、代表性、样本数量充足等性质。
本文收集了涌潮在斜坡地形上的水动力演变的数值模拟数据,采用斜坡下和斜坡上共10个位置的测点数据作为CONV1D模型的多时间序列输入,通过这些数据,预测斜坡上 x=30.0 m 测点处的涌潮水动力学发展演变过程。
2.2 网络配置
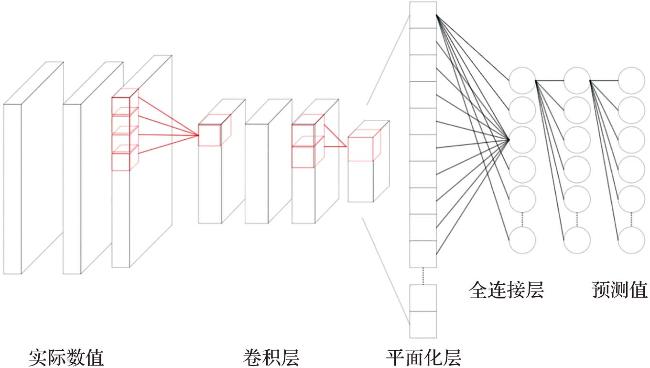
图7为卷积神经网络结构图。CONV1D为卷积神经网络的一种特殊变体,主要由12层神经网络组成,分为6个一维卷积层、3个池化层以及3个全连接层。在卷积层中,设置了三种滤波器,大小分别为7、5、3,步幅均为1,并使用 Padding填充方法调整输出的大小,保证卷积运算在保持空间大小不变的情况下将数据传给下一层。任意一维卷积层后均有一个 Relu激活函数层[26],表示出上层节点与下层节点之间的函数关系,它的作用是把激活的神经元特征通过函数保留并映射出来,即将神经元的输入映射到输出端。参数Negative slope设置为0.01。每3层卷积层后设置1层池化层进行特征值数量的优化。全连接层的主要作用是将前层(卷积层和池化层)计算得到的特征映射样本标记空间,简单地说就是将特征表示聚合成一个值。其优点在于减轻特征位置对于分类结果的影响,提高了整个网络的鲁棒性。在最后一层全连接层前加入随机丢弃层,选择丢弃率为50%,使用该丢弃率的意义为使用50%的特征数进行全连接,以防止过拟合[27]。在模型训练的过程中使用模拟波形和预测波形的均方误差作为损失函数。在比较模型拟合效果之后,选择Adam更新参数方法[28]对神经网络中的权重及偏置进行调整优化,有效地减少损失,提高模拟学习的效率。设置超参数学习率α=0.000 3,剩余两个超参数(一次momentum系数β1与二次momentum系数β2)根据文献[27]分别按照标准值设定为0.9及0.999。
2.3 训练结果
表3 测试工况设置Tab.3 Test conditions |
| 工况序号 | 1 | 2 | 3 | 4 | 5 | 6 | 7 | 8 | 9 | 10 |
|---|---|---|---|---|---|---|---|---|---|---|
| 水深/m | 0.40 | 0.40 | 0.38 | 0.37 | 0.42 | 0.39 | 0.41 | 0.45 | 0.46 | 0.38 |
| 波高/m | 0.16 | 0.13 | 0.14 | 0.11 | 0.12 | 0.13 | 0.12 | 0.15 | 0.17 | 0.15 |
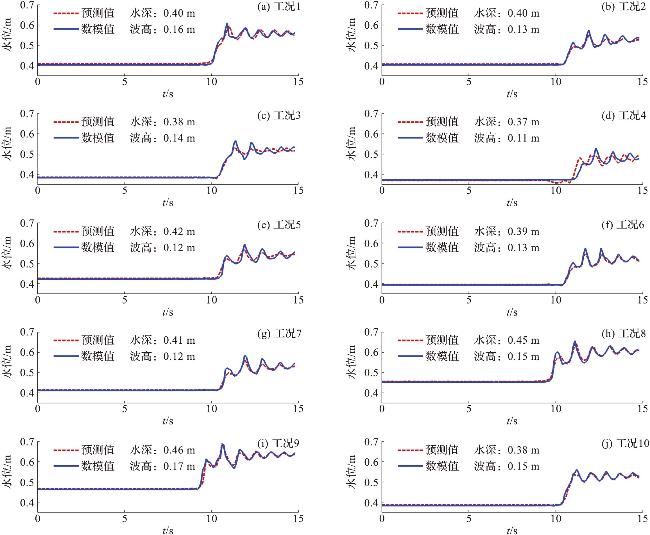
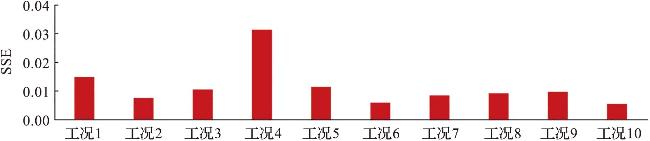
表4 不同测试工况下涌潮到达 x=30.0 m 测点处的用时和该测点最高水位的CONV1D模型预测值与数值模拟值的误差分析Tab.4 Error analysis between CONV1D model predicted and numerical simulations of the time taken for the tidal bore reaching and maximum water level at x=30.0 m under different test conditions |
| 工况序号 | 涌潮到达 x=30.0 m 测点处的用时 | x=30.0 m 测点处的最高水位 | ||||
|---|---|---|---|---|---|---|
| 数值模拟值/s | CONV1D模型预测值/s | 相对误差/% | 数值模拟值/m | CONV1D模型预测值/m | 相对误差/% | |
| 1 | 11.0 | 11.1 | 0.91 | 0.611 | 0.596 | 2.45 |
| 2 | 12.0 | 12.0 | 0.00 | 0.575 | 0.553 | 3.83 |
| 3 | 11.5 | 11.5 | 0.00 | 0.567 | 0.531 | 6.35 |
| 4 | 12.4 | 14.0 | 12.90 | 0.530 | 0.498 | 6.04 |
| 5 | 12.0 | 12.0 | 0.00 | 0.595 | 0.569 | 4.37 |
| 6 | 11.7 | 11.7 | 0.00 | 0.575 | 0.547 | 4.87 |
| 7 | 12.0 | 12.0 | 0.00 | 0.585 | 0.562 | 3.93 |
| 8 | 11.2 | 11.2 | 0.00 | 0.658 | 0.649 | 1.37 |
| 9 | 10.8 | 10.7 | 0.93 | 0.684 | 0.690 | 0.88 |
| 10 | 11.2 | 12.1 | 8.04 | 0.562 | 0.544 | 3.20 |
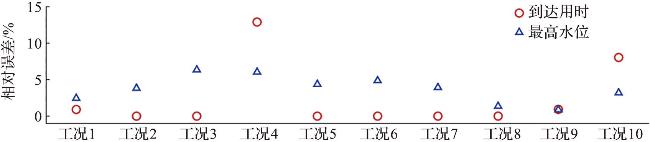
由表4可知,CONV1D模型预测的最高水位的最大相对误差为6.35%,最小相对误差为0.88%,平均相对误差为3.73%; 到达用时的最大相对误差为12.90%,最小相对误差为0.00%,平均相对误差为2.28%。从图10中可以直观地看到,最高水位的相对误差较小,到达用时的相对误差波动也较为平稳,基本接近于同时到达,但存在个别测试工况(水深:0.37 m,波高:0.11 m组)误差偏高。原因应该来自于这部分类型的涌潮波训练数据过少,导致CONV1D模型对于该类涌潮的特征数获取较少,不能较为准确地预测出该类涌潮的水动力发展特性。但是总体来说,CONV1D模型的预测精度以及效率非常高,能够满足涌潮水动力发展预测的需求。
由上述分析可知,使用CONV1D模型能够快速高效地生成涌潮发展过程中相关位置水位的时程曲线。这种方法能够在短时间内准确获取涌潮的水动力发展趋势,从而有效衡量涌潮规模并判断应对措施。与传统的经验预警机制或数值模拟方法相比,使用CONV1D模型预测涌潮规模及其发展过程的时间可显著缩短至不到5 s,大大减少了相关算力需求。由于其快速、高效的特点,这种基于CONV1D模型的方法可以应用于实时预警涌潮危害程度系统,为决策者提供及时准确的信息,以采取适当的应对措施。
3 小结
本文利用OpenFOAM建立了涌潮数值模拟水槽,获取了具有高精度的涌潮水位时程曲线,并成功实现了对水平地形和斜坡地形上的涌潮的数值模拟,数值模拟结果与物理实验数据具有高度一致性。此外,根据数值模拟得到的涌潮在斜坡上的水动力发展数据,使用卷积神经网络模型(CONVID)进行学习,成功预测出与数值模拟数据基本吻合的结果,证明了将卷积神经网络应用于涌潮水动力分析的可行性。这对于涌潮灾害预警系统的建立具有一定的参考价值。