
0 引言
1 发展现状
1.1 海洋大数据
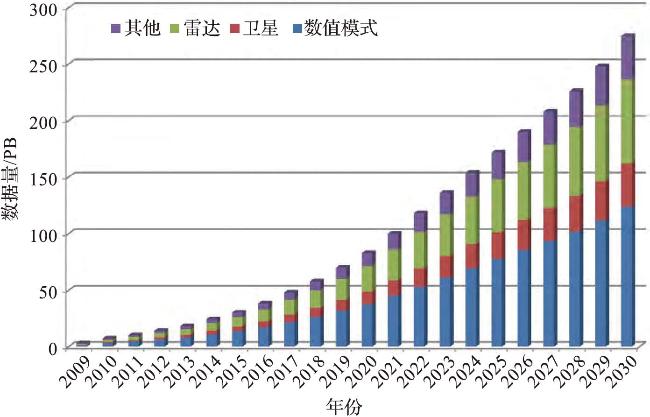
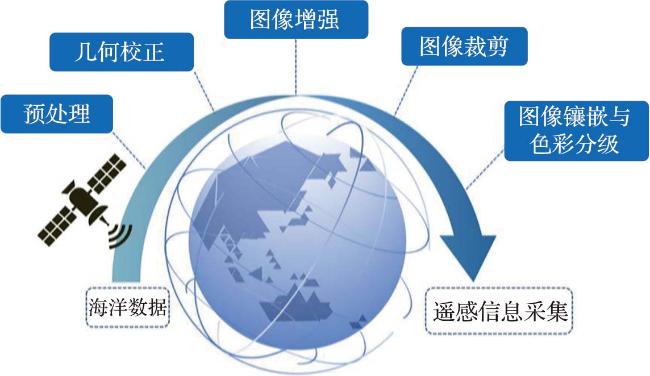
1.1.1 海洋遥感大数据
1.1.2 数值模型和再分析数据
1.1.3 海洋大数据的重构
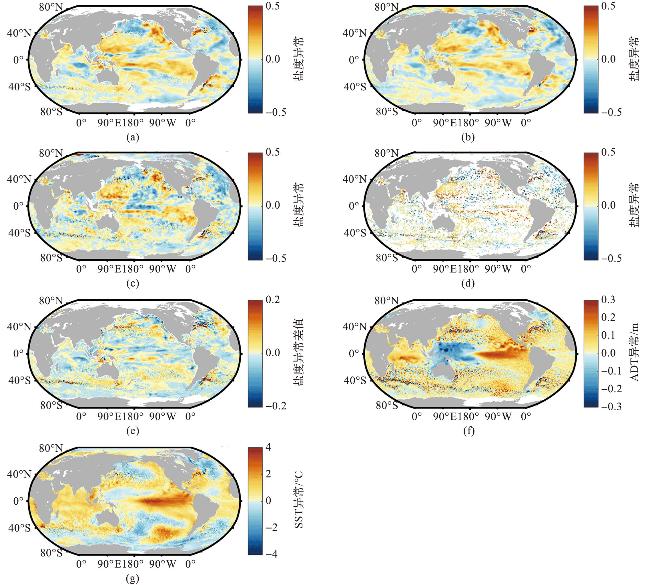
图3 前馈神经网络重构的2016年1月全球盐度异常的空间分布(图件改绘自文献[27]。图a为盐度异常(IAP 0.25°);图b为盐度异常(IAP 1°);图c为盐度异常(ARMOR3D);图d为盐度异常(实观测资料);图e为盐度异常(IAP 0.25°减 IAP 1°在100 m);图f为ADT异常(遥感资料);图g为SST异常(遥感资料)。) Fig.3 Spatial distribution of global salinity anomalies in January 2016 reconstructed by feedforward neural networks (Figure is repainted from reference [27]. Fig.a shows the salinity anomaly (IAP 0.25°); Fig.b shows the salinity anomaly (IAP 1°); Fig.c shows the salinity anomaly (ARMOR3D); Fig.d shows the salinity anomaly (observations); Fig.e shows the salinity anomaly (IAP 0.25° minus IAP 1° at 100 m); Fig.f shows the ADT anomaly (remote sensing); Fig.g shows the SST anomaly (remote sensing).) |
1.2 海洋现象的智能识别
1.2.1 海洋涡旋的智能识别
1.2.2 海洋内波的智能识别
1.2.3 海冰的智能识别
1.3 海洋现象的智能预测
1.3.1 海面温度的智能预测
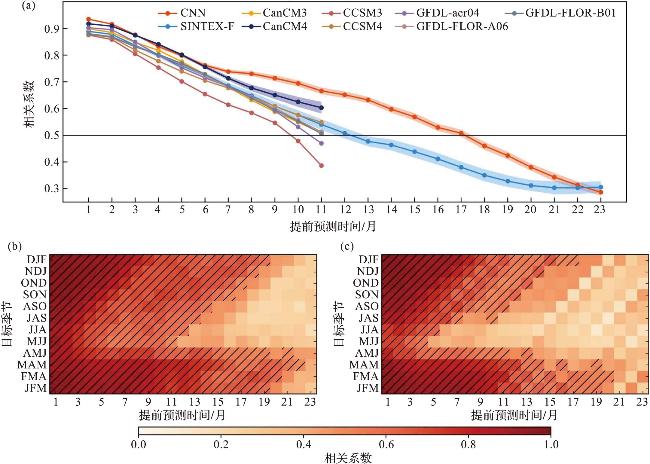
图4 CNN模型中ENSO预测的相关系数(图件改绘自文献[72]。图a为CNN模型(红色)、SINTEX-F动态预测系统(蓝色)和北美多模式集成项目中包含的动态预测系统(其他颜色)3个月滑动平均Niño3.4指数的全季节相关系数;图b和图c为CNN模型(b)和SINTEX-F动态预测系统(c)中预测每月的Niño3.4指数与提前预测时间的相关系数,阴影线突出显示了相关系数超过0.5的预测。) Fig.4 Correlation coefficients for ENSO forecasts using the CNN model (Figure is repainted from reference [72]. Fig.a shows the all-season correlation skill of the three-month moving average Niño3.4 index as a function of the forecast lead month in the CNN model (red), SINTEX-F dynamical forecast system (blue), and dynamical forecast systems included in the North American Multi-Model Ensemble project (the other colors); Fig.b and Fig.c show the correlation skill of the Niño3.4 index targeted to each calendar month in the CNN model (b) and the SINTEX-F dynamical forecast system (c), hatching highlights the forecasts with correlation skill exceeding 0.5.) |
1.3.2 风暴潮的智能预报
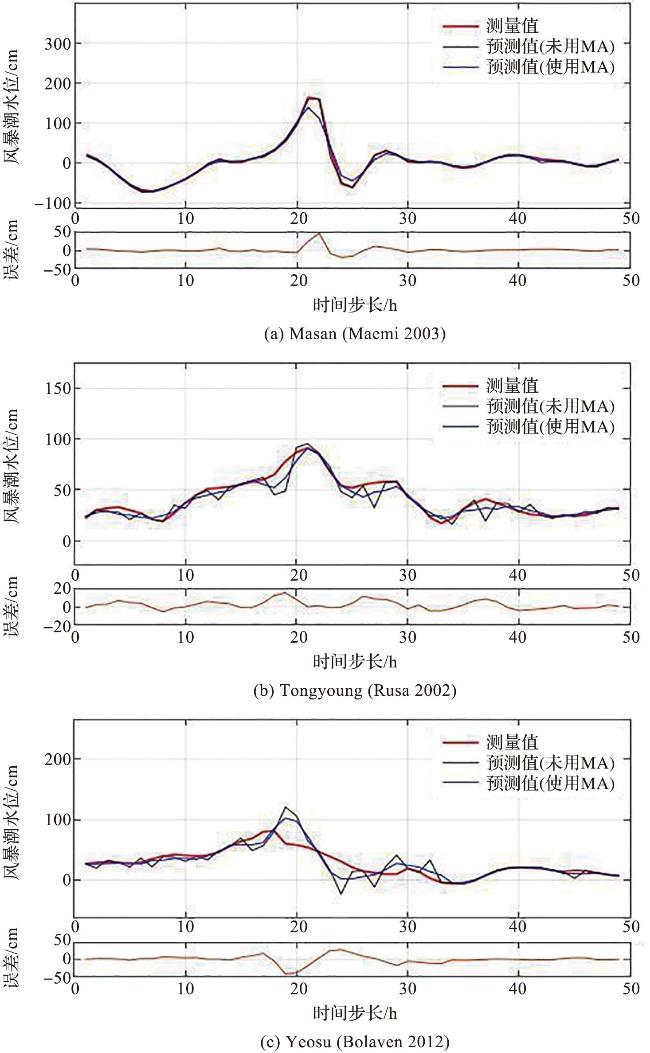
图5 ANN预测风暴潮水位的验证(图件改绘自文献[86]。图a~c分别为Masan站点2003年“Maemi”台风(a),Tongyoung站点2002年“Rusa”台风(b),Yeosu站点2012年“Bolaven”台风(c)风暴潮验证结果。MA是指文献中的Levenberg-Marquardt反向传播算法。) Fig.5 Verification of ANN forecast storm surge level (Figure is repainted from reference [86]. Figures a-c show the storm surge verification results of 2003 Typhoon “Maemi” at Masan Station (a),2002 Typhoon “Rusa” at Tongyoung Station (b), and 2012 Typhoon “Bolaven” at Yeosu Station (c), respectively. MA is the Levenberg-Marquardt backpropagation algorithm in the reference.) |
1.3.3 海浪的智能预测
图6 ConvLSTM算法智能预测台风浪浪高(图件改绘自文献[104]。图a~c为2019年8月8日18时,台风“Lekima”在东海上空时的有效波高(SWH);图d~f为2017年12月24日21时,台风“Tembin”在南海上空时的有效波高。) Fig.6 ConvLSTM algorithm intelligently predicts typhoon wave height (Figure is repainted from reference [104]. Figures a-c show the SWH(significant wave height) of Typhoon “Lekima” over the East China Sea at 18:00 on August 8, 2019; figures d-f show the SWH of Typhoon “Tembin” over the South China Sea at 21:00 on December 24, 2017.) |
1.3.4 海流的智能预测
1.4 海洋动力参数智能估算
1.4.1 物理驱动和数据驱动海洋模式参数化
1.4.2 深度学习对海洋湍流过程的参数化
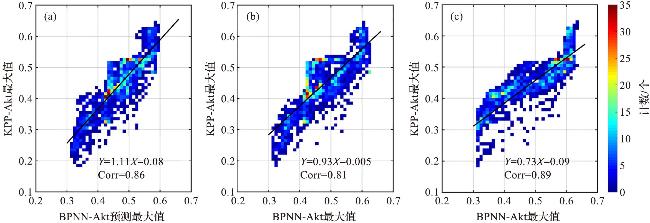
图7 不同输入参数驱动的人工智能参数化方案与KPP参数化方案混合系数比较(图件改绘自文献[144]。图a的驱动参数为温度、盐度和流速,图b的驱动参数为温度和盐度,图c的驱动参数为温度。图例中“corr”表示相关系数。) Fig.7 Comparison of mixing coefficients between artificial intelligence parameterization schemes driven by different input parameters and KPP parameterization schemes (Figure is repainted from reference [144]. The driving parameters in figures a-c are temperature, salinity, flow rate (a), temperature and salinity (b),and temperature (c), respectively. In figure, ‘corr’ refers to the correlation coefficient.) |
1.5 海洋预报误差智能订正
1.5.1 波浪预报误差智能订正
1.5.2 海流预报误差智能订正
1.6 智能求解海洋运动方程
1.6.1 融合物理机制的深度学习
1.6.2 物理机制融合的智能求解
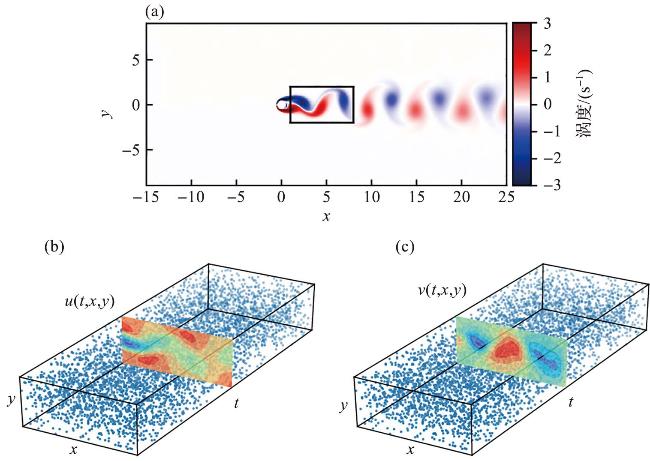
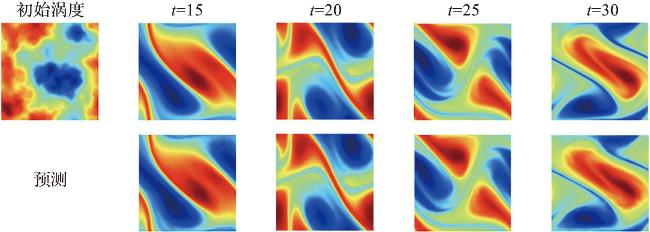
图8 PINN训练数据对应的圆柱体尾迹中的非对称旋涡脱落模式(图件改绘自文献[161]。图a表示Re=100时不可压缩流和动态涡脱落经过圆柱体时的涡度,所述时空训练数据对应于所描述的圆柱体尾迹中的矩形区域。图b和c表示流向和横向速度分量u(t,x,y)和v(t,x,t)的训练数据点位置。) Fig.8 Asymmetrical vortex shedding pattern in the cylinder wake to PINN training data (Figure is repainted from reference [161]. Figure a shows the incompressible flow and dynamic vortex shedding past a circular cylinder at Re=100. The spatio-temporal training data correspond to the depicted rectangular region in the cylinder wake. Figures b-c show the locations of training datapoints for the stream-wise and transverse velocity components, u(t, x, y) and v(t, x, t), respectively.) |