
0 引言
1 资料和方法
1.1 资料
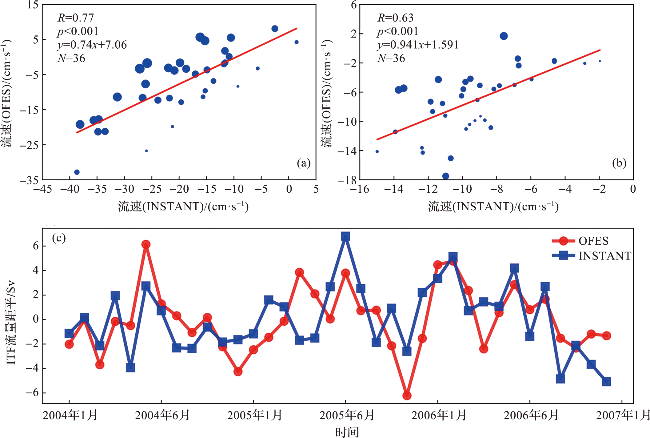
图1 翁拜海峡(a)和帝汶通道(b)的INSTANT观测和OFES模拟的上750 m平均流速以及INSTANT观测和OFES模拟的ITF流量距平(c)(在图a和b中,流速正值表示向东,流速负值表示向西,后文同此。蓝色圆点的大小代表观测和模拟之差的绝对值,红色线为最小二乘法拟合曲线。) Fig.1 The average velocity above 750 m was observed by INSTANT and simulated by OFES in the Ombai Strait (a) and the Timor Channel (b)and ITF transport anomaly observed by INSTANT and simulated by OFES (c) (In fig.a and b, positive flow velocity values indicate eastward flow, while negative values indicate westward flow, the same applies to the following text. Sizes of blue dots denote the absolute values of the difference between observation and OFES, and the red line shows the least square fitting.) |
1.2 方法
2 结果
2.1 潜流的基本特征及来源
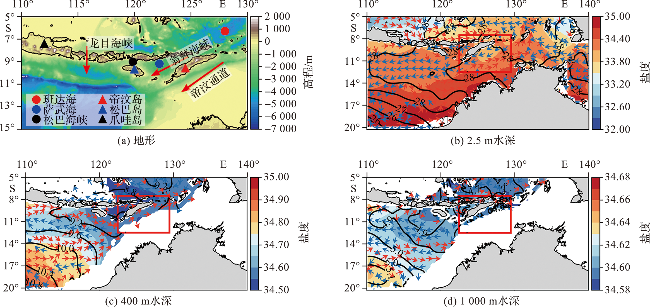
图2 ITF出流海区的地形图(a)和不同深度(b~d)的海流、海温、盐度(图a中,红色箭头指示表层流方向。图b~d中,红色框表示研究区;箭头表示海流,数据来自OFES;等值线表示海温,数据来自WOA18;填色表示盐度,数据来自WOA18。) Fig.2 Topography (a) and currents, temperature and salinity at different depths (b-d)in the ITF outflow region (In fig.a,red arrows represent the direction of surface currents. In fig.b-d, arrows represent currents, data from OFES; contour line represents temperature, data from WOA18; color filling represents salinity, data from WOA18.) |
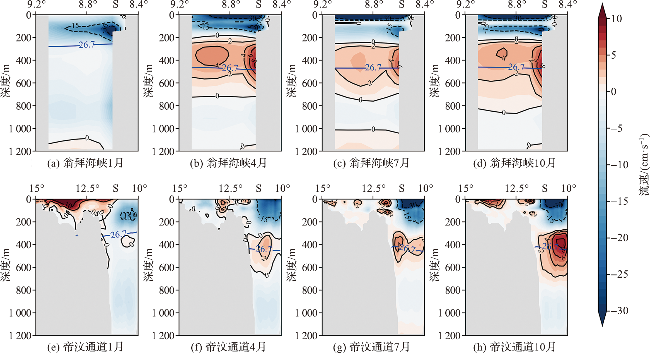
图3 124°E断面翁拜海峡(a~d)和帝汶通道(e~h)OFES的纬向流速(黑色等值线为流速,实线表示正值,虚线表示负值;蓝色等值线为26.7σθ等位势密度线。) Fig.3 Zonal velocities of OFES in the Ombai Strait(a-d) and the Timor Channel(e-h)across the 124°E section (The black contour lines represent the velocity, where solid lines represent positive values and dashed lines represent negative values; the blue contour line represents the 26.7σθ potential density line.) |
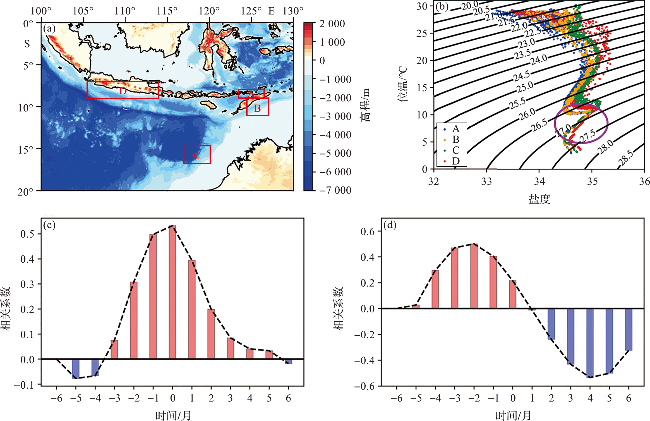
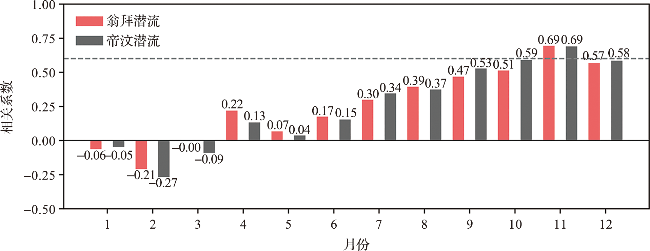
图5 在印尼贯穿流(ITF)出流区的地形和四个关键区域(a);A、B、C、D四个区域的温-盐图(b);南爪哇潜流(SJUC)与翁拜潜流的超前-滞后相关(c);西北陆架水(NWS)与帝汶潜流的超前-滞后相关(d)(温、盐和流场数据均来源于OFES。) Fig.5 Topography and four key regions in the ITF outflow region (a); T-S diagram of A、B、C and D regions (b); the lead-lag relationship of South Java Undercurrent (SJUC) and Ombai Undercurrent (c); the lead-lag relationship of Northwest Shelf (NWS) and Timor Undercurrent (d) (Temperature, salinity, and currents data are from the OFES.) |
2.2 次表层潜流的季节变化和年际变化特征
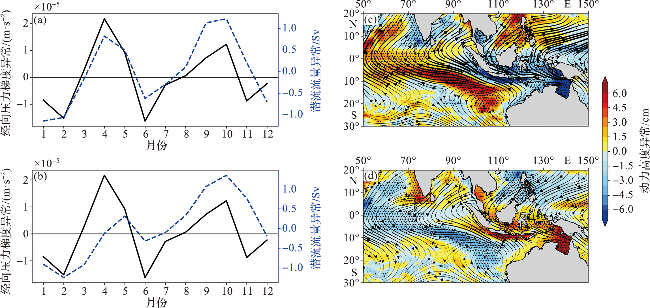
图6 翁拜海峡(a)、帝汶通道(b)次表层经向压力梯度异常和潜流流量异常以及流量正(c)、负(d)异常月份合成的AVISO动力高度异常和ERA5风场异常(压力梯度和潜流流量分别由WOA18温、盐和OFES流速计算得到。) Fig.6 Anomalies of meridional pressure gradient and undercurrent transports in the subsurface layer of the Ombai Strait (a) and the Timor Channel (b),the composite diagrams of absolute dynamic topography of AVISO and wind anomaly of ERA5 from months with positive (c) and negative (d) transport anomalies (The pressure gradient and undercurrent transports were calculated from WOA18 temperature, salinity and OFES velocity, respectively.) |
3 总结与讨论
表1 不同月份潜流的来源Tab.1 Sources of undercurrent in different months |
| 潜流名称 | 月份 | |||
|---|---|---|---|---|
| 1月 | 4月 | 7月 | 10月 | |
| 翁拜潜流 | SJUC | SJUC | SJUC | |
| 帝汶潜流 | 萨武海和卢温潜流 | SJUC和卢温潜流 | SJUC | |