
0 引言
1 数据与方法
1.1 数据
1.2 南海海洋热浪基本要素定义
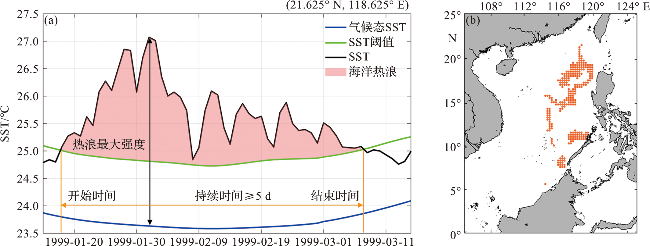
图1 海洋热浪定义示意图(a)及1999年1月18日南海海洋热浪空间分布(b)Fig.1 Schematic of metrics used to define a marine heatwave (a), and distribution of MHWs in the South China Sea on January 18, 1999 (b) |
表1 海洋热浪的基本特征要素Tab.1 The metrics to character marine heatwaves |
| 指标 | 定义 | 计算公式 | 单位 |
|---|---|---|---|
| θclim | 在一个时段内计算的气候态SST | ℃ | |
| m90 | 气候态SST的第90百分位数 | m90(j)=P90(X) | ℃ |
| tdur | 海洋热浪持续的时间 | tdur=te-ts | d |
| f | 海洋热浪发生的频次 | f=n | 次 |
| Imean | 平均强度,即在海洋热浪持续时间中的平均异常温度 | ℃ | |
| Icum | 累积强度,即从开始时间到结束时间内异常温度的总和 | ℃·d |
注:某日SST用θ(t)表示,θ(y, d)指第y年第d天的SST, j表示某天,ys和ye分别为气候态SST的开始日期和结束日期;P90为SST从低到高排列后的第90百分位数, ;ts和te分别为海洋热浪的开始日期和结束日期。 |
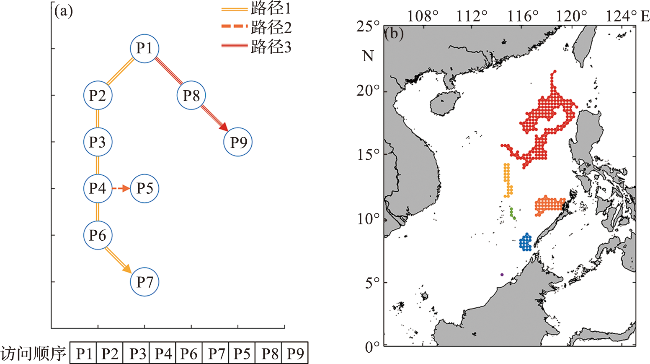
图2 深度搜索算法示例图(a)以及1999年1月18日海洋热浪事件面积示意图(b)(图a中不同颜色箭头代表不同访问顺序。图b中不同颜色代表不同的海洋热浪事件。) Fig. 2 Depth-first-search algorithm example diagram (a), and the area diagram of the MHWs events occurred on January 18, 1999 (b) (In fig.a, arrow paths indicate the visiting order. In fig.b, different colors represent different MHWs events.) |
2 结果与分析
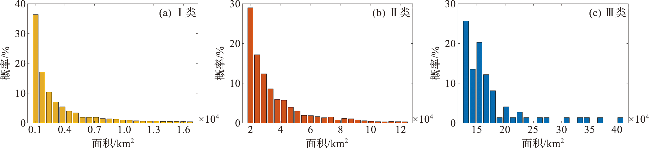
2.1 南海海洋热浪面积分类
表2 1990—2020年三种类型海洋热浪的基本特征Tab.2 The characteristics of three types of MHWs from 1990 to 2020 |
| 类别 | 占比/% | 总面积/km2 | 总次数/次 | 平均面积/km2 |
|---|---|---|---|---|
| Ⅰ类 | 94.20 | 161 175 000 | 51 445 | 3 133 |
| Ⅱ类 | 5.67 | 109 211 100 | 3 096 | 35 275 |
| Ⅲ类 | 0.13 | 12 783 900 | 74 | 172 755 |
2.2 南海海洋热浪面积特征分析
2.3 ENSO对不同空间尺度南海海洋热浪的影响
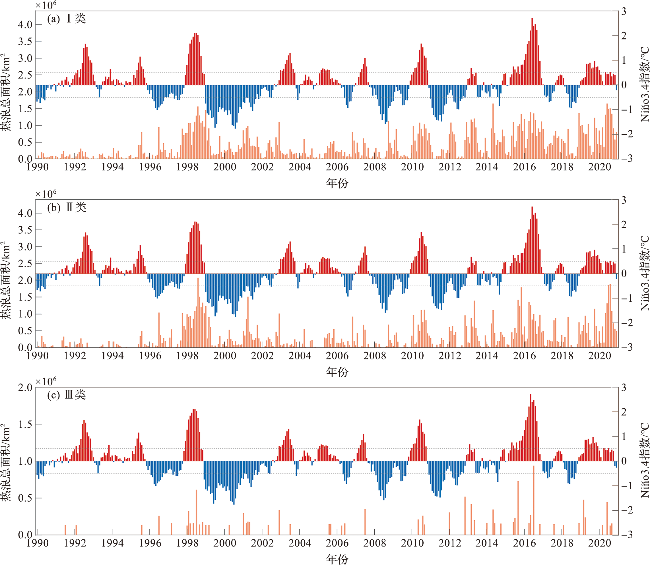
图7 1990—2020年南海三种类型海洋热浪每月发生的热浪总面积以及Niño3.4指数的时间序列(图中橙色代表海洋热浪每月发生的总面积,红色表示Niño3.4指数正值,蓝色表示Niño3.4指数负值,灰色虚线为Niño3.4指数的±0.5 ℃等值线。) Fig.7 The time series of monthly total area of the three types of MHWs in the South China Sea and the Niño3.4 index from 1990 to 2020 (The orange color denotes the monthly total area of MHWs, the red color denotes positive Niño3.4 index values, the blue color denotes negative Niño3.4 index values, the gray dashed lines denote ±0.5 ℃ Niño3.4 index.) |
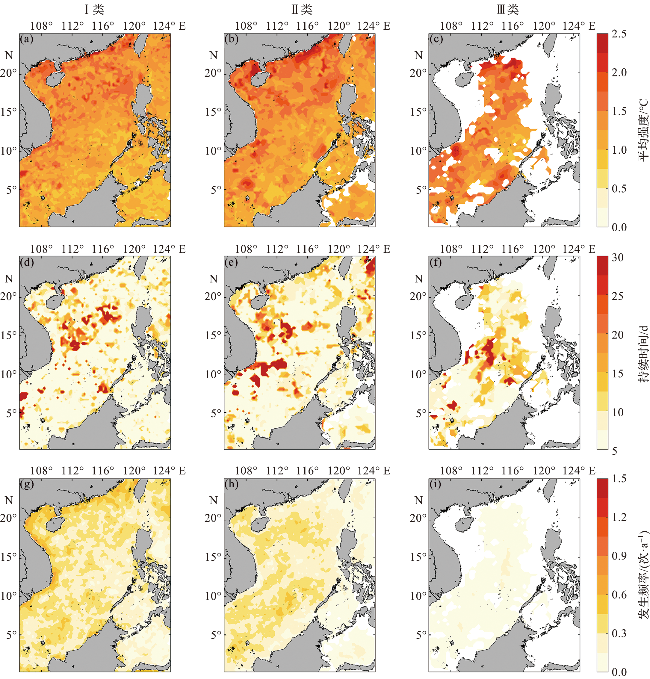
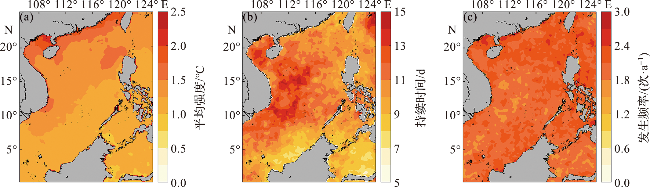
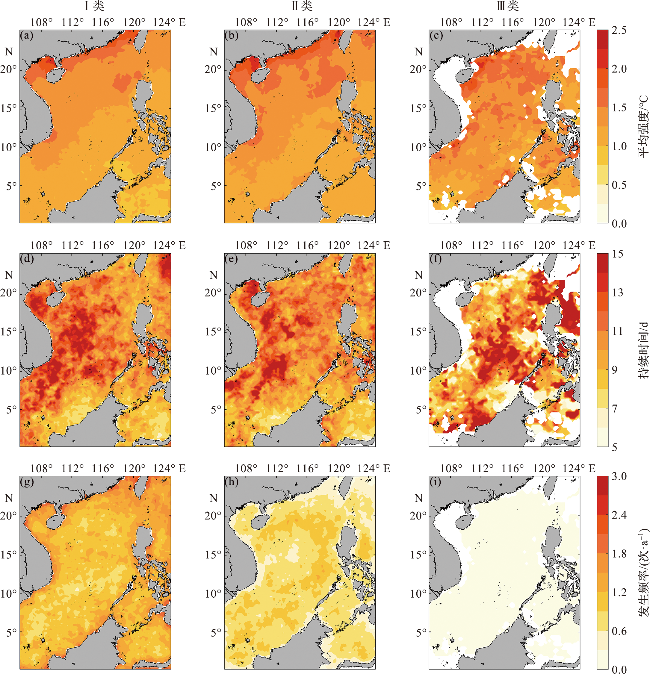
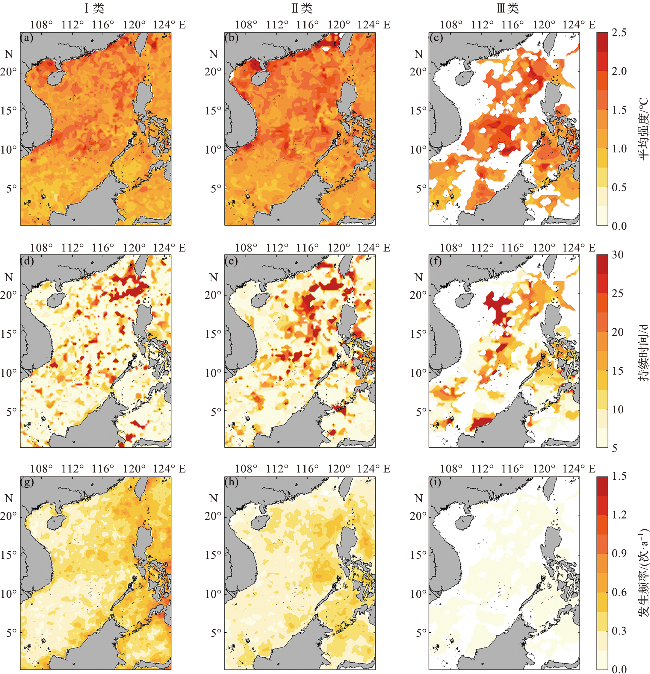
图9 厄尔尼诺事件期间南海三种类型海洋热浪的平均强度(a, b, c)、持续时间(d, e, f)以及发生频率(g, h, i)的空间分布Fig.9 The distribution of mean intensity (a, b, c), duration (d, e, f), frequency (g, h, i) of three types of MHWs in the South China Sea during El Niño events |