
0 引言
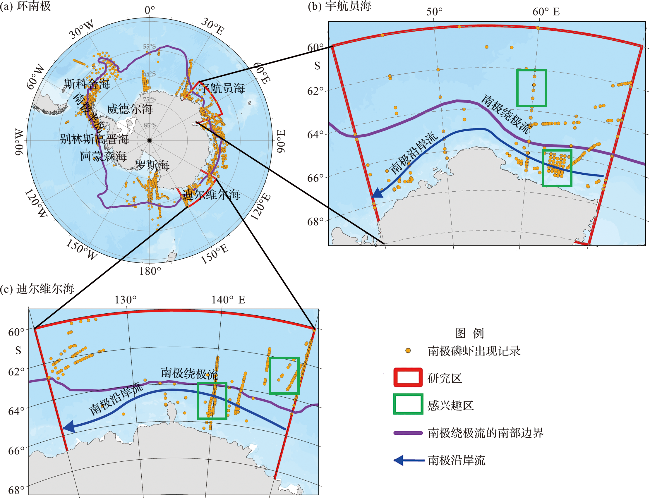
1 研究区与南极磷虾调查数据
2 数据与分析方法
2.1 遥感与再分析数据
表1 本研究使用的遥感与再分析数据参数信息Tab.1 Parameters information of satellite data and reanalysis data in this study |
| 环境参数 | 数据集 | 时间 分辨率 | 空间 分辨率 |
|---|---|---|---|
| 海面温度(SST) | AVHRR OI | 日均 | 0.25° |
| 海冰密集度(SIC) | Sea Ice Index (G02135) | 日均 | 25 km |
| 海面叶绿素质量浓度(CHL) | OC-CCI | 8 d | 4 km |
| 混合层深度(MLD) | C-GLORS | 日均 | 0.25° |
2.2 南极磷虾数据与环境参数的匹配
2.3 栖息地适宜性最大熵模型及精度评估指标
3 南极磷虾栖息地适宜性模型
3.1 时序特征参数构建
3.1.1 藻华物候时序特征参数构建
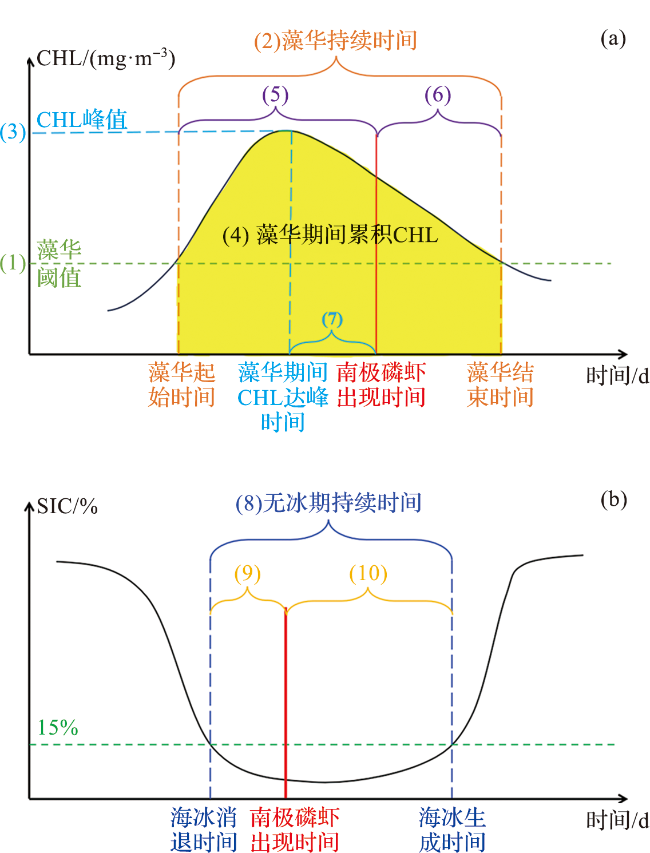
3.1.2 海冰消长时序特征参数构建
3.2 南极磷虾栖息地适宜性模型构建
表2 宇航员海与迪尔维尔海最大熵模型输入参数贡献率Tab.2 Input parameters contribution in Maxent model for the Cosmonauts Sea and the D’Urville Sea |
| 参数类型 | 定义 | 环境参数 | 贡献率百分比/% | |
|---|---|---|---|---|
| 宇航员海 | 迪尔维尔海 | |||
| 常规单一时刻 环境参数 | 混合层深度(MLD) | d/m | 11.5 | 16.5 |
| 海面温度(SST) | θ/℃ | 1.9 | 8.3 | |
| 叶绿素质量浓度(CHL) | ρ/(mg·m-3) | 7.2 | 15.3 | |
| 海冰密集度(SIC) | C/‰ | 0.0 | 2.0 | |
| 藻华与海冰 时序特征参数 | 无冰期持续时间 | tice-free/d | 12.4 | 7.6 |
| 藻华持续时间 | tBloomDur/d | 0.2 | 0.2 | |
| 藻华期间累积CHL | ρBloomInteg/(mg·m-3) | 12.4 | 0.6 | |
| 藻华期间CHL峰值 | ρBloomPeak/(mg·m-3) | 37.5 | 7.9 | |
| 南极磷虾出现与 时序特征参数时间差 | 南极磷虾出现时间距离海冰消退时间之间的天数 | tDATOR/d | 1.5 | 9.3 |
| 南极磷虾出现时间距离海冰生成时间之间的天数 | tDBTOA/d | 1.7 | 2.7 | |
| 南极磷虾出现时间距离藻华起始时间之间的天数 | tDABloomInit/d | 9.6 | 1.5 | |
| 南极磷虾出现时间距离藻华结束时间之间的天数 | tDBBloomTerm/d | 3.1 | 0.5 | |
| 南极磷虾出现时间距离藻华期间CHL达峰时间之间的天数 | tDABloomPeak/d | 1.1 | 27.7 | |
4 结果
4.1 南极磷虾出现记录与环境参数匹配数据的数值特征
4.1.1 南极磷虾出现时对应的单一时刻环境参数特征
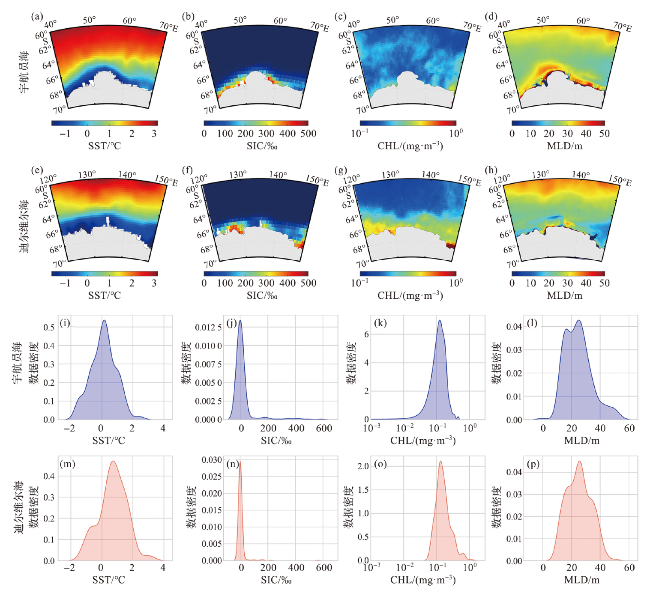
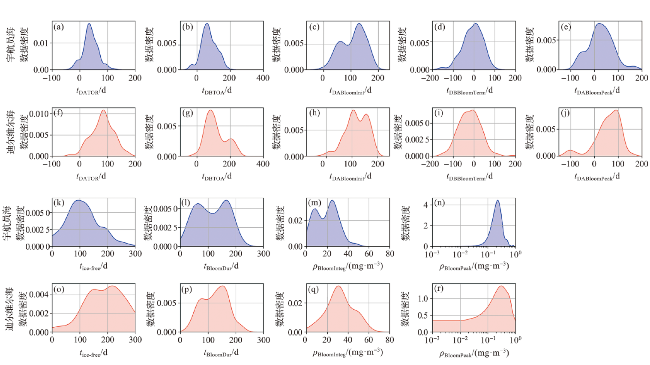
图4 宇航员海和迪尔维尔海夏季气候态环境参数分布 (a~h)及与南极磷虾出现记录匹配的单一时刻环境参数的数据分布密度图(i~p)Fig.4 Data distribution of climatology environmental parameters during austral summer (a-h) and kernal density of Antarctic krill presence matched single-moment environmental parameters (i-p) in the Cosmonauts Sea and the D’Urville Sea |
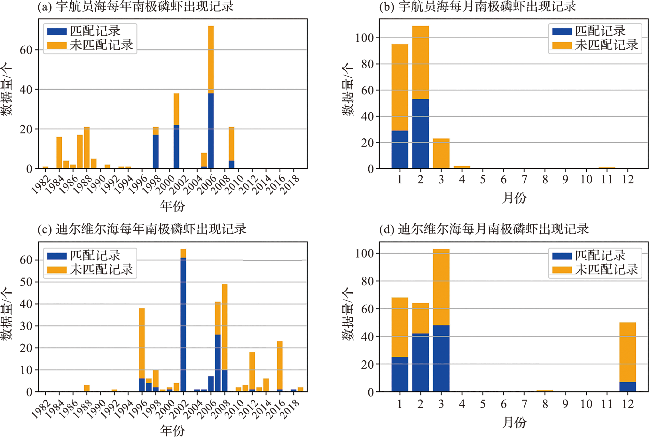
4.1.2 南极磷虾出现时对应的时序特征参数
4.2 南极磷虾年内首次出现时间和出现总天数的长时序变化分析
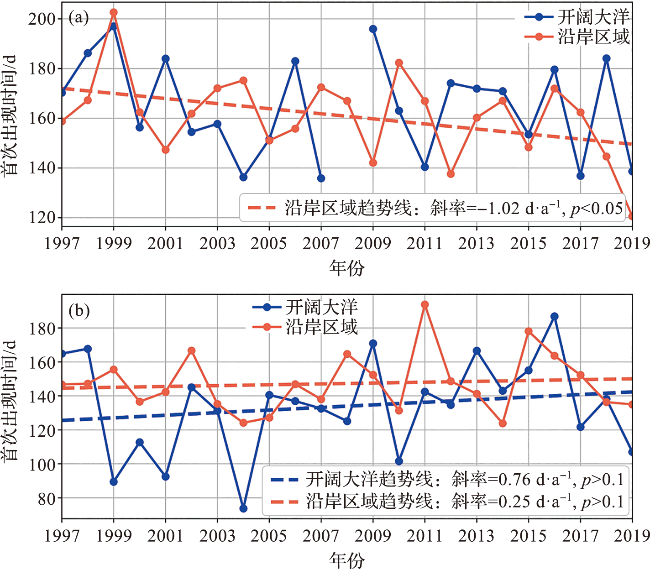
图6 1997—2019年宇航员海(a)和迪尔维尔海(b)沿岸及开阔大洋感兴趣区域南极磷虾年内首次出现时间的年际变化图(感兴趣区域选取见图1。) Fig.6 Interannual variation of Antarctic krill first appearance dates of the regions of interest (ROIs) in the coastal area and open ocean of the Cosmonauts Sea (a) and the D’Urville Sea (b) from 1997 to 2019 (Range of ROIs can be seen in Fig.1.) |
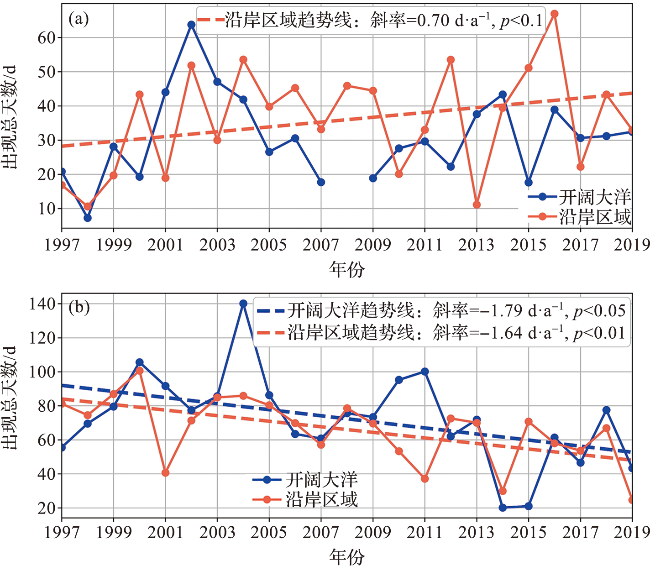
图7 1997—2019年宇航员海(a)和迪尔维尔海(b)沿岸及开阔大洋感兴趣区域南极磷虾出现总天数年际变化图(感兴趣区域选取见图1。) Fig.7 Interannual variation of Antarctic krill total present days of the regions of interest (ROIs) in the coastal area and open ocean of the Cosmonaut Sea (a) and the D’Urville Sea (b) from 1997 to 2019 (Range of ROIs can be seen in Fig.1.) |
5 环境变化对南极磷虾分布的长时序影响机制讨论
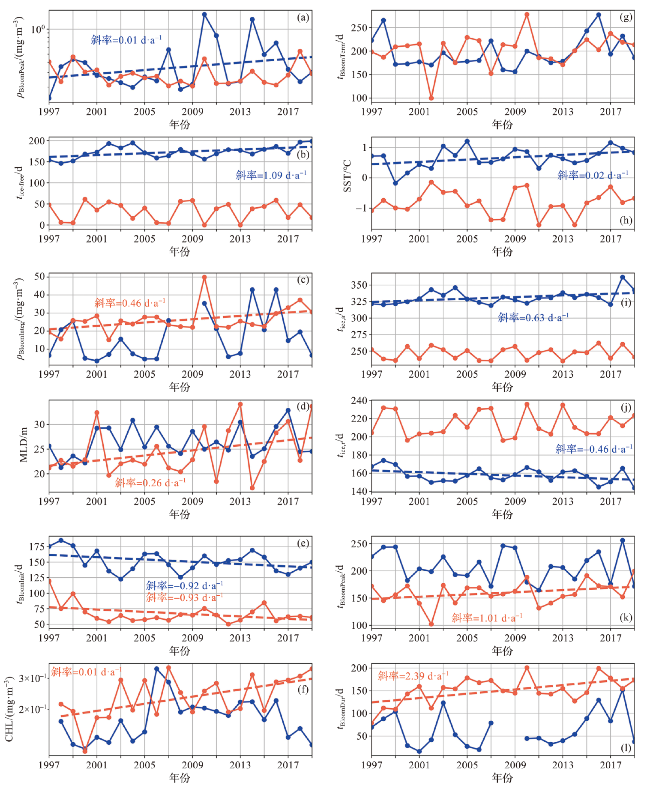
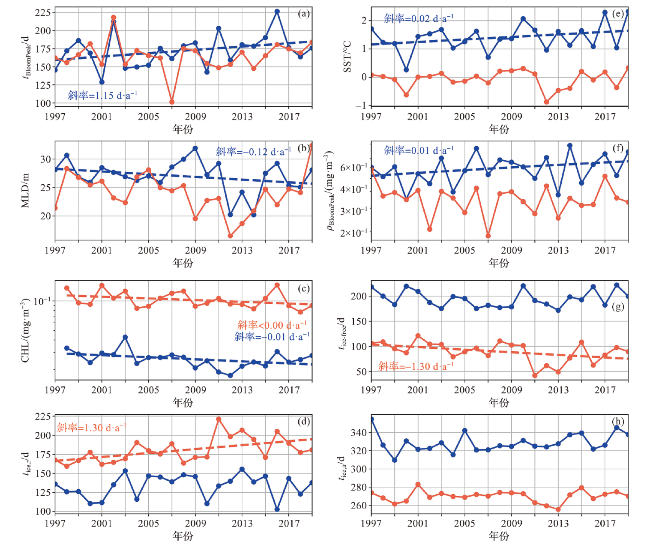
图8 1997—2019年宇航员海感兴趣区域建模环境参数年际变化折线图(蓝线表示开阔大洋区域,红线表示沿岸区域,虚线为通过显著性检验的趋势线(p<0.1)。感兴趣区域位置见图1。) Fig.8 Interannual variation of modeling environmental parameters of ROIs in the Cosmonauts Sea from 1997 to 2019 (Blue line represents open ocean and red line represents coastal area. The dashed line represents the trend line that has passed the significance test (p<0.1). Range of ROIs can be seen in Fig.1.) |
图9 1997—2019年迪尔维尔海感兴趣区域主要建模环境参数年际变化折线图(蓝线表示开阔大洋区域,红线表示沿岸区域,虚线为通过显著性检验的趋势线(p<0.1)。感兴趣区域位置见图1。建模环境参数SIC由于多为0值,不具有明显趋势特征,故在图中未画出。) Fig.9 Interannual variation of main modeling environmental parameters of ROIs in the D’Urville Sea from 1997 to 2019 (Blue line represents open ocean and red line represents coastal area. The dashed line represents the trend line that has passed the significance test (p<0.1). Range of ROIs can be seen in Fig. 1. The modeling input parameter SIC is primarily comprised of zero values and does not exhibit significant trend characteristics, therefore, it is not plotted.) |