
0 引言
1 研究区概况
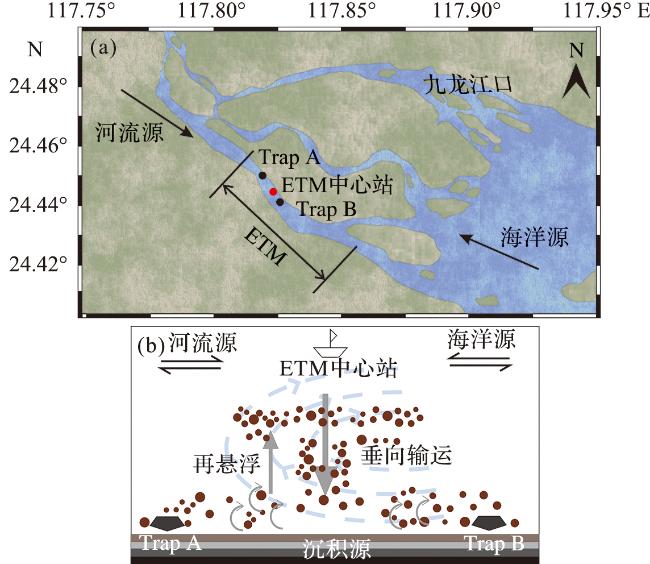
图1 九龙江口ETM概况及采样站位设置图(a)以及ETM内POC主要输运过程和河口环流示意图(图1a中的Trap A和Trap B表示沉积物捕获器站位,图1b中的带箭头虚线表示河口环流。) Fig.1 Overview of the estuarine turbidity maximum (ETM) at the Jiulong River Estuary and sampling stations (a), and the schematic diagram of the main POC transport processes and estuarine circulation within the ETM (In Fig.1a, Trap A and Trap B represent sediment trap stations. In Fig.1b, the dashed lines with arrows indicate estuarine circulation.) |
2 方法与材料
2.1 现场观测与样品收集
2.2 有机碳及其同位素实验室分析
2.3 数据分析
2.3.1 总悬浮颗粒物(TSM)质量浓度的计算
2.3.2 表、底层水样中POC质量浓度的计算
2.3.3 颗粒沉降通量的计算
2.3.4 ETM内不同来源POC贡献的计算原理与方法
2.3.5 盐度层化系数的计算
2.3.6 经验正交函数分析
3 结果
3.1 九龙江口ETM水文参数观测结果
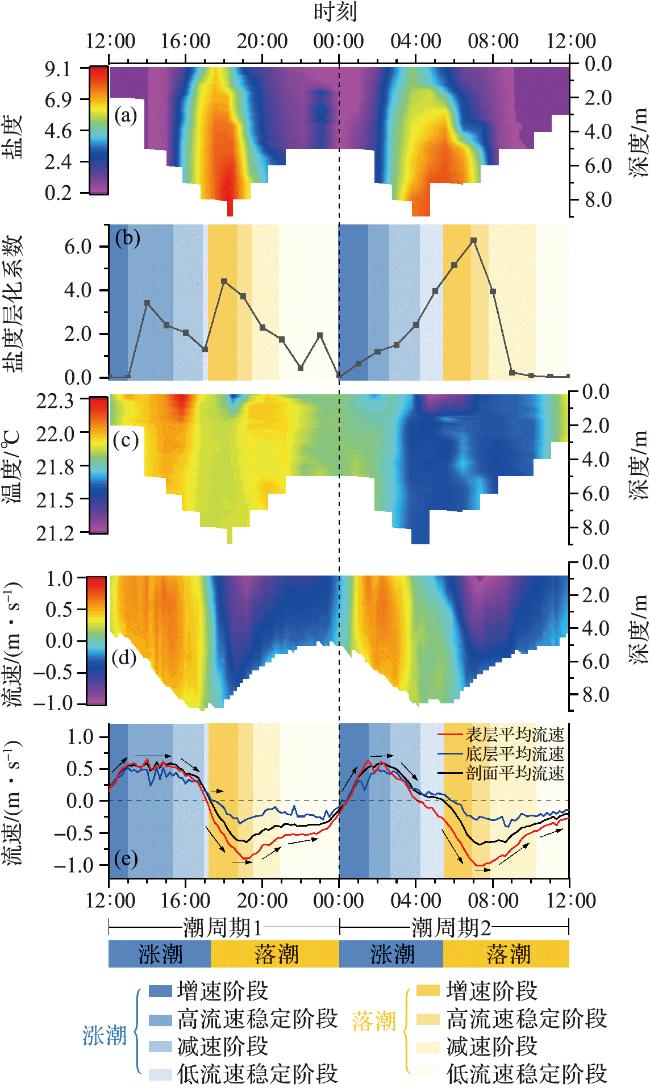
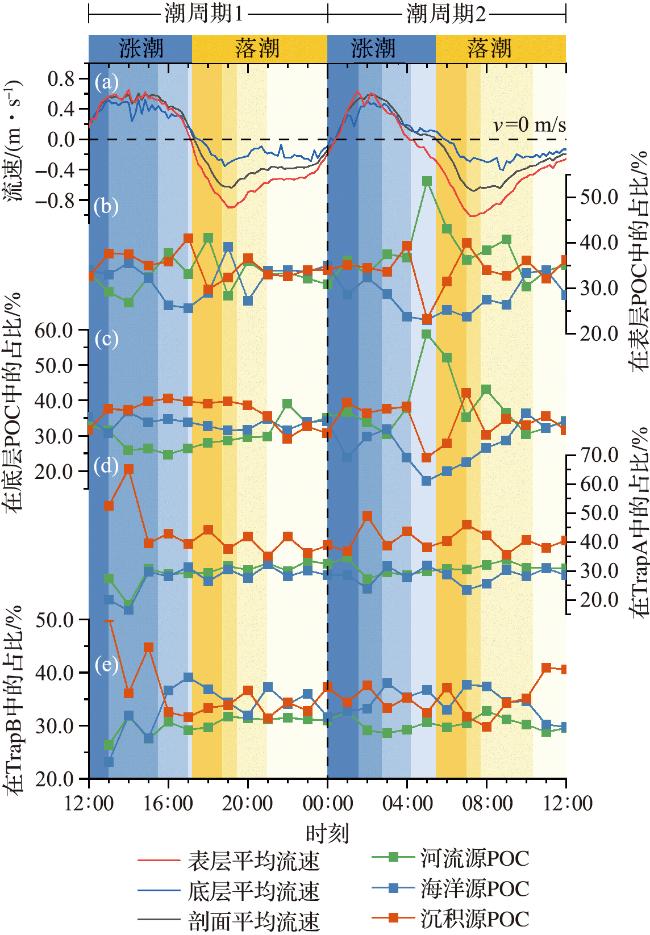
图2 两个潮周期内ETM的水文参数观测结果(a:盐度;b:盐度层化系数;c:CTD测得的水温;d:ADCP测得的潮流 剖面速度;e:潮流平均流速,其中剖面平均流速为对应时刻ADCP 测得全水柱流速的平均值。) Fig.2 Observation results of ETM hydrological parameters in two tidal cycles (a: salinity; b: salinity stratification coefficient; c: temperature measured by CTD; d:tidal current profile velocity measured by ADCP; e: average velocity of tidal current, where the profile-averaged velocity is the average value of total water column velocity measured by ADCP at the corresponding time.) |
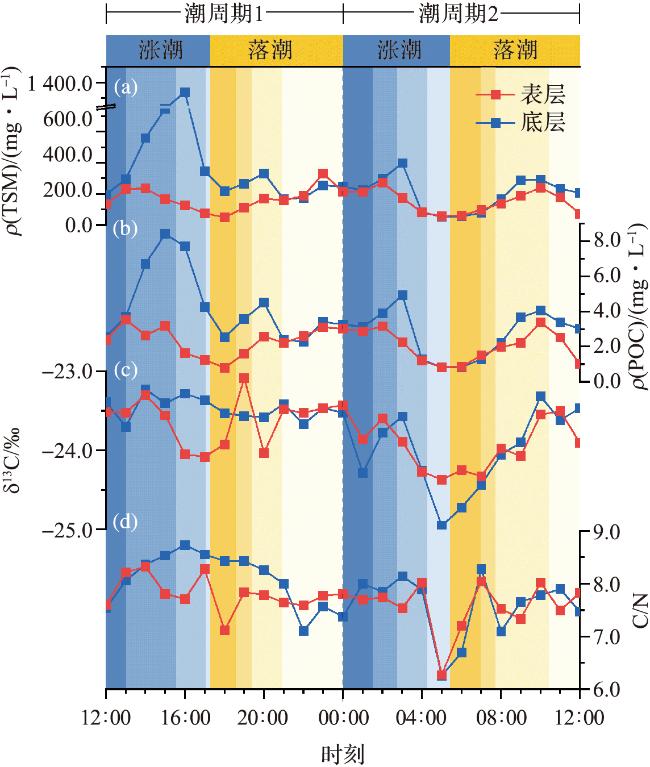
3.2 总悬浮颗粒有机碳质量浓度及其同位素特征
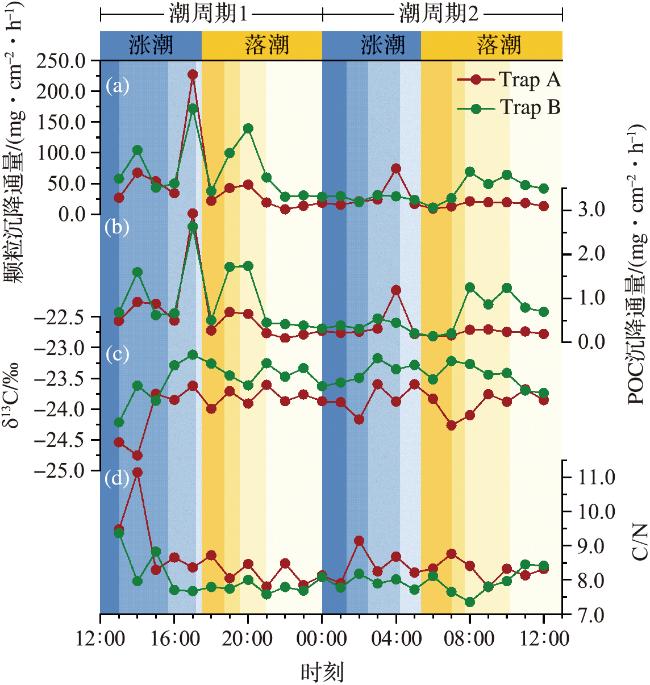
3.3 沉降颗粒有机碳沉降通量及其同位素特征
3.4 基于蒙特卡洛模型的端元分析结果
3.5 EOF分析结果
表2 EOF分析主要模式的特征值与TSM和POC质量浓度之间的皮尔逊相关系数Tab.2 Pearson correlation coefficient between EOF characteristic weighted parameter and TSM and POC mass concentration |
| 主要模式 | 质量浓度 | |||
|---|---|---|---|---|
| 表层TSM | 底层TSM | 表层POC | 底层POC | |
| 模式1 | 0.38 | 0.55* | 0.47* | 0.66* |
| 模式2 | -0.56* | 0.17 | -0.58* | 0.01 |
| 模式3 | 0.02 | 0.20 | 0.06 | 0.29 |
注:*表示具有显著相关性,显著性水平为p<0.01。 |
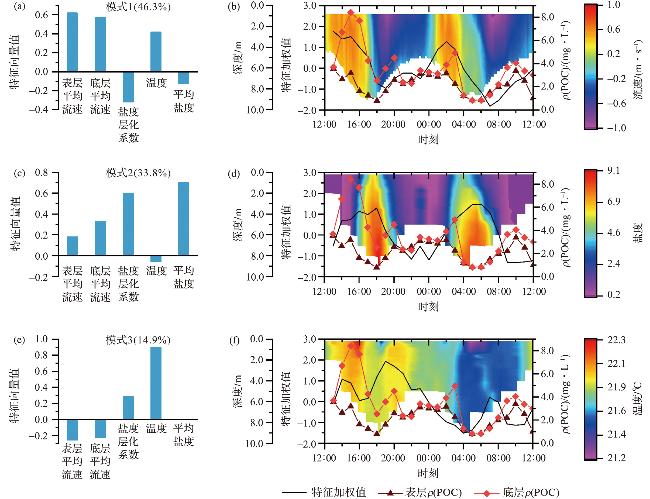
图6 EOF分析结果(图6a、6c和6e分别展示了模式1~模式3的5个变量的特征向量值。图6b、6d和6f分别展示了模式1~模式3特征加权值的时间序列及其与表、底层POC质量浓度时间序列的对比关系;其中的背景分别为模式1~模式3对应的特征向量值最显著的变量剖面值。) Fig.6 Results of EOF analysis (Figures 6a, 6c, and 6e show the EOF loadings values of the five variables for Mode 1 to Mode 3, respectively. Figures 6b, 6d, and 6f display corresponding principal component (PC) time series for each mode, compared with the time series of surface and bottom POC mass concentrations. The background in these subplots shows the depth profiles of the variable with the highest absolute loading in each respective mode.) |
4 讨论
4.1 潮流流速对POC质量浓度和物源的影响
4.2 ETM内不同潮汐阶段POC的输运模型
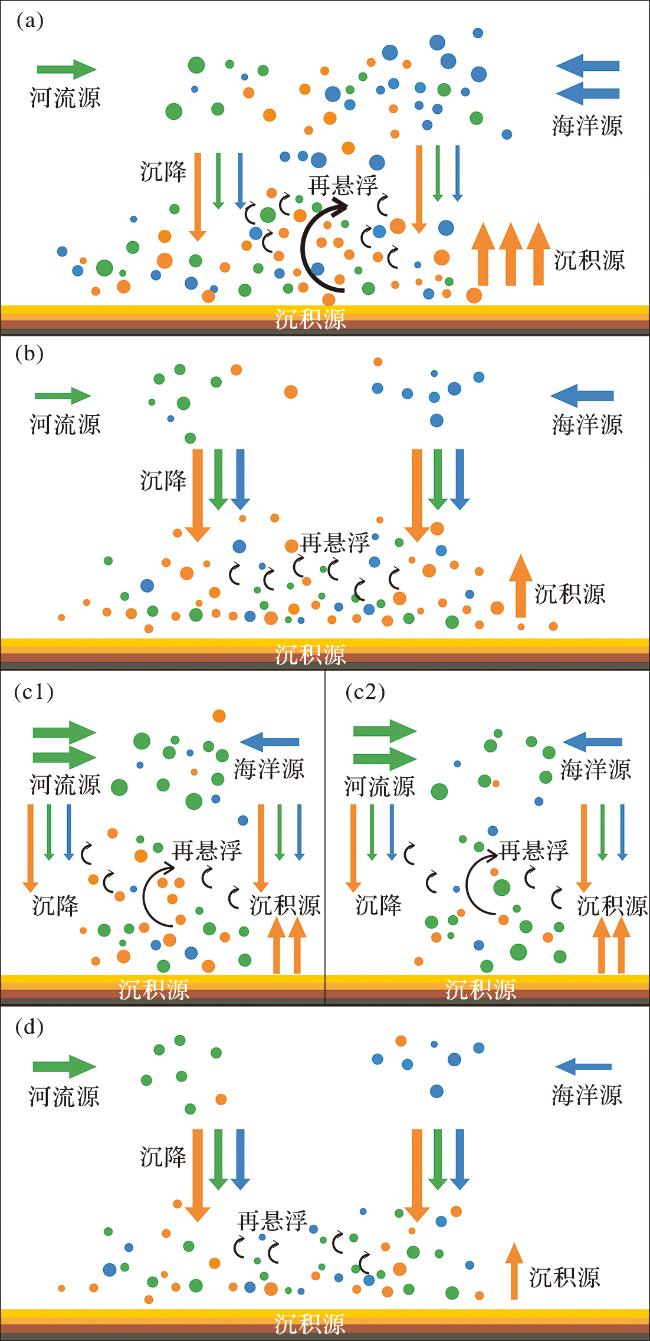
图7 不同潮汐阶段ETM内POC随潮流速度变化的输运模式示意图(a:涨潮期;b:高平潮期;c:落潮期,其中c1的前序涨潮期高流速持续时长较c2的长;d:低平潮期。箭头的颜色和方向代表不同动力和POC输运过程:绿色为落潮过程(水平箭头)和河流源POC沉降(垂向箭头),蓝色为涨潮过程(水平箭头)和海洋源POC沉降(垂向箭头),橙色箭头为沉积源POC的再悬浮或沉降(垂向箭头),黑色箭头为再悬浮过程。箭头的数量与粗细代表不同过程的强弱程度:箭头数量愈多、越粗,代表该过程强度越强。圆点颜色代表不同来源POC:绿色圆点为河流源POC,蓝色圆点为海洋源POC,橙色圆点为沉积源POC。圆点数量的相对多寡,指示了不同物源POC的相对占比大小,数量越多表示相对占比越高。但圆点尺寸仅为不同粒径颗粒组成的定性示意,不表征不同粒径颗粒的具体定量占比。) Fig.7 Conceptual schematics of POC transport processes at different tide stages within the ETM (a: flood tide stage; b: high-slack tide stage; c: ebb tide stage, with the duration of high flow velocity during the pre-flood tide phase in c1 longer than that in c2; d:low-tide slack tide stage. The different colors and directions of the arrows represent different dynamic processes and POC transport pathways: green arrows denote the ebb tide process (horizontal) and the sinking of riverine POC (vertical), blue arrows denote the flood tide process (horizontal) and the sinking of marine POC (vertical), orange arrows denote the sinking of sedimentary POC (vertical), and black arrows denote the resuspension process. The number and thickness of the arrows indicate the strength of these processes: more and thicker arrows represent a stronger intensity of the process. The dot color represents different sources of POC: green dots denote fluvial POC, blue dots denote marine POC, and orange dots denote sedimentary POC. The dot number presents the relative contribution of different sources of POC. The more dots present the higher the relative proportion. However, the dot dimensions serve only as a qualitative illustration of the multi-sized particle composition, not as a measure of their proportional distribution.) |