海洋学研究 ›› 2023, Vol. 41 ›› Issue (3): 1-13.DOI: 10.3969/j.issn.1001-909X.2023.03.001
• 研究论文 • 下一篇
海水硝酸盐跃层深度计算方法研究
孟宇1,2( ), 陈双玲1,2,*()
- 1.自然资源部第二海洋研究所,浙江 杭州 310012
2.卫星海洋环境动力学国家重点实验室, 浙江 杭州 310012
-
收稿日期:2023-01-19修回日期:2023-05-23出版日期:2023-09-15发布日期:2023-10-24 -
通讯作者:*陈双玲(1988—),女,副研究员,主要从事水色卫星遥感和海洋碳循环方面的研究,E-mail: slchen@sio.org.cn。 -
作者简介:孟宇(1999—),女,山东省德州市人,主要从事卫星遥感反演海洋新生产力方面的研究,E-mail:mengyu@sio.org.cn。 -
基金资助:国家自然科学基金项目(42030708);国家自然科学基金项目(42276184);国家自然科学基金项目(41906159)
Quantification of nitracline depth in seawater
MENG Yu1,2(), CHEN Shuangling1,2,*()
- 1. Second Institute of Oceanography, MNR, Hangzhou 310012, China
2. State Key Laboratory of Satellite Ocean Environmental Dynamics, Hangzhou 310012, China
-
Received:2023-01-19Revised:2023-05-23Online:2023-09-15Published:2023-10-24
摘要:
硝酸盐是海洋中浮游植物生命活动可利用的主要氮形态,其跃层深度(ZN)会直接影响硝酸盐垂向输送、海洋初级生产力以及海洋碳循环。随着海洋观测技术的不断发展,硝酸盐剖面数据的采集呈现多样化,包括船基CTD观测和生物地球化学浮标BGC-Argo自动观测等,且垂向采样分辨率差异较大(CTD较低,BGC-Argo较高)。针对不同采样数据,亟需对硝酸盐跃层深度计算方法进行系统且定量化的对比分析研究。本文利用西北太平洋历史船测CTD数据和BGC-Argo浮标数据,采用差值法、梯度法和阈值法分别计算对应硝酸盐跃层深度。研究结果表明:就单一硝酸盐剖面,基于BGC-Argo数据,差值法计算的ZN与目视解译的ZN相差仅为0.2 m,阈值法次之为20.0 m,梯度法相差最大为202.8 m;基于CTD数据,差值法计算的ZN与目视解译的ZN相差2.0 m,阈值法相差49.0 m,梯度法相差155.0 m。相较于梯度法和阈值法,差值法计算的ZN与目视解译的ZN相差最小。根据误差统计分析结果发现,基于BGC-Argo数据,三种方法计算得到的ZN与目视解译的ZN均呈现良好相关性,其中差值法计算结果误差最小(R2为0.77,RMSE为28.48 m),阈值法的R2为0.64,RMSE为34.85 m,梯度法的R2为0.52,RMSE为53.80 m;对于CTD数据,由于其垂向采样分辨率较低,三种方法计算得到的ZN与目视解译的ZN相差较大,但相比于梯度法和阈值法,差值法的误差仍最小(R2为0.81,RMSE为16.13 m),阈值法的R2为0.47,RMSE为27.65 m,梯度法的R2为0.42,RMSE为36.41 m。通过对比分析各方法的特点和差异性,初步探究了各方法的适用性,可为深入研究硝酸盐垂向分布特征和向上输运过程提供科学参考。
中图分类号:
引用本文
孟宇, 陈双玲. 海水硝酸盐跃层深度计算方法研究[J]. 海洋学研究, 2023, 41(3): 1-13.
MENG Yu, CHEN Shuangling. Quantification of nitracline depth in seawater[J]. Journal of Marine Sciences, 2023, 41(3): 1-13.

图1 实测数据采样站点空间分布图
Fig.1 Spatial distribution of the sampling stations of in-situ data
| 数据类型 | 时间范围 | 总站位数/个 | 预处理后站位数/个 | 数据利用率/% |
|---|---|---|---|---|
| CTD | 2002-01-18—2019-08-02 | 3 526 | 383 | 10.86 |
| BGC-Argo | 2013-03-01—2017-02-24 | 427 | 159 | 37.24 |
表1 BGC-Argo和CTD站位数据统计
Tab.1 Data statistics of BGC-Argo and CTD sampling sites
| 数据类型 | 时间范围 | 总站位数/个 | 预处理后站位数/个 | 数据利用率/% |
|---|---|---|---|---|
| CTD | 2002-01-18—2019-08-02 | 3 526 | 383 | 10.86 |
| BGC-Argo | 2013-03-01—2017-02-24 | 427 | 159 | 37.24 |

图2 三种硝酸盐跃层深度的计算方法示意图 (cMLD为剖面中混合层深度的硝酸盐浓度,ci为剖面上第i个数据点的硝酸盐浓度,ci-1为剖面上第i-1个数据点的硝酸盐浓度,Δc1为ci-1与cMLD的差值,Δc2为ci与cMLD的差值,d2c/d z i + 1 2为硝酸盐浓度的二阶导数剖面上第i+1个点对应数值,σi和 σ i - 1分别为剖面上第i个和第i-1个点的位势密度。)
Fig.2 Schematic diagrams of three nitracline depth calculation methods (cMLD represents the nitrate concentration of the MLD point of the profile, ci represents the nitrate concentration of the ith data point of the profile, ci-1 is the nitrate concentration of the (i-1)th data point, Δc1 is the difference between ci-1 and cMLD, Δc2 is the difference between ci and cMLD, d2c/d z i + 1 2 is the (i+1)th data point on the second derivative profile of nitrate concentration, σi and σi-1 represent the potential density of the ith and (i-1)th point, respective.)
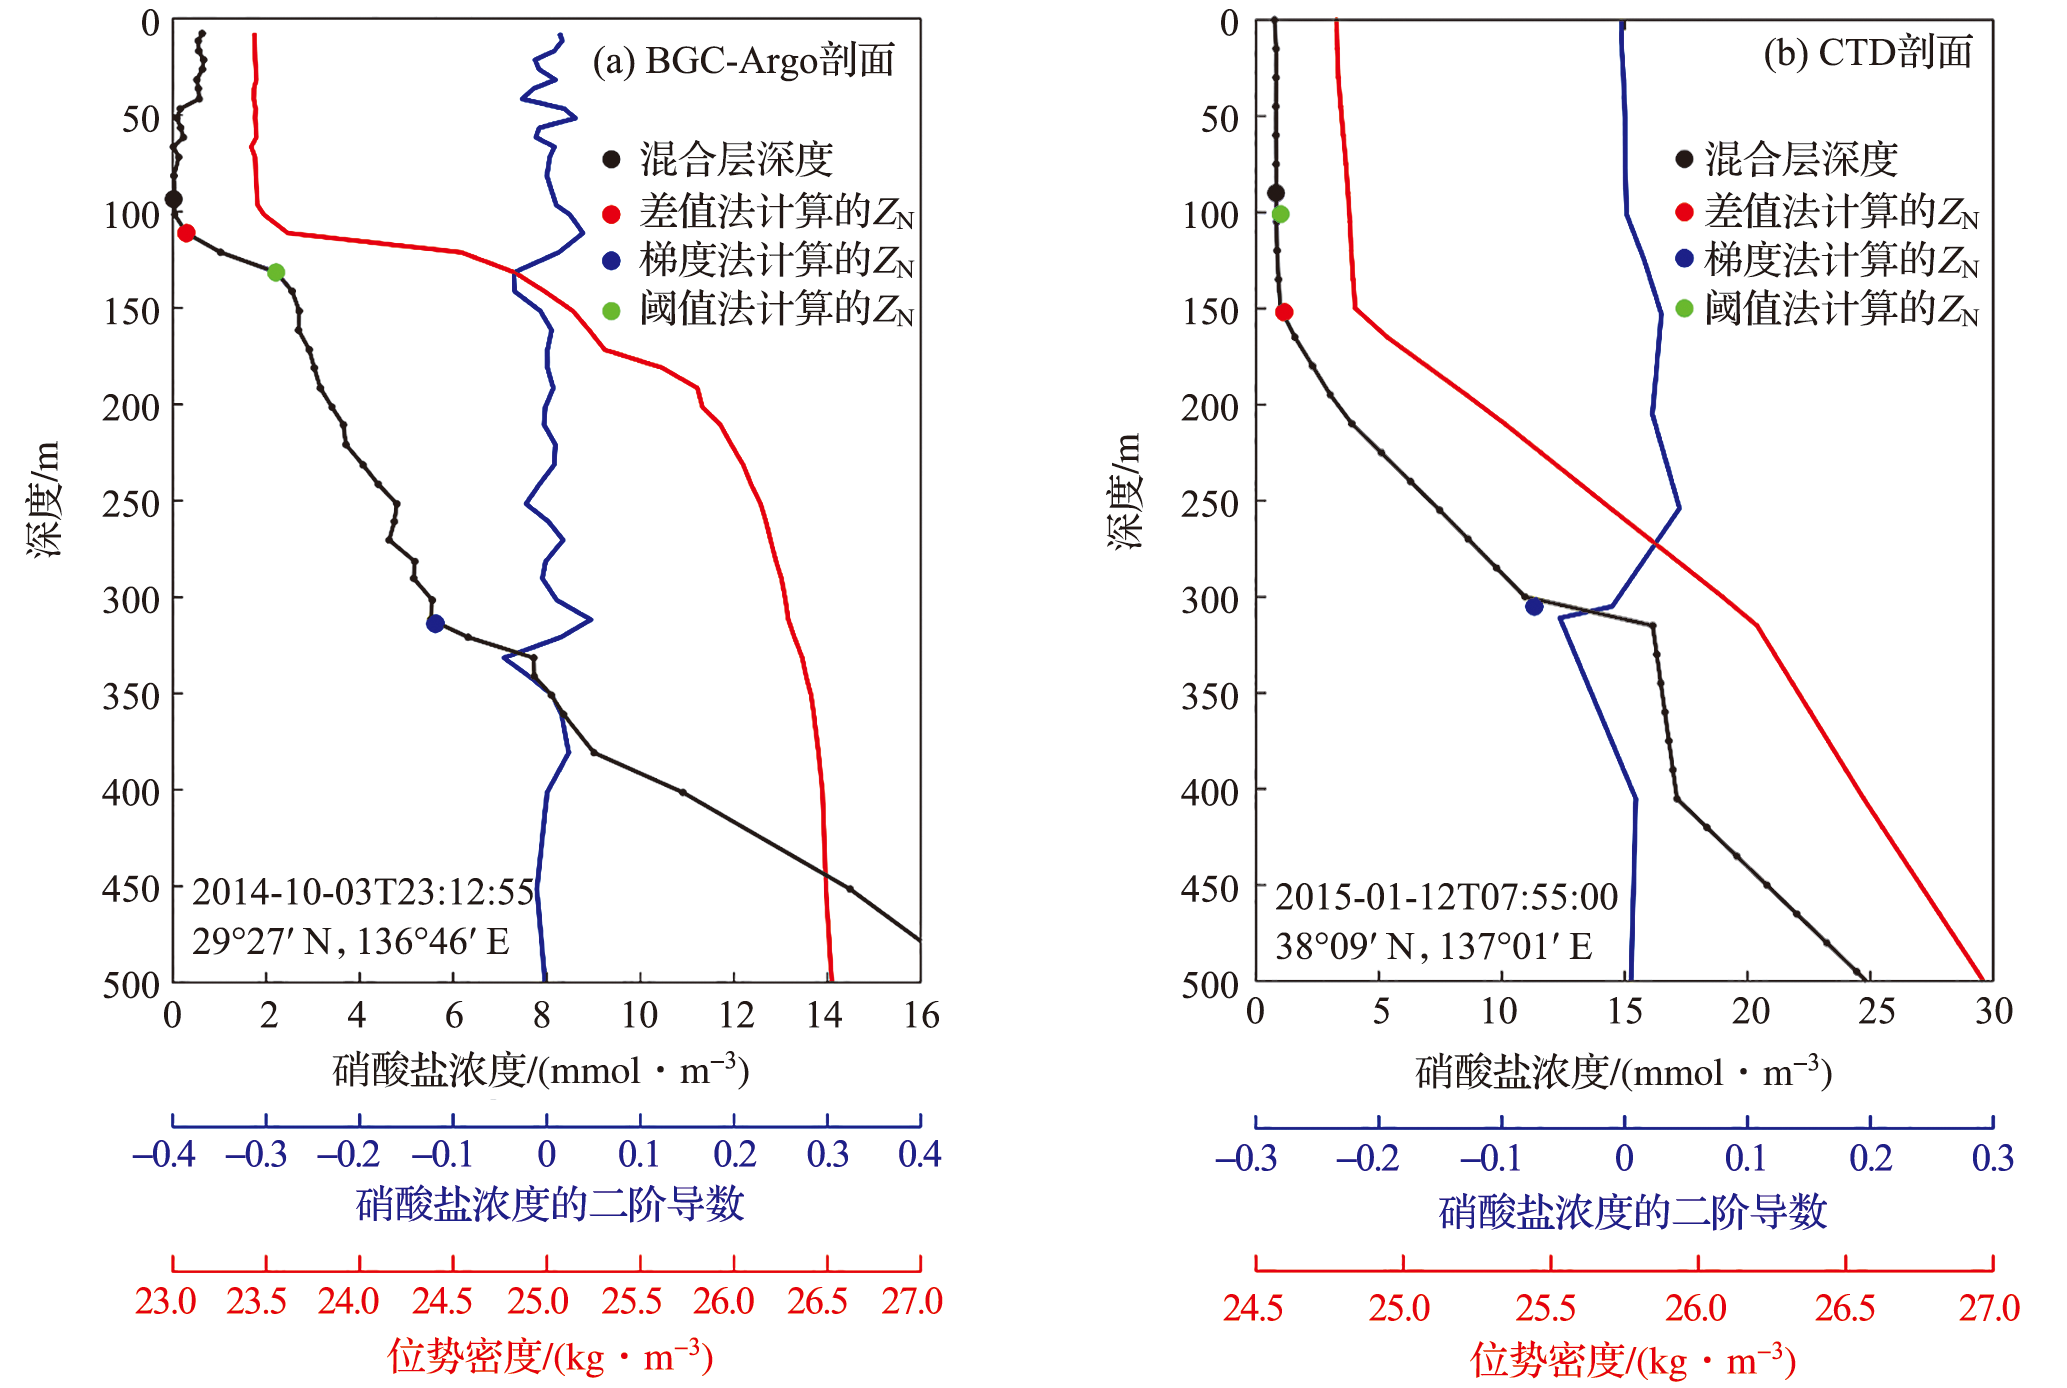
图3 针对单一剖面三种方法计算得到的硝酸盐跃层深度
Fig.3 The nitracline depth calculated by the three methods for a single profile
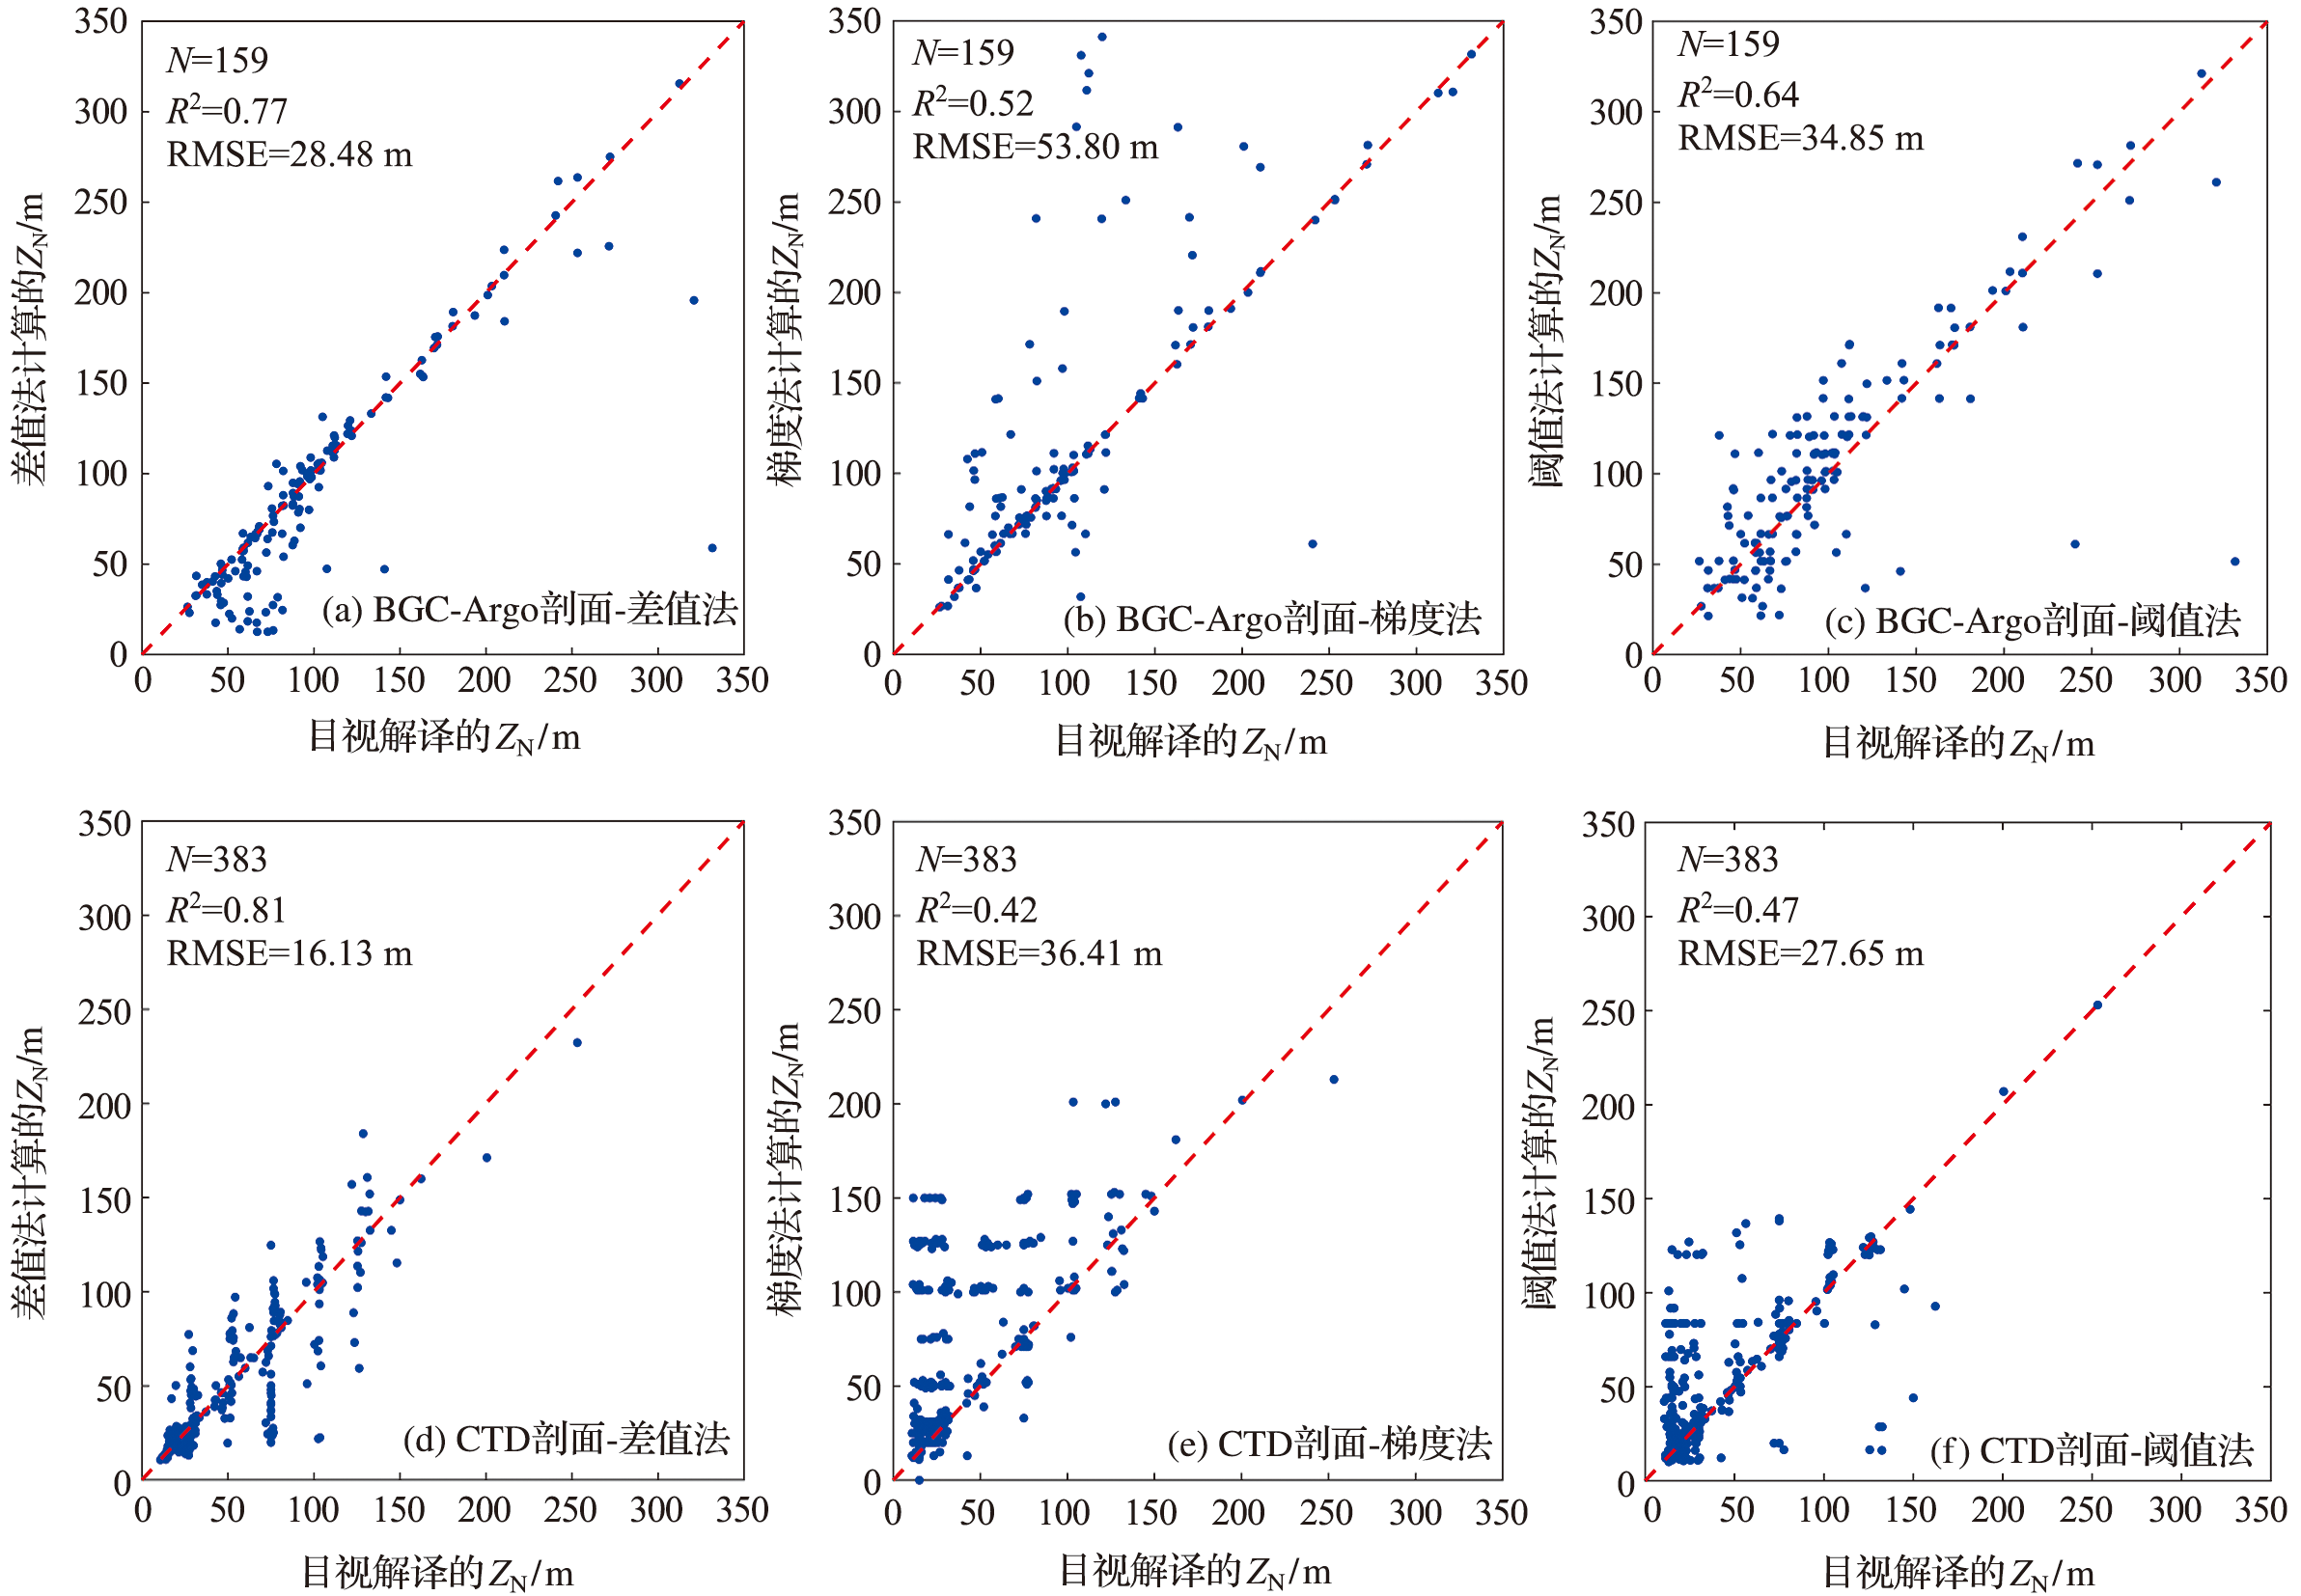
图4 三种方法计算的硝酸盐跃层深度与目视解译硝酸盐跃层深度的比较 (N为数据量,R2为决定系数,RMSE为均方根偏差。)
Fig.4 Comparison of the ZN calculated by the three methods with the observed ZN (N is the amount of data, R2 is the coefficient of determination, and RMSE is the root mean square difference.)
| 统计参数 | 目视解译法 | 差值法 | 阈值法 | 梯度法 |
|---|---|---|---|---|
| R2 | 0.82 | 0.78 | 0.71 | 0.68 |
| RMSE/m | 14.06 | 15.12 | 19.05 | 20.06 |
表2 JOO模型计算的硝酸盐跃层深度与目视解译以及其他三种方法计算结果的对比统计
Tab.2 Comparison of the ZN calculated by the JOO model with the results of observed and other three methods calculated
| 统计参数 | 目视解译法 | 差值法 | 阈值法 | 梯度法 |
|---|---|---|---|---|
| R2 | 0.82 | 0.78 | 0.71 | 0.68 |
| RMSE/m | 14.06 | 15.12 | 19.05 | 20.06 |
| [1] | 张建平, 康建成, 任惠茹, 等. 东海北部营养盐分布的季节变化及成因探讨[J]. 海洋科学, 2010, 34(1):35-43. |
| ZHANG J P, KANG J C, REN H R, et al. Seasonal variation and causative analysis of nutrients distribution in the northern of the East China Sea[J]. Marine Sciences, 2010, 34(1): 35-43. | |
| [2] | 任玲, 杨军. 海洋中氮营养盐循环及其模型研究[J]. 地球科学进展, 2000, 15(1):58-64. |
| REN L, YANG J. Nitrogen nutrients cycling in marine environment and its modeling research[J]. Advance in Earth Sciences, 2000, 15(1): 58-64. | |
| [3] |
DUGDALE R C, GOERING J J. Uptake of new and regenerated forms of nitrogen in primary productivity[J]. Limnology and Oceanography, 1967, 12(2): 196-206.
DOI URL |
| [4] |
EPPLEY R W, RENGER E H, HARRISON W G. Nitrate and phytoplankton production in southern California coastal waters[J]. Limnology and Oceanography, 1979, 24(3): 483-494.
DOI URL |
| [5] | 焦念志, 王荣. 新生产力:一个新的海洋学研究领域[J]. 海洋与湖沼, 1993, 24(2):205-211. |
| JIAO N Z, WANG R. New production—a new research area of oceanography[J]. Oceanologia et Limnologia Sinica, 1993, 24(2): 205-211. | |
| [6] |
HICKMAN A E, MOORE C M, SHARPLES J, et al. Primary production and nitrate uptake within the seasonal thermocline of a stratified shelf sea[J]. Marine Ecology Progress Series, 2012, 463: 39-57.
DOI URL |
| [7] |
EPPLEY R W, SAPIENZA C, RENGER E H. Gradients in phytoplankton stocks and nutrients off Southern California in 1974-76[J]. Estuarine and Coastal Marine Science, 1978, 7(3): 291-301.
DOI URL |
| [8] |
OMAND M M, MAHADEVAN A. The shape of the oceanic nitracline[J]. Biogeosciences, 2015, 12(11): 3273-3287.
DOI URL |
| [9] |
GONG X A, JIANG W S, WANG L H, et al. Analytical solution of the nitracline with the evolution of subsurface chlorophyll maximum in stratified water columns[J]. Biogeosciences, 2017, 14(9): 2371-2386.
DOI URL |
| [10] |
BEHRENFELD M J, O’MALLEY R T, SIEGEL D A, et al. Climate-driven trends in contemporary ocean productivity[J]. Nature, 2006, 444(7120): 752-755.
DOI |
| [11] |
CERMEÑO P, DUTKIEWICZ S, HARRIS R P, et al. The role of nutricline depth in regulating the ocean carbon cycle[J]. Proceedings of the National Academy of Sciences, 2008, 105(51): 20344-20349.
DOI URL |
| [12] |
LEWIS M R, HEBERT D, HARRISON W G, et al. Vertical nitrate fluxes in the oligotrophic ocean[J]. Science, 1986, 234(4778): 870-873.
PMID |
| [13] |
BAHAMÓN N, CRUZADO A. Modelling nitrogen fluxes in oligotrophic environments: NW Mediterranean and NE Atlantic[J]. Ecological Modelling, 2003, 163(3): 223-244.
DOI URL |
| [14] |
AKSNES D L, OHMAN M D, RIVIÈRE P. Optical effect on the nitracline in a coastal upwelling area[J]. Limnology and Oceanography, 2007, 52(3): 1179-1187.
DOI URL |
| [15] |
GOES J I, SAINO T, OAKU H, et al. Basin scale estimates of sea surface nitrate and new production from remotely sensed sea surface temperature and chlorophyll[J]. Geophysical Research Letters, 2000, 27(9): 1263-1266.
DOI URL |
| [16] |
PAINTER S C, PATEY M D, TARRAN G A, et al. Picoeukaryote distribution in relation to nitrate uptake in the oceanic nitracline[J]. Aquatic Microbial Ecology, 2014, 72(3): 195-213.
DOI URL |
| [17] |
PASQUERON DE FOMMERVAULT O, D’ORTENZIO F, MANGIN A, et al. Seasonal variability of nutrient concentrations in the Mediterranean Sea: Contribution of Bio-Argo floats[J]. Journal of Geophysical Research: Oceans, 2015, 120(12): 8528-8550.
DOI URL |
| [18] |
WEN Z Z, BROWNING T J, CAI Y H, et al. Nutrient regulation of biological nitrogen fixation across the tropical western North Pacific[J]. Science Advances, 2022, 8(5): eabl7564.
DOI URL |
| [19] |
LAANEMETS J, KONONEN K, PAVELSON J, et al. Vertical location of seasonal nutriclines in the western Gulf of Finland[J]. Journal of Marine Systems, 2004, 52(1-4): 1-13.
DOI URL |
| [20] |
MAYOT N, MATRAI P, ELLINGSEN I H, et al. Assessing phytoplankton activities in the seasonal ice zone of the Greenland Sea over an annual cycle[J]. Journal of Geophysical Research: Oceans, 2018, 123(11): 8004-8025.
DOI URL |
| [21] | 谢玲玲. 西北太平洋环流及其与南海水交换研究[D]. 青岛: 中国海洋大学, 2009. |
| XIE L L. Study on the circulation in western north Pacific and the water exchange between the Pacific and the South China Sea[D]. Qingdao: Ocean University of China, 2009. | |
| [22] | 李占强. 全球常年周平均海表温度场构建及其在西北太平洋中的应用[D]. 大连: 大连海洋大学, 2014. |
| LI Z Q. Long-term weekly average field of sea surface temperature and used in northwest Pacific[D]. Dalian: Dalian Ocean University, 2014. | |
| [23] | 余沛龙. 黑潮延伸体多尺度海洋变化及其对东亚气候的影响[D]. 长沙: 国防科技大学, 2018. |
| YU P L. Multi-scale oceanic variations over the Kuroshio extension region and their influences on East Asian climate[D]. Changsha: National University of Defense Technology, 2018. | |
| [24] |
陈朝晖, 林霄沛, 马昕, 等. 西北太平洋黑潮延伸体观测回顾和展望[J]. 地学前缘, 2022, 29(5):13-22.
DOI |
| CHEN Z H, LIN X P, MA X, et al. Observational studies in the Kuroshio Extension region, Northwest Pacific—a review and outlook[J]. Earth Science Frontiers, 2022, 29(5): 13-22. | |
| [25] |
POLOVINA J J, HOWELL E, KOBAYASHI D R, et al. The transition zone chlorophyll front, a dynamic global feature defining migration and forage habitat for marine resources[J]. Progress in Oceanography, 2001, 49(1-4): 469-483.
DOI URL |
| [26] | 杨海燕, 毛新燕, 郭新宇. 基于WOD数据集的西北太平洋混合层内营养盐浓度初步研究[J]. 中国海洋大学学报:自然科学版, 2018, 48(8):1-9. |
| YANG H Y, MAO X Y, GUO X Y. A preliminary study on nutrients concentration within the mixed layer in the northwest Pacific based on WOD data[J]. Periodical of Ocean University of China, 2018, 48(8): 1-9. | |
| [27] |
KIM T W, LEE K, NAJJAR R G, et al. Increasing N abundance in the northwestern Pacific Ocean due to atmospheric nitrogen deposition[J]. Science, 2011, 334(6055): 505-509.
DOI URL |
| [28] |
ZHENG L W, ZHAI W D. Excess nitrogen in the Bohai and Yellow Seas, China: Distribution, trends, and source apportionment[J]. Science of the Total Environment, 2021, 794: 148702.
DOI URL |
| [29] |
BUCHANAN P J, AUMONT O, BOPP L, et al. Impact of intensifying nitrogen limitation on ocean net primary production is fingerprinted by nitrogen isotopes[J]. Nature Communications, 2021, 12: 6214.
DOI PMID |
| [30] |
SEOK M W, KIM D, PARK G H, et al. Atmospheric deposition of inorganic nutrients to the Western North Pacific Ocean[J]. Science of the Total Environment, 2021, 793: 148401.
DOI URL |
| [31] | 李娜, 甘波澜. 北太平洋副热带海区动力高度与净初级生产力相关性研究[J]. 中国海洋大学学报:自然科学版, 2020, 50(5):1-10. |
| LI N, GAN B L. Correlation between dynamic height and net primary production in the subtropical North Pacific gyre[J]. Periodical of Ocean University of China, 2020, 50(5): 1-10. | |
| [32] |
KANEKO H, YASUDA I, KOMATSU K, et al. Observations of vertical turbulent nitrate flux across the Kuroshio[J]. Geophysical Research Letters, 2013, 40(12): 3123-3127.
DOI URL |
| [33] |
LONG Y, ZHU X H, GUO X Y. The oyashio nutrient stream and its nutrient transport to the mixed water region[J]. Geophysical Research Letters, 2019, 46(3): 1513-1520.
DOI URL |
| [34] | 张龙, 叶松, 周树道, 等. 海水温盐深剖面测量技术综述[J]. 海洋通报, 2017, 36(5):481-489. |
| ZHANG L, YE S, ZHOU S D, et al. Review of measurement techniques for temperature, salinity and depth profile of sea water[J]. Marine Science Bulletin, 2017, 36(5): 481-489. | |
| [35] | PARADIS R, WOOD S L. Inexpensive expendable conductivity temperature and depth (CTD) sensor[C]// 2013 OCEANS-San Diego. IEEE, 2013: 1-12. |
| [36] |
HERNANDEZ-LASHERAS J, MOURRE B. Dense CTD survey versus glider fleet sampling: Comparing data assimilation performance in a regional ocean model west of Sardinia[J]. Ocean Science, 2018, 14(5): 1069-1084.
DOI URL |
| [37] |
CHEN S L, WELLS M L, HUANG R X, et al. Episodic subduction patches in the western North Pacific identified from BGC-Argo float data[J]. Biogeosciences, 2021, 18(19): 5539-5554.
DOI URL |
| [38] | XING X G, WELLS M L, CHEN S L, et al. Enhanced winter carbon export observed by BGC-Argo in the northwest Pacific Ocean[J]. Geophysical Research Letters, 2020, 47(22): e2020GL089847. |
| [39] | 邱国强, 王海黎, 邢小罡. BGC-Argo浮标观测在海洋生物地球化学中的应用[J]. 厦门大学学报:自然科学版, 2018, 57(6):827-840. |
| QIU G Q, WANG H L, XING X G. Application of BGC-Argo floats observation to ocean biogeochemistry[J]. Journal of Xiamen University: Natural Science, 2018, 57(6): 827-840. | |
| [40] | SPRINTALL J, TOMCZAK M. Evidence of the barrier layer in the surface layer of the tropics[J]. Journal of Geophysical Research: Oceans, 1992, 97(C5): 7305-7316. |
| [41] | 安玉柱, 张韧, 王辉赞, 等. 全球大洋混合层深度的计算及其时空变化特征分析[J]. 地球物理学报, 2012, 55(7):2249-2258. |
| AN Y Z, ZHANG R, WANG H Z, et al. Study on calculation and spatio-temporal variations of global ocean mixed layer depth[J]. Chinese Journal of Geophysics, 2012, 55(7): 2249-2258. | |
| [42] | TSENG C M, WONG G T F, LIN I I, et al. A unique seasonal pattern in phytoplankton biomass in low-latitude waters in the South China Sea[J]. Geophysical Research Letters, 2005, 32(8): L08608. |
| [43] |
WONG G T F, TSENG C M, WEN L S, et al. Nutrient dynamics and N-anomaly at the SEATS station[J]. Deep Sea Research Part II: Topical Studies in Oceanography, 2007, 54(14/15): 1528-1545.
DOI URL |
| [44] | CULLEN J, EPPLEY R. Chlorophyll maximum layers of the southern-California Bight and possible mechanisms of their formation and maintenance[J]. Oceanologica Acta, 1981, 4: 23-32. |
| [45] |
FUJIKI T, INOUE R, HONDA M C, et al. Time-series observations of photosynthetic oxygen production in the subtropical western North Pacific by an underwater profiling buoy system[J]. Limnology and Oceanography, 2020, 65(5): 1072-1084.
DOI URL |
| [46] |
JOO H, LEE D B, KANG J J, et al. Inter-annual variation of the annual new production of phytoplankton in the southwestern East/Japan sea estimated from satellite-derived surface nitrate concentration[J]. Journal of Coastal Research, 2018, 85: 336-340.
DOI URL |
| [47] |
VAHTERA E, LAANEMETS J, PAVELSON J, et al. Effect of upwelling on the pelagic environment and bloom-forming cyanobacteria in the western Gulf of Finland, Baltic Sea[J]. Journal of Marine Systems, 2005, 58(1/2): 67-82.
DOI URL |
| [48] |
HOIKKALA L, AARNOS H, LIGNELL R. Changes in nutrient and carbon availability and temperature as factors controlling bacterial growth in the northern Baltic Sea[J]. Estuaries and Coasts, 2009, 32(4): 720-733.
DOI URL |
| [1] | 蒋佳茗, 汪亦蕾. 热带西北太平洋0~300 m热含量的年代际变化[J]. 海洋学研究, 2022, 40(1): 1-11. |
| [2] | 许钰佳, 陈长霖, 彭旭东, 刘磊, . 西北太平洋热带气旋路径预报偏差分析[J]. 海洋学研究, 2021, 39(2): 1-11. |
| 阅读次数 | ||||||
|
全文 |
|
|||||
|
摘要 |
|
|||||