
0 引言
大量研究表明,气候变化和人类活动是引起河流水沙通量变化的重要因素[2,8⇓-10]。杨远东 等[8]和王渺林 等[9]通过对珠江和长江上游流域径流量年内分配的不均匀性分析认为,径流量受气候变化和人类活动等多种因素影响,其中,水库调节导致的洪枯季变幅减弱是年内分配呈均匀性发展的主要原因。由于不同流域的气候和人类活动方式的不同,河流洪枯季的水沙通量呈现出不同的变化趋势。周光涛[10]研究呼兰河春、夏、秋、冬四个季节径流量发现,受流域内水库建设和灌溉的影响,各季节径流量均呈下降趋势。张颖 等[3]研究了50年来赣江汛期和非汛期的水沙变化,发现径流量的变化趋势平稳,输沙量呈下降趋势。吴尧 等[2]分析东江洪枯季的水沙变化发现,径流量呈现洪季减少、枯季增加的趋势,输沙量呈现洪枯季均减少的趋势,其中输沙量减少主要与水库拦截有关。上述研究主要针对大型河流或其支流进行,对于独流入海的中小型河流的关注较少。
1 研究区概况
瓯江为浙江省第二大河流,全长384 km,流域面积18 000 km2。瓯江发源于锅帽尖,流经龙泉、云和、丽水、青田、永嘉、瓯海、鹿城、龙湾等8个县(市、区),向东注入温州湾,为典型的山溪性河流(图1)。由于河谷地形陡、坡降大,降水汇流快,瓯江水沙通量具有随洪峰暴涨暴跌的特征[14]。同时,受亚热带季风气候和台风的影响,瓯江流域降水具有明显的季节性变化特征,其水沙通量也因此呈现出显著的季节差异[15]。春末夏初期间(4—6月)受夏季风向北推进的影响,流域内阴雨连绵,这一时期称为梅汛期;夏秋季节(7—9月)台风活动频繁,水汽受纵横交错的山脉阻挡发生抬升和汇聚,容易在瓯江流域内形成暴雨中心,这一时期为台汛期[15⇓⇓-18]。因此,4—9月是瓯江流域的汛期(包含梅汛期和台汛期两个汛期),其余月份为非汛期。
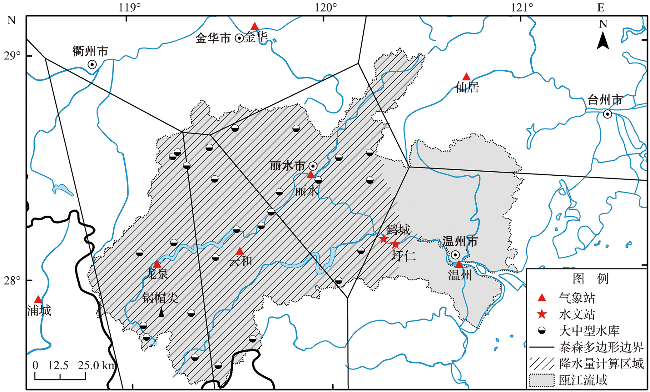
近几十年来瓯江流域内兴建了大量水库、水电站等水利工程,截至2022年,流域(鹤城站集水区域)内已建有大中型水库26座(图1),小型水库97座。
2 资料与方法
2.1 资料来源
收集了瓯江流域及周边7个气象站(图1)月均降水量数据(1960—2019年),数据下载自中国国家气象信息网(http://data.cma.cn/)。
2.2 研究方法
2.2.1 面降水量计算
2.2.2 年内分配不均匀性分析
对于水沙通量洪枯悬殊的山溪性河流,其汛期和非汛期变化在相当大程度上决定了水沙通量年内分配的不均匀性(下文简称“不均匀性”)[21]。不均匀性可以用年内分配不均匀系数(Cv)表征,Cv值越大,表示水文要素在年内各月间的差异越悬殊,即年内分配越不均匀。公式如下:
式中:$R_i$ 为水文要素月观测值;δ为水文要素年内月观测值的均方差,$\bar{R}$为水文要素年内月平均值。本文利用瓯江月径流量和月输沙量作为水文要素观测值,分别计算径流量和输沙量的$C_v$ 值。
2.2.3 时间序列趋势分析
2.2.4 径流量-降水量、输沙量-径流量的相关性分析
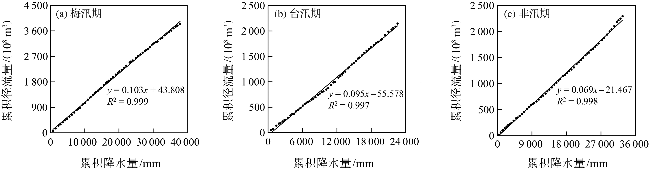
绘制径流量-降水量、输沙量-径流量的双累积曲线,分析两要素的一致性。双累积曲线是检查水文要素变化一致性的重要方法[25]:在直角坐标系中绘制同期内一个变量连续累积值与另一个变量连续累积值的关系曲线,检验两者变化趋势是否一致,当两个变量关系一致时,曲线呈线性;当一个变量相对于另一个变量突然增大或减少,曲线发生转折,出现向上或向下的拐点;曲线斜率的变化代表单位要素量的变化。
3 结果
3.1 水沙通量的汛期和非汛期分配
瓯江入海水沙通量在年内分配极不均匀,具有汛期和非汛期差异悬殊的特征。梅汛期(4—6月)和台汛期(7—9月)是两个主要的输水输沙期,此6个月的径流量和输沙量在全年的占比为70%和90%以上。多年月平均值显示,降水量、径流量和输沙量的峰、谷期一致,峰值均出现在6月,谷值均出现在12月(图2)。
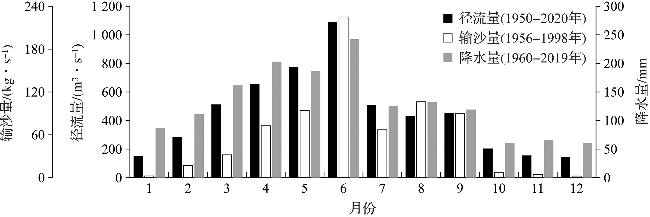
根据1950—2020年径流量观测资料计算,瓯江梅汛期(4—6月)的多年平均入海径流量为838 m3/s,台汛期(7—9月)为464 m3/s,非汛期(10月—次年3月)为242 m3/s,三个时期的入海径流量比例大约为3.5∶2∶1,梅汛期是最主要的输水时期。输沙量的汛期和非汛期分配情况与径流量类似。1956—1998年梅汛期(4—6月)的多年平均入海输沙量为131 kg/s,台汛期(7—9月)为88 kg/s,非汛期(10月—次年3月)为11 kg/s,三个时段比例大约为12∶8∶1,梅汛期也是瓯江最主要的输沙期。
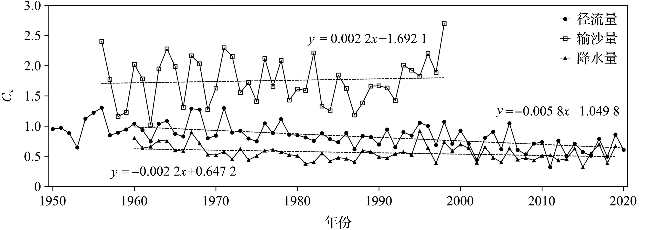
从瓯江径流量、输沙量和降水量的年内分配不均匀系数Cv(图3)来看,Cv的多年平均值为输沙量>径流量>降水量,表明输沙量的变幅比径流量和降水量大。从变化趋势看,径流量的Cv值呈明显下降趋势,多年平均减少率为0.005 8,年内分配趋于均匀化;而降水量和输沙量总体变化趋势平稳,降水量多年平均减少率为0.002 2,输沙量多年平均增加率为0.002 2,变幅均只有径流量的约二分之一,年内分配变化不大。
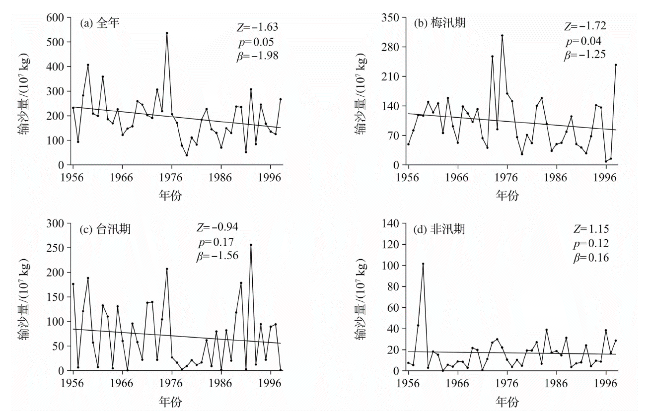
3.2 水沙通量的汛期和非汛期变化趋势
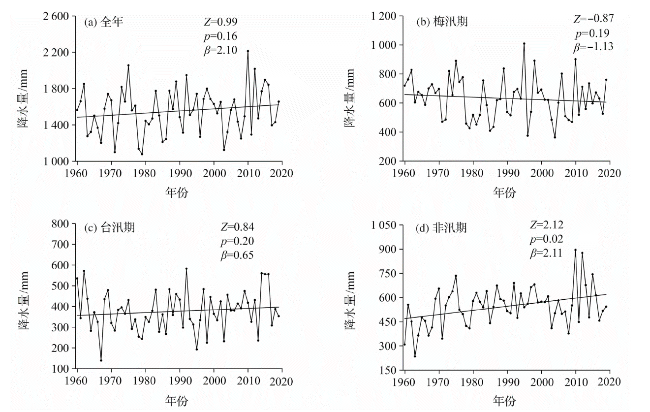
降水量变化(图6)显示,1960—2019年瓯江流域全年、台汛期和非汛期均呈增加趋势,其中非汛期的年均变化率为2.11 mm/a(β=2.11),增加趋势显著(Z=2.12,p=0.02)。梅汛期降水量呈减少趋势,但不显著。
4 讨论
4.1 瓯江流域降水量-径流量-输沙量的相关关系
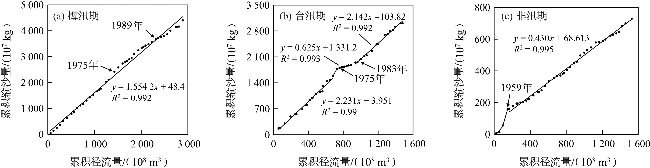
1956—1998年各时期输沙量与径流量的双累积曲线(图8)显示,43年间水沙关系在台汛期(1975年)、非汛期(1959年)各发生了一次明显突变。台汛期曲线在1975—1983年发生明显右偏,斜率从2.231减少到0.625(图8b),表明这一时期单位径流量下产生的输沙量大幅减少。这一突变可能与1975年8月流域内特大洪水导致的土壤侵蚀有关,大洪水致使土壤侵蚀厚度急剧减小,导致之后几年间的地表土壤抗侵蚀能力增强[11,19]。1983—1998年,双累积曲线的斜率恢复至2.142,与1975年前相近,可能是经历约8年的恢复期后,土壤侵蚀层基本恢复,流域输沙量恢复到了大洪水之前的水平。非汛期曲线在1959年发生明显右偏(图8c),表明1959年后流域的单位径流量下产生的输沙量大幅减少。这一突变可能与1959年2月流域内强降水导致的土壤侵蚀有关。梅汛期双累积曲线虽然在1975年和1989年略有偏转,但是幅度不大,整体未发生明显突变,表明水沙关系较为稳定。由于梅汛期的水沙通量较大,可能导致强降水和人类活动等因素影响相对变小。
4.2 人类活动对水沙通量的影响
自然状态下,河流水沙通量的变化受降水量的直接影响,但近年来随着瓯江流域人类活动不断增强,入海水沙通量受人类活动的影响日趋明显。宋乐 等[11] 研究发现,影响瓯江水沙通量的人类活动主要包括森林砍伐、引水调水工程建设和修建水利设施等,其中水库建设的影响最大。
表1 水库建设前后降水量与径流量的Cv值及其变化率Tab.1 The values of Cv for precipitation and runoff before and after the construction of reservoirs as well as their changing rates |
| 项目 | Cv | ||
|---|---|---|---|
| 建库前 | 建库后 | 变化率 | |
| 降水量 | 0.57 | 0.55 | -3.5% |
| 径流量 | 0.91 | 0.74 | -18.7% |
表2 水库建设前后梅汛期、台汛期和非汛期年均径流量和输沙量变化Tab.2 The average runoff and sediment load before and after the construction of reservoirs during plum rain, typhoon and non-flooding seasons as well as their changing rates |
| 时期 | 年均径流量 | 年均输沙量 | ||||
|---|---|---|---|---|---|---|
| 建库前/(108 m3·a-1) | 建库后/(108 m3·a-1) | 变化率/% | 建库前/(107 kg·a-1) | 建库后/(107 kg·a-1) | 变化率/% | |
| 梅汛期 | 67.2 | 68.6 | 2.1 | 101.9 | 83.5 | -18.1 |
| 台汛期 | 31.4 | 40.3 | 28.3 | 57.5 | 80.9 | 40.7 |
| 非汛期 | 32.8 | 41.8 | 27.4 | 14.1 | 16.4 | 16.3 |
5 结论
瓯江为典型的山溪性河流,其水沙通量具有洪枯季悬殊特征。基于瓯江干流控制水文站多年水沙观测资料分析了瓯江汛期和非汛期水沙通量的变化规律,得到以下几点主要认识。
1)在汛期和非汛期的分配上,瓯江径流量、输沙量与降水量峰谷期一致,峰值均出现在6月,谷值均出现在12月,梅汛期是瓯江的主汛期。
2)径流量和输沙量的年内分配不均匀性不同,输沙量的变幅明显大于径流量。径流量的不均匀性在1950—2020年间呈显著下降趋势,输沙量的不均匀性在1956—1998年间变化不大。
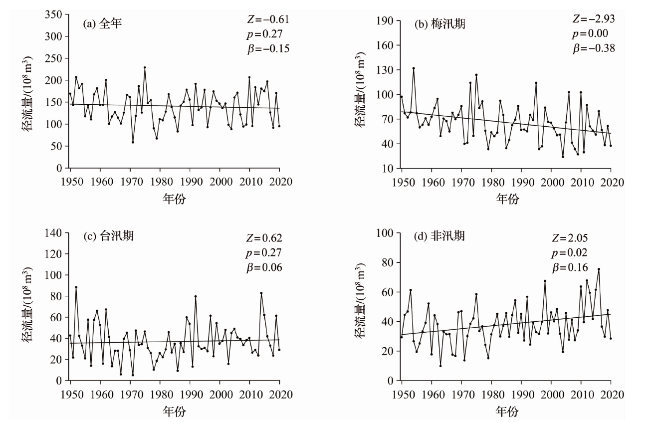
3)1950—2020年,径流量在梅汛期呈显著减少的趋势,在非汛期呈显著增加趋势,在台汛期呈增加趋势但趋势不显著;1956—1998年,输沙量在梅汛期呈显著减少趋势,在台汛期和非汛期分别呈现减少和增加趋势,但均不显著。
4)台汛期、非汛期的径流量-输沙量关系分别在1975年、1959年各发生了一次明显突变,均可能与流域内的强降水有关。
5)紧水滩水库的调蓄和拦沙在一定程度上影响了瓯江水沙通量在汛期和非汛期的分配特征,水库建成后,径流量表现出更强的均匀化趋势,输沙量在梅汛期大幅减少。