
0 引言
近岸海域具有独特的地理、化学和生物特征及复杂的碳循环过程,在不同海域或不同时间尺度呈现出大气的碳源或碳汇的转换[12]。这不仅给地球系统模式的构建和研究带来挑战,还给全球海-气CO2通量的估算带来不确定性,影响了对未来地球气候系统变化的预估。目前,对青岛近岸海域pCO2变化已有不少研究,但这些研究大多基于船载走航观测且聚焦于胶州湾内[13-14],缺少在近岸开阔海域的观测,特别是缺乏浮标的连续高频观测数据。本研究基于在青岛近岸海域布放的海-气界面浮标观测数据,综合分析了春季CO2源-汇转换期间海表pCO2变化的原因,估算了海-气CO2通量,有助于进一步理解近岸海域CO2源-汇转化的控制机制和碳循环过程。
1 数据与方法
1.1 数据来源
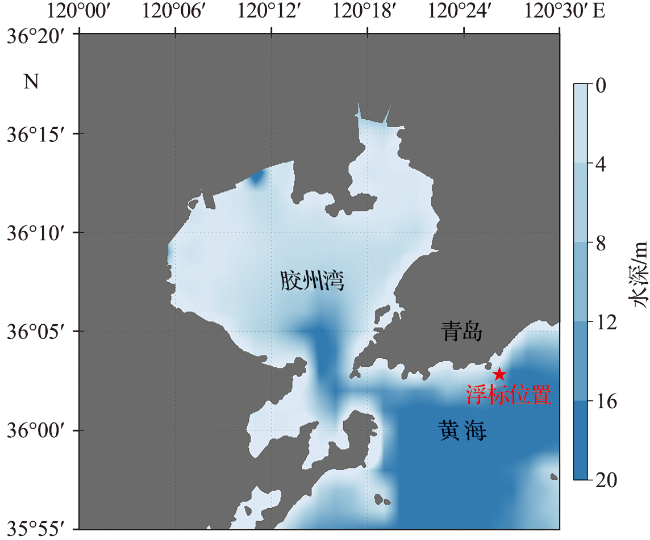
于2022年4月4日至5月9日在青岛近岸海域(36.047°N,120.437°E)布放了一套海-气界面观测浮标(图1),获得了连续5周的逐小时观测时间序列数据。浮标搭载了GMX600气象传感器(Gill Instruments公司),可测量大气温度、湿度、风速、风向等气象数据;搭载了SBE-37SM(Sea-Bird Scientific公司),可测量海表面温度(sea surface temperature, SST)和海表面盐度(sea surface salinity, SSS)数据;搭载了SPP(The Eppley Laboratory公司),可测量短波辐射数据;搭载了CO2-Pro(Pro-Oceanus Systems公司),可测量大气和海表的pCO2数据。这些传感器采集的数据每隔1 h取平均值进行存储,并以北京时间(UTC+8)进行传输。
通过美国国家海洋和大气管理局海岸观测网站(National Oceanic and Atmospheric Administration CoastWatch,NOAA CoastWatch,https://coastwatch.noaa.gov)获取浮标所在位置的海表面叶绿素a(Chl a)日平均卫星数据[15];通过浮标附近的小麦岛海洋观测站获取研究海域的逐小时溶解氧(dissolved oxygen, DO)数据和潮高数据,根据浮标观测的SST和SSS数据计算DO饱和度[16];通过欧洲中尺度天气预报中心(European Centre for Medium-Range Weather Forecasts,ECMWF,https://www.ecmwf.int/)获取浮标所在位置的ERA5再分析资料每小时SST数据[17]。
根据全球海表CO2地图(surface ocean CO2 atlas, SOCAT)指南[18]对上述数据进行了质量控制,具体包括:1)找出偶发性的数据传输中断并标记缺失值;2)根据各传感器精度范围设置数据的上下限,并采用3σ检验原则标记异常值;3)对缺失值和异常值通过相邻数据的线性插值进行补全和更正,确保数据的准确性和连续性。
1.2 海-气CO2通量计算方法
海-气CO2通量正值表示海洋向大气释放CO2,为大气CO2的源;负值表示海洋从大气吸收CO2,为大气CO2的汇。海-气CO2通量具体计算公式如下:
k=0.251×U2×(Sc/660)-0.5
Sc=A+Bt+Ct2+Dt3+Et4
式中:A=2 116.8,B=-136.25,C=4.735 3,D=-0.092 230 7,E=0.000 755 5,t表示海表面温度。
2 结果与分析
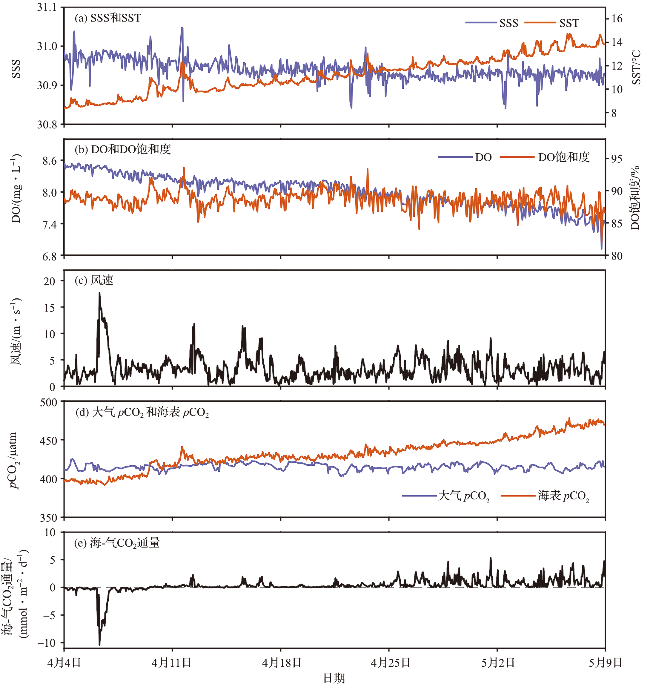
2.1 浮标高频观测数据时间序列变化特征
2.2 海表pCO2变化的控制因素
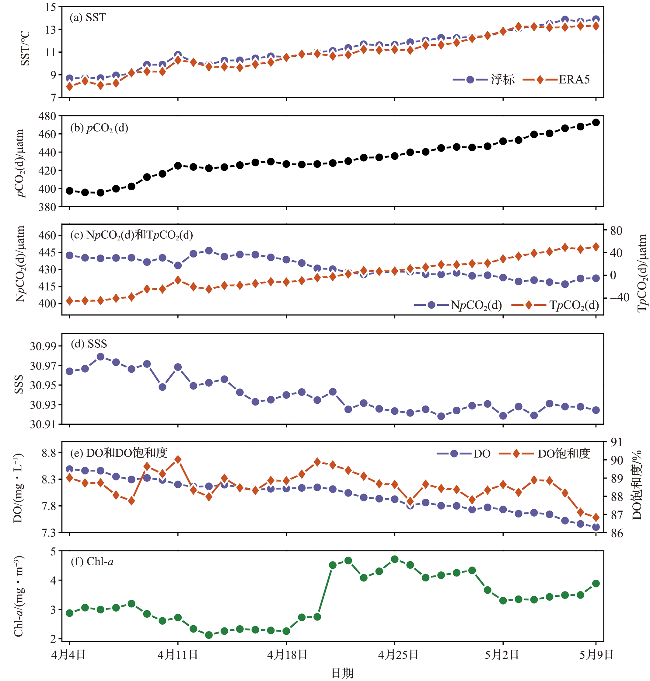
为消除pCO2日变化对时间序列的影响,取pCO2日平均值对海表pCO2及其相关影响因素的变化趋势进行分析(图3)。
2.2.1 温度效应
如图3a所示,观测期间浮标测得的SST和ERA5再分析数据资料的SST呈相同的上升趋势,两者的变化特征较为一致。温度可以通过影响海水CO2溶解度以及碳酸盐体系的内部平衡来影响pCO2的数值变化,海表pCO2和SST呈显著的正相关关系(Pearson相关系数为0.97)。
TpCO2(d)=pCO2(d)-NpCO2(d)
式中:t表示海表面温度,tmean表示观测期间的平均海表面温度,pCO2(d)表示海表pCO2日平均值,TpCO2(d)表示温度对pCO2(d)的影响,NpCO2 (d) 表示去除温度效应后其他因素对pCO2(d)的影响。
由图3c可知,NpCO2 (d)的变化幅度约为29 μatm,而TpCO2 (d)的变化幅度约为96 μatm。通过计算TpCO2(d)在pCO2(d)中的占比后取平均值来衡量温度因素对海表pCO2变化的贡献,观测期间温度对海表pCO2变化的贡献约为64%。春季青岛近岸海域温度的平稳升高影响了海水CO2的溶解度,温度是海表pCO2变化的主控因素。
2.2.2 混合效应
盐度不仅可以反映河流输入带来的陆源物质对近岸海域的影响,还可以反映平流输送以及与深层水体的垂向混合作用对表层海洋的影响。由于浮标布放区域没有河流的淡水输入,且SSS一直维持在30.9的较低水平,总体变化幅度很小(图3d),表明观测期间没有明显的平流输送和垂向混合,水体混合效应较弱,对海表pCO2变化的作用较小。
2.2.3 生物效应
2.3 海表pCO2的日变化特征及影响因素
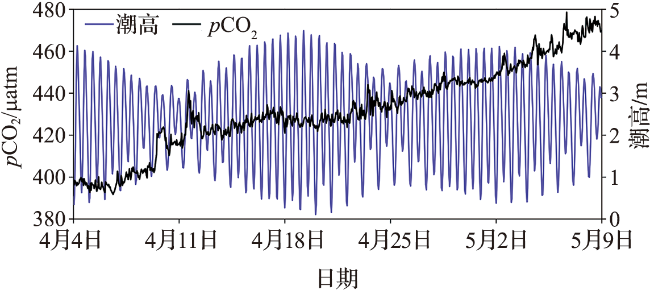
前文分析中发现潮汐作用对pCO2的影响较为微弱且浮标所在海域的深度较浅,水平平流和垂向混合的作用较弱。LEINWEBER等[24]在对圣莫妮卡湾的观测研究中也同样指出潮汐不是SST和pCO2日变化的主要驱动因素。因此,本文将不再探讨潮汐的影响。
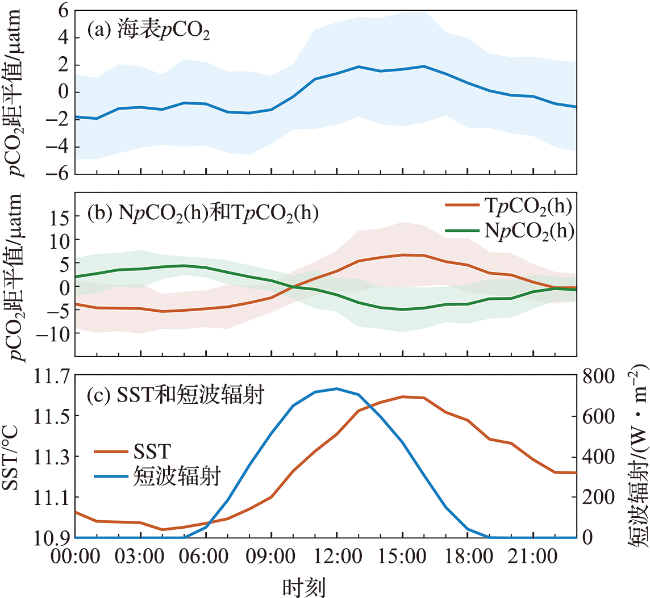
由图5可知,海表pCO2在每日午后达到最高值,之后逐渐降低,凌晨的变化较为缓慢,于日出后开始不断增长,完成一个日循环过程。其中由温度因素引起的pCO2日变化的偏移量TpCO2(h)的平均日变化和SST基本一致:日出后海表面吸收太阳短波辐射带来的热量,SST逐渐升高,TpCO2(h)增大,于下午两点至四点达到峰值,随后海表吸收的热量逐渐下降,SST逐渐降低,TpCO2(h)减小,于日出前后达到最小值。
短波辐射的变化同时影响了生物因素引起的pCO2变化。日出后浮游植物光合作用增强,吸收CO2,使得NpCO2(h)不断下降;而在夜间,短波辐射为零,生物的呼吸作用使得NpCO2(h)不断增加。通过计算TpCO2(h)在pCO2(h)中的占比来衡量温度因素对海表pCO2日变化的贡献。结果表明,观测期间温度因素对海表pCO2日变化的贡献约为53%,其余47%的变化由生物等因素共同驱动,两者呈现相反的变化趋势,共同影响了海表pCO2的日变化过程。
2.4 海-气CO2通量及采样频率的影响
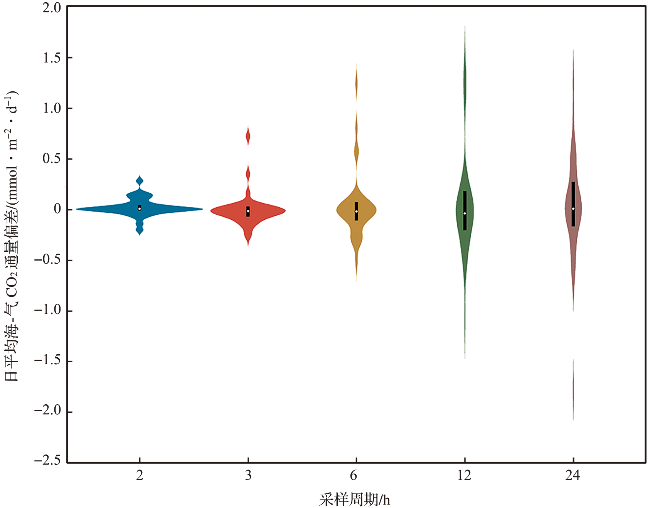
海-气CO2通量的估算受到采样频率的制约[25],其中风速、SST和SSS每小时高频数据的获取较为容易,而海表pCO2的测量通常受到船舶测量的空间不连续性和传感器自身限制的影响,难以实现对某个地点的长时间高频观测,从而给海-气CO2通量的估算带来偏差。为评估采样频率带来的海-气CO2通量估算偏差,选取不同采样周期内的海表pCO2平均值作为不同采样频率下的pCO2数据,分别计算日平均海-气CO2通量。计算不同采样周期下的日平均海-气CO2通量与1 h采样周期下的日平均海-气CO2通量之差,得到日平均海-气CO2通量偏差与采样周期的关系,通过小提琴图来表征(图6,其中,外轮廓线表示日平均数据的核密度曲线,反映了数据点在该位置的分布情况,峰值越高,表示该处的数据越密集)。如图6所示,随着采样周期变长,采样频率降低,海-气CO2通量的偏差逐渐扩大。观测期间,1 h采样周期下的日平均海-气CO2通量大都小于1 mmol/(m2·d)。若采用2 h和3 h的采样周期,其日平均海-气CO2通量与1 h采样周期的结果较为接近,其偏差均在±1 mmol/(m2·d)内。当采用6 h、12 h和24 h的采样周期时,其海-气CO2通量偏差超过±1 mmol/(m2·d)的数据点显著增加。因此,在海-气CO2通量变化较为显著的海域,浮标的采样周期应尽可能地控制在3 h以内,以避免对海-气CO2通量的估算产生较大误差。
图6 不同采样周期下日平均海-气CO2通量偏差的小提琴图(黑色长条代表日平均数据的四分位数范围,白点代表中位数,外轮廓线代表日平均数据的核密度曲线。) Fig.6 Violin-plot of daily mean sea-air CO2 flux deviation for different sampling periods (The black bars represent the interquartile range of the daily mean data, the white dots represent the median, and the outer contours represent the kernel density curve of the daily mean data.) |
3 结论
本研究通过在青岛近岸海域布放浮标获取了高分辨率大气和海水pCO2观测数据。数据分析结果表明:1)春季青岛近岸海域,海表pCO2不断升高,导致海-气CO2通量由负转正,表层海洋从大气的碳汇转为碳源。2)观测期间表层海水温度上升是导致海表pCO2增长的主要因素,生物活动使得海表pCO2降低,而潮汐运动对海表pCO2的影响则不明显。3)观测期间海表pCO2呈现明显的日变化特征,这是由温度和生物因素共同作用的结果,二者对海表pCO2日变化的贡献相反。4)提高采样频率能显著降低海-气CO2通量估算的偏差,应采用3 h以内的高频观测数据以提高海-气CO2通量估算的准确性。