
0 引言
1 数值模型的构建及验证
1.1 数值模型的构建
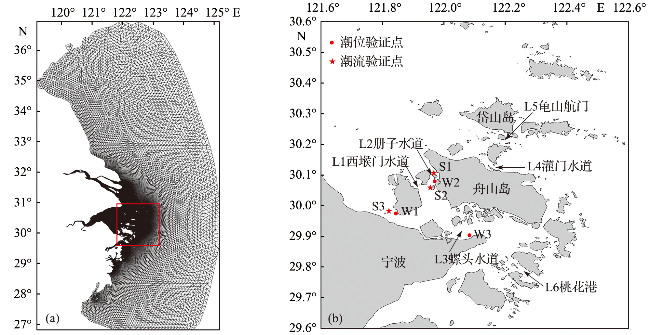
1.2 数值模型的验证
表1 模型潮位验证Tab.1 Validation of the model simulated tidal elevation |
| 项目 | 分潮 | W1站位 | W2站位 | W3站位 | |||||||
|---|---|---|---|---|---|---|---|---|---|---|---|
| 模拟值 | 观测值 | 绝对误差 | 模拟值 | 观测值 | 绝对误差 | 模拟值 | 观测值 | 绝对误差 | |||
| 振幅/m | M2 | 0.979 7 | 1.032 3 | 0.052 6 | 1.016 3 | 1.032 3 | 0.016 0 | 0.951 5 | 0.948 5 | 0.003 0 | |
| S2 | 0.465 3 | 0.428 6 | 0.036 7 | 0.497 5 | 0.428 6 | 0.068 9 | 0.425 7 | 0.467 2 | 0.041 5 | ||
| K1 | 0.284 1 | 0.374 4 | 0.090 3 | 0.284 2 | 0.374 4 | 0.090 1 | 0.296 7 | 0.265 9 | 0.030 8 | ||
| O1 | 0.204 9 | 0.218 5 | 0.013 6 | 0.199 3 | 0.218 5 | 0.019 2 | 0.208 5 | 0.197 3 | 0.011 2 | ||
| 迟角/(°) | M2 | 323.65 | 306.65 | 17.00 | 320.39 | 306.65 | 13.75 | 284.29 | 303.86 | 19.57 | |
| S2 | 3.91 | 357.44 | 6.47 | 1.16 | 357.44 | 3.72 | 325.99 | 342.27 | 16.28 | ||
| K1 | 237.07 | 213.36 | 23.71 | 232.33 | 209.36 | 22.97 | 212.75 | 230.34 | 17.59 | ||
| O1 | 191.12 | 166.77 | 24.35 | 190.62 | 166.77 | 23.85 | 165.76 | 184.63 | 18.87 | ||
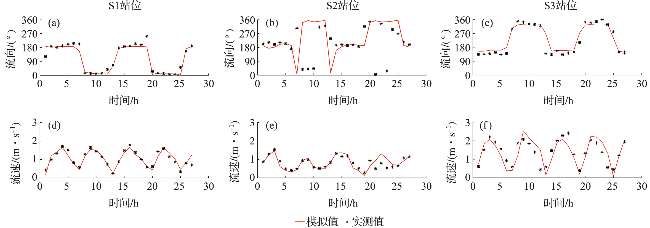
图2 大潮期间S1、S2、S3站位表层潮流验证Fig.2 Validation of surface tidal current during spring tide at the stations of S1, S2 and S3 |
表2 S1、S2、S3站潮流流向、流速误差Tab.2 Tidal current direction error and velocity error at the stations of S1, S2 and S3 |
| 站位 | 流向平均绝对误差/(°) | 流速平均相对误差/% | ||||
|---|---|---|---|---|---|---|
| 大潮 | 中潮 | 小潮 | 大潮 | 中潮 | 小潮 | |
| S1 | 11.2 | 10.8 | 7.9 | 9.3 | 7.2 | 8.4 |
| S2 | 23.7 | 15.8 | 9.6 | 13.1 | 9.2 | 7.7 |
| S3 | 8.7 | 16.3 | 5.9 | 14.5 | 17.2 | 10.1 |
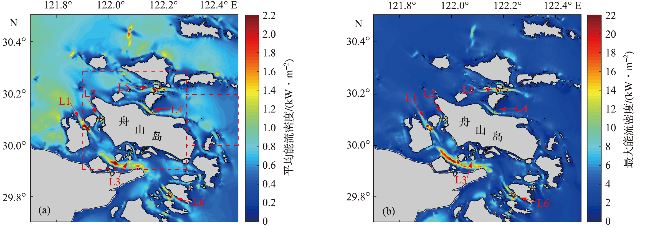
2 舟山海域潮流能资源蕴藏量
3 舟山海域重要水道潮流能资源评估
3.1 水道潮流能可开发时长和潮流特征
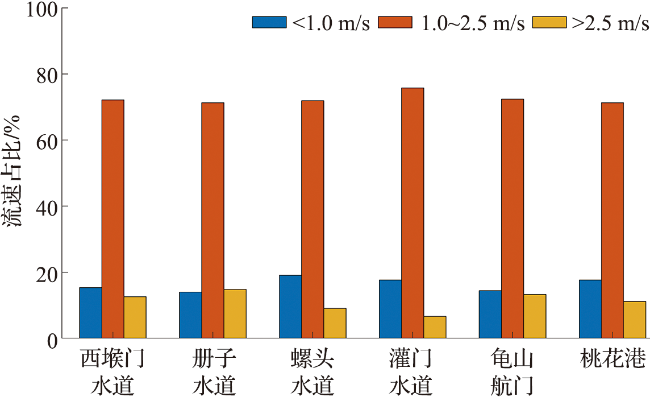
表3 舟山海域重要水道潮流特性Tab.3 Tidal characteristics in the significant waterways of Zhoushan sea area |
| 指标 | 西堠门水道 | 册子水道 | 螺头水道 | 灌门水道 | 龟山航门 | 桃花港 |
|---|---|---|---|---|---|---|
| 潮流平均流速/(m·s-1) | 1.97 | 1.73 | 1.86 | 1.89 | 2.04 | 1.82 |
| 潮流最大流速/(m·s-1) | 3.47 | 2.98 | 3.59 | 3.15 | 3.24 | 3.22 |
| 涨潮平均流速/(m·s-1) | 2.08 | 1.75 | 2.09 | 2.01 | 2.12 | 1.83 |
| 落潮平均流速/(m·s-1) | 1.91 | 1.70 | 1.63 | 1.69 | 1.87 | 1.81 |
| 涨潮潮流主轴方向/(°) | 303.01 | 9.83 | 302.16 | 285.76 | 263.83 | 336.32 |
| 落潮潮流主轴方向/(°) | 130.83 | 198.53 | 145.51 | 116.09 | 86.99 | 152.61 |
| 潮流不对称性 | 0.08 | 0.03 | 0.22 | 0.16 | 0.12 | 0.01 |
| 潮流旋转性/(°) | 7.82 | 8.7 | 23.35 | 10.33 | 3.16 | 3.71 |
| 涨潮流向标准差/(°) | 1.5 | 0.4 | 3.6 | 2.5 | 2.1 | 0.5 |
| 落潮流向标准差/(°) | 1.1 | 0.5 | 2.7 | 3.1 | 2.4 | 0.7 |
| 涨潮流向稳定系数 | 0.98 | 0.99 | 0.96 | 0.97 | 0.98 | 0.99 |
| 落潮流向稳定系数 | 0.99 | 0.99 | 0.97 | 0.97 | 0.97 | 0.99 |
3.2 舟山海域重要水道潮流能资源开发评估
3.2.1 水道内部潮流能开发选址分析
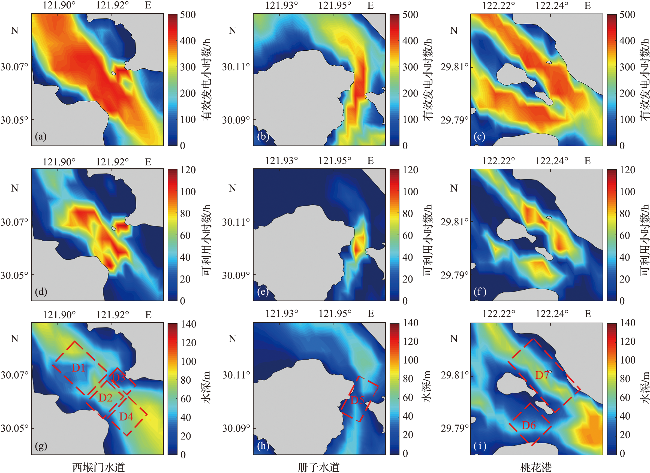
图5 西堠门水道、册子水道、桃花港的有效发电小时数分布(a,b,c)、可利用小时数分布(d,e,f)与潮流能发电站潜在选址分布(g,h,i)(图g,h,i中,红色虚线区表示潜在选址区位置,D1~D7为潜在选址区编号。) Fig.5 Distribution of significant hours(a,b,c),available hours (d,e,f) and potential site selection of tidal current power station (g,h,i) in Xihoumen waterway, Cezi waterway, and Taohuagang waterway (In figure g,h and i, the area surrounded by dotted red lines indicates the location of the potential site selection area, and D1-D7 indicates the ID of the potential site selection area.) |
3.2.2 水道的潮流能可开发量
表4 基于Farm法估算的潮流能可开发量Tab.4 The extractable amount of tidal current energy by Farm method |
| 水道名称 | 选址指标 | ||||
|---|---|---|---|---|---|
| 长度/ m | 宽度/ m | 面积/ m2 | 涡轮机数量/个 | 潮流能可开发量/MW | |
| 西堠门水道 | 1 000 | 450 | 450 000 | 56 | 27.53 |
| 册子水道 | 1 500 | 650 | 975 000 | 120 | 39.96 |
| 桃花岛 | 2 600 | 1 000 | 2 600 000 | 336 | 130.26 |