
0 引言
1 材料
1.1 基质材料准备
1.2 仪器与试剂
2 实验方法
2.1 样品制备
2.2 活性磷酸盐浓度测定方法
2.3 样品均匀性检验方法
2.4 样品稳定性检验方法
2.5 定值误差统计分析
2.6 不确定度评定方法
2.6.1 均匀性引入的不确定度
2.6.2 稳定性引入的不确定度
2.6.3 定值过程引入的不确定度
3 定值方法优化研究
3.1 反应温度的优化
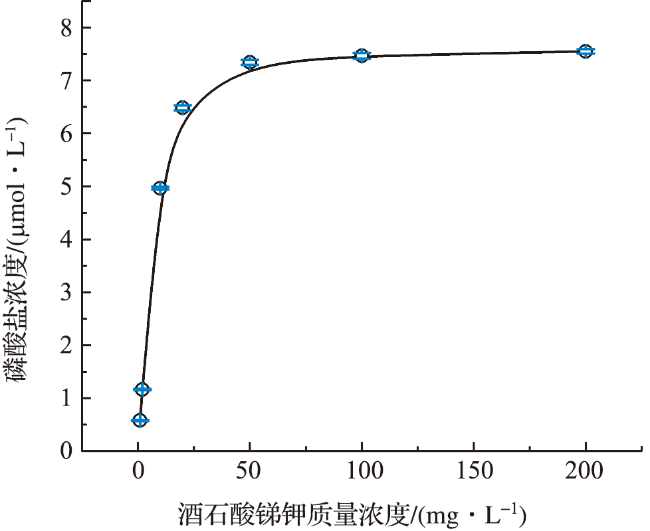
3.2 试剂质量浓度的优化
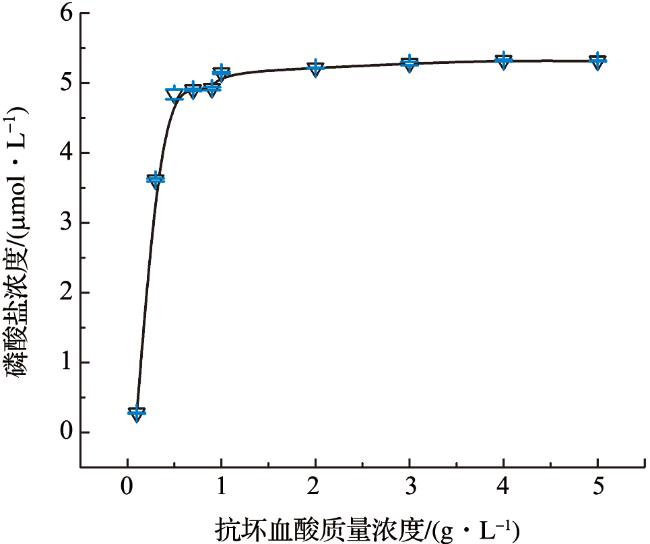
图1 抗坏血酸质量浓度条件优化结果(图中数据点误差棒为3次测量结果的标准偏差,后图同此。) Fig.1 The results of optimization of ascorbic acid mass concentration (The error bar on the dot represents the standard deviation of 3 measurement results. The following pictures are the same.) |
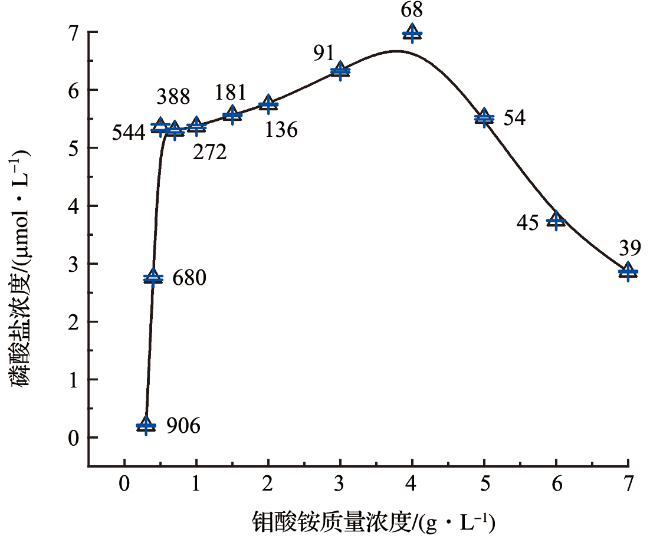
图2 钼酸铵质量浓度条件优化结果(数据点附近的数字为[H+]/[MoO24-]比值。) Fig.2 The results of optimization of ammonium molybdate mass concentration (The numbers near the data point represent the ration of [H+] to [MoO24-].) |
3.3 定值方法性能评价
表1 定值方法准确度和可靠性验证结果Tab.1 The verification results of characterization method accuracy and reliability |
| CRM | 批次 | CRM特性值 /(μmol·L-1) | 测量值 /(μmol·L-1) | 误差 /(μmol·L-1) |
|---|---|---|---|---|
| NMIJ7603-a | No.HO135 | 3.10±0.06 | 3.15 | +0.05 |
| NMIJ7602-a | No.MO182 | 1.09±0.06 | 1.12 | +0.03 |
表2 定值方法精密度验证结果Tab.2 The verification results of characterization method precision |
| 序号 | 样品活性磷酸盐浓度测量结果/(μmol·L-1) | |||
|---|---|---|---|---|
| P1批次 | P2批次 | P3批次 | P4批次 | |
| 1 | 0.57 | 1.00 | 2.06 | 4.03 |
| 2 | 0.56 | 1.00 | 2.08 | 4.04 |
| 3 | 0.57 | 1.01 | 2.07 | 4.02 |
| 4 | 0.60 | 1.01 | 2.03 | 4.04 |
| 5 | 0.57 | 1.02 | 2.02 | 4.03 |
| 6 | 0.57 | 1.02 | 1.99 | 4.06 |
| 7 | 0.60 | 1.04 | 2.05 | 4.02 |
| 8 | 0.58 | 1.00 | 2.04 | 4.01 |
| 9 | 0.57 | 1.04 | 2.11 | 4.04 |
| 平均值 | 0.58 | 1.02 | 2.05 | 4.03 |
| RSD/% | 2.45 | 1.57 | 1.72 | 0.37 |
4 标准物质检验定值结果
4.1 均匀性检验结果
表3 均匀性检验结果Tab.3 The results of homogeneity test |
| 批次 | 实测活性磷酸盐浓度 平均值/(μmol·L-1) | RSD/% | F值 |
|---|---|---|---|
| P1 | 0.57 | 1.89 | 1.37 |
| P2 | 1.02 | 1.34 | 2.20 |
| P3 | 2.05 | 0.91 | 2.01 |
| P4 | 4.02 | 0.62 | 2.20 |
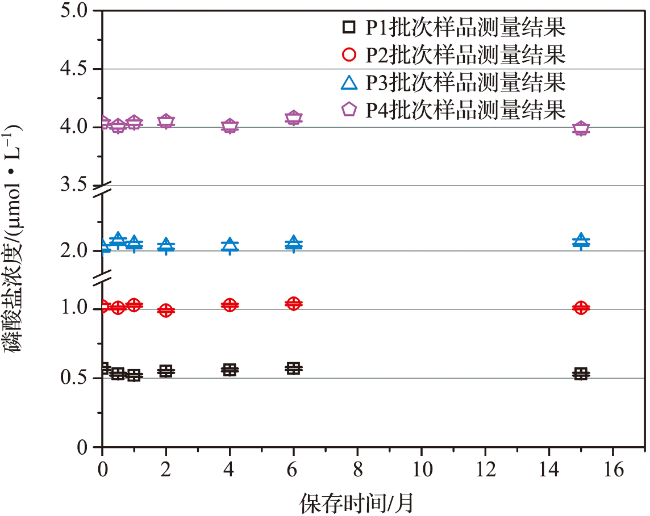
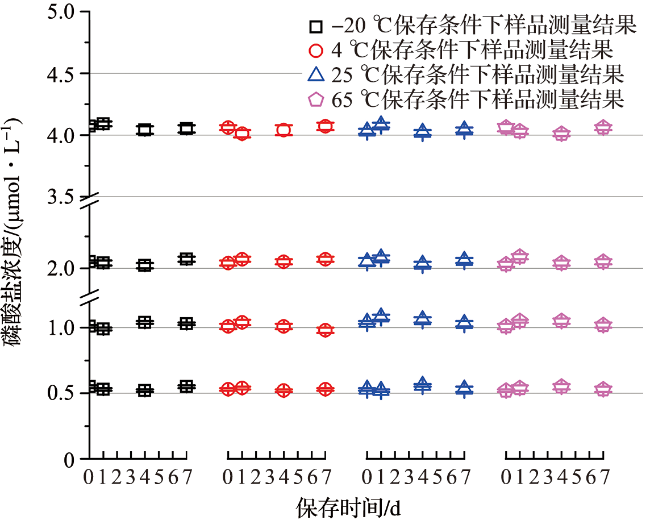
4.2 稳定性检验结果
表4 长期稳定性检验结果Tab.4 The results of long-term stability test |
| 批次 | β1 | s(β1) | t95,n-2×s(β1) |
|---|---|---|---|
| P1 | -1.797 7×10⁻⁵ | 5.661 8×10⁻⁵ | 1.455 6×10⁻⁴ |
| P2 | 4.960 5×10⁻⁷ | 4.656 0×10-5 | 1.197 1×10⁻⁴ |
| P3 | 5.209 6×10⁻⁵ | 5.645 7×10⁻⁵ | 1.451 5×10⁻⁴ |
| P4 | -7.427 9×10⁻⁵ | 7.648 5×10⁻⁵ | 1.966 4×10⁻⁴ |
表5 短期稳定性检验结果Tab.5 The results of short-term stability test |
| 环境 温度/℃ | 批次 | β1 | s(β1) | t95,n-2×s(β1) |
|---|---|---|---|---|
| -20 | P1 | -3.333 3×10⁻⁴ | 2.255 7×10⁻³ | 9.706 5×10⁻³ |
| P2 | 5.000 0×10-3 | 2.343 6×10⁻³ | 1.008 4×10⁻² | |
| P3 | 2.333 3×10⁻³ | 2.934 5×10⁻³ | 1.262 7×10⁻² | |
| P4 | -5.000 0×10-3 | 2.345 9×10⁻³ | 1.008 4×10⁻² | |
| 4 | P1 | -2.333 3×10⁻³ | 1.536 6×10⁻³ | 6.611 9×10⁻³ |
| P2 | -6.000 0×10-3 | 2.335 5×10⁻³ | 1.005 0×10-2 | |
| P3 | 2.333 3×10⁻³ | 1.968 8×10⁻³ | 8.471 8×10⁻³ | |
| P4 | 4.000 0×10-3 | 3.503 2×10⁻³ | 1.507 4×10⁻² | |
| 25 | P1 | -1.666 7×10⁻³ | 2.487 3×10⁻³ | 1.070 3×10⁻² |
| P2 | -3.333 3×10⁻³ | 2.940 9×10⁻³ | 1.265 5×10⁻² | |
| P3 | -1.333 3×10⁻³ | 3.073 2×10⁻³ | 1.322 4×10⁻² | |
| P4 | -2.333 3×10⁻³ | 3.805 6×10⁻³ | 1.637 5×10⁻² | |
| 65 | P1 | -1.000 0×10-3 | 1.887 0×10-3 | 8.119 6×10⁻³ |
| P2 | 0 | 3.107 9×10⁻³ | 1.337 3×10⁻² | |
| P3 | -1.000 0×10-3 | 3.936 0×10-3 | 1.693 7×10⁻² | |
| P4 | -3.333 3×10⁻⁴ | 3.689 3×10⁻³ | 1.587 5×10⁻² |
4.3 定值结果及不确定度
表6 原始数据统计检验结果Tab.6 The results of raw data statistical test |
| 批次 | 格拉布 斯检验 | 科克伦 检验 | 狄克逊 检验 | 正态分 布检验 | 总体平均值 /(μmol·L-1) | 总体SD /(μmol·L-1) |
|---|---|---|---|---|---|---|
| P1 | 通过 | 等精度 | 无离群值 | 通过 | 0.53 | 0.03 |
| P2 | 通过 | 等精度 | 无离群值 | 通过 | 1.02 | 0.02 |
| P3 | 通过 | 等精度 | 无离群值 | 通过 | 2.03 | 0.04 |
| P4 | 通过 | 等精度 | 无离群值 | 通过 | 4.01 | 0.04 |
注:SD表示标准偏差,下表同此。 |
表7 联合定值测量结果Tab.7 The results of combine characterization单位:μmol/L |
| 实验室 代号 | P1批次 | P2批次 | P3批次 | P4批次 | ||||
|---|---|---|---|---|---|---|---|---|
| 平均值 | SD | 平均值 | SD | 平均值 | SD | 平均值 | SD | |
| A | 0.56 | 0.005 | 1.02 | 0.014 | 2.03 | 0.008 | 4.03 | 0.015 |
| B | 0.49 | 0.008 | 0.98 | 0.008 | 1.98 | 0.008 | 3.96 | 0.019 |
| C | 0.52 | 0.013 | 1.03 | 0.015 | 2.08 | 0.010 | 4.06 | 0.010 |
| D | 0.56 | 0.000 | 1.05 | 0.004 | 2.08 | 0.010 | 4.00 | 0.008 |
| E | 0.50 | 0.009 | 1.02 | 0.009 | 2.00 | 0.008 | 3.98 | 0.027 |
| F | 0.56 | 0.008 | 1.01 | 0.009 | 2.04 | 0.018 | 4.04 | 0.014 |
表8 不确定度分析结果Tab.8 The results of uncertainty analysis 单位:μmol/L |
| 项目 | P1批次 | P2批次 | P3批次 | P4批次 |
|---|---|---|---|---|
| ubb | 0.006 | 0.011 | 0.014 | 0.019 |
| ults | 0.021 | 0.017 | 0.021 | 0.028 |
| uchar | 0.014 | 0.010 | 0.017 | 0.015 |
| uCRM | 0.026 | 0.023 | 0.030 | 0.037 |
| U(k=2) | 0.052 | 0.046 | 0.060 | 0.074 |
| Urel(k=2) | 10% | 5% | 3% | 2% |
注:ubb、ults、uchar分别为均匀性、长期稳定性、定值引入的不确定度分量,uCRM为合成标准不确定度,U、Urel分别扩展不确定度及相对扩展不确定度。 |