
0 引言
1 样品和方法

图1 研究区区域位置(a)及地形图(b)(图a指示了东太平洋克拉里昂—克里帕顿断裂带(CC区)的区域位置,其中黑色线条为断裂带,白色线条为洋壳年龄等时线[14],红色方框代表研究区在CC区的地理位置。图b中白色虚线为研究区南北部界线。) Fig.1 Tectonic location (a) and topography (b) of the study area (Fig.a indicates the regional location of the Clarion—Clipperton Fracture Zone (CCZ) in the East Pacific Ocean, where the black line is the fracture zone, the white lines are the oceanic crust age isochron[14], and the red box represents the geographical location of the study area. The white dash line in fig.b indicates the boundary that separates study area into north and south parts. ) |
2 东太平洋CC区沉积物地球化学标志
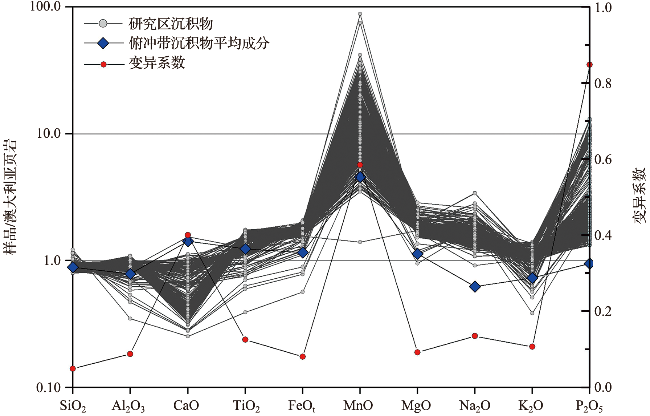
2.1 主量元素特征
表1 研究区沉积物主量元素组成统计结果Tab.1 Statistical results of major element compositions of sediments in the study area 单位:% |
| 类别 | SiO2 | Al2O3 | CaO | TiO2 | FeOt | MnO | MgO | Na2O | K2O | P2O5 |
|---|---|---|---|---|---|---|---|---|---|---|
| 最大值 | 80.01 | 16.53 | 6.47 | 0.88 | 9.28 | 6.16 | 6.29 | 13.23 | 3.91 | 2.62 |
| 最小值 | 52.21 | 5.30 | 1.06 | 0.20 | 2.54 | 0.10 | 2.08 | 3.56 | 1.07 | 0.26 |
| 平均值 | 60.36 | 14.78 | 1.92 | 0.75 | 7.62 | 0.91 | 3.92 | 6.16 | 2.99 | 0.60 |
| 标准差 | 2.55 | 1.22 | 0.78 | 0.09 | 0.59 | 0.54 | 0.39 | 0.94 | 0.30 | 0.51 |
| 变异系数 | 0.04 | 0.08 | 0.41 | 0.12 | 0.08 | 0.59 | 0.10 | 0.15 | 0.10 | 0.86 |
| GLOSS | 58.57 | 11.91 | 5.95 | 0.62 | 5.21 | 0.32 | 2.48 | 2.43 | 2.04 | 0.19 |
| PAAS | 65.89 | 15.17 | 4.19 | 0.50 | 4.49 | 0.07 | 2.20 | 3.89 | 2.80 | 0.20 |
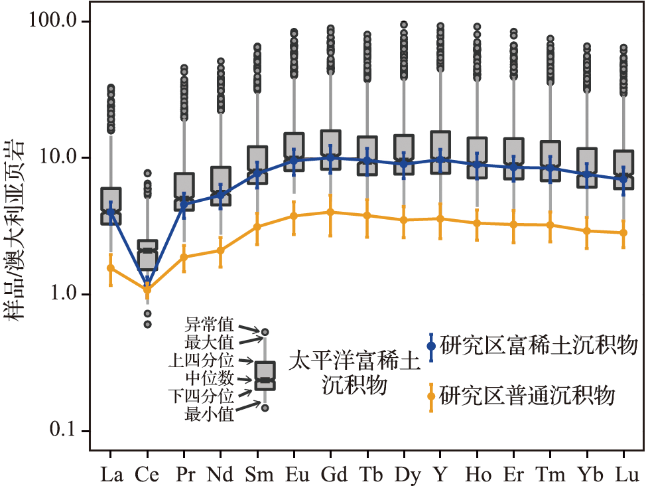
2.2 稀土元素特征
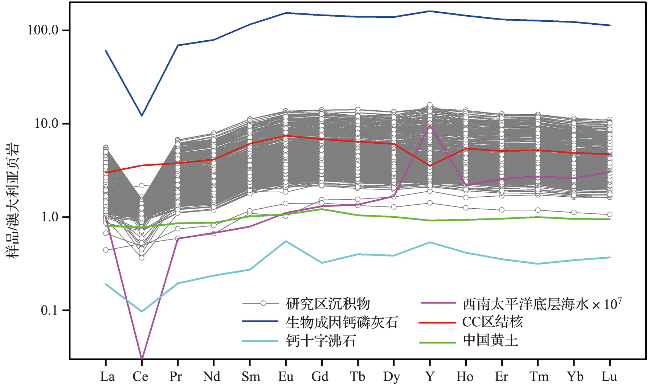
图3 研究区沉积物稀土元素配分模式图(数据来源:西南太平洋底层海水数据来自文献[20],生物成因钙磷灰石和钙十字沸石数据来自文献[16],CC区结核数据来自文献[21],中国黄土数据来自文献[22]。) Fig.3 REY distribution pattern of sediments in the study area (Data sources: bottom seawater of Southwest Pacific Ocean data are from reference [20], biogenic calcium apatite and calcium zeolite data are from referende [16], CCZ nodules data are from reference [21], Chinese loess data are from reference [22].) |
2.3 元素空间分布特征

图4 研究区沉积物主量元素空间分布图(底图为灰阶地形图。) Fig.4 Spatial distribution of major elements of sediments in the study area (The base map is a gray-scale topographic map.) |
