
0 引言
一个多世纪以来,科学家们通过多种方法测量海面温度,主要包括船舶观测、漂流浮标和Argo浮标等[9⇓⇓⇓⇓⇓-15]。这些传统方法各有优缺点:船舶观测可以提供高精度数据,但覆盖范围有限且成本较高;漂流浮标和Argo浮标可以提供广泛的空间覆盖,但数据时间分辨率较低。因此,尽管这些现场观测方法提供了宝贵的海面温度数据,但它们在时间和空间上的分布仍然不均匀,难以获得全面连续的海面温度信息。随着现代遥感技术的发展,使用卫星数据日益普及,这为获取更广泛、连续的海面温度数据提供了可能[16]。目前,美国国家海洋和大气管理局的地球静止作业环境卫星(Geostationary Operational Environmental Satellite, GOES)[17]、欧洲气象卫星开发组织的第二代气象卫星Meteosat[18]、韩国气象局的通信、海洋和气象卫星(Communication, Ocean and Meteorological Satellite, COMS)[19]以及中国气象局的风云四号系列地球静止轨道卫星[20]已经成为海面温度监测数据的重要来源。这些卫星提供的长时间、高分辨率的海温数据对于短期气候监测和预报具有重要意义[21]。但是,由于传感器的性能、大气条件等多种因素的影响,卫星数据的精度不能保证,因此,卫星数据的验证和校准变得尤为重要[22-23]。例如,门聪[24]研究表明,通过与地面数据的比对和校准,可以显著提高海洋一号B卫星的海面温度数据的准确性和可靠性。
对于地球静止卫星海面温度数据的验证,可以通过与海面测量数据的比对,有效评估卫星数据的准确性。例如,LUO等[25]利用部署在船上的海洋大气发射辐射干涉仪获得的独立数据验证了美国GOES-16上高级基线成像仪的海面温度数据。TU等[26]利用现场测量数据对日本宇宙航空研究开发机构发布的2年的Himawari-8卫星海面温度数据进行了时间和空间上的误差验证。LE BORGNE等[27]将欧洲第二代气象卫星上的自旋增强可见光与红外成像仪(spinning enhanced visible and infrared imager, SEVIRI)反演的海面温度数据与漂流浮标1年的数据进行了日变暖估计的对比,发现两者具有一致性。
本文旨在对欧洲静止气象卫星Meteosat-8/SEVIRI(M8)在印度洋区域的海面温度数据进行全面验证,通过对比不同类型的现场测量数据,研究误差的时空变化。这将有助于评估M8卫星海面温度数据的适用性和局限性,为海洋和气象应用提供科学支持。
1 数据与方法
1.1 数据来源
1.1.1 M8卫星海面温度数据
M8卫星海面温度数据由欧洲气象卫星应用组织的海洋和海冰应用机构提供。M8卫星搭载了光学成像辐射计SEVIRI作为主要有效载荷。 SEVIRI是一种多功能成像仪,具备12个可见光和红外光谱通道。本研究主要使用了M8卫星上SEVIRI测量的次表层海面温度产品。该产品的空间范围涵盖60°S—60°N,18.5°W—101.5°E,空间分辨率为0.05°,时间分辨率为1 h。海面温度数据采用质量标志指数进行分类,包括0(未处理)、1(错误)、2(差)、3(可接受)、4(好)和5(优秀)。
为了研究M8卫星海面温度产品误差的时空变化,使用了从2017年4月—2022年3月的长期数据(https://osi-saf.ifremer.fr/sst/l3c/east_atlantic_west_indian/)。
1.1.2 实测数据
实测海面温度数据从第二版实测海面温度质量监测平台(iQuam v2.10)获取(https://www.star.nesdis.noaa.gov/socd/sst/iquam/)。本文选取了其中的船只、漂流浮标和Argo浮标等三种主要实测数据进行验证。
需要说明的是,本文中使用的M8卫星海面温度数据是指次表层海面温度,而现场测量通常在不同的深度进行:船测海面温度通常集中在水面下1~10 m;漂流浮标通常浮于水面下20~30 cm进行测量;Argo浮标主要用于测量从表层到深海(最深可达2 000 m)的水温和盐度,其在测量周期中会浮到海面进行数据传输。
1.2 研究方法
1.2.1 M8卫星海面温度反演算法
SST=(a+bSΘ)T10.8+(c+dSΘ+eTclim)(T10.8-T12.0)+f+gSΘ
式中:SΘ=sec(Θ)-1,Θ是卫星天顶角;T10.8和T12.0是两个热红外波段(10.8 μm和12.0 μm)的亮温;Tclim是气候态海面温度;a~g为系数,通过模拟亮温并结合漂流浮标的观测数据进行回归分析和调整得出。
利用RTTOV(radiative transfer for TOVS)辐射传输模式对数值天气预报(numerical weather prediction,NWP)模式大气廓线数据集中计算的亮温进行回归模拟,确定系数a~g,然后对f和g进行校准,确保M8卫星反演的SST不会对水面下20~30 cm的漂流浮标测量结果产生全球偏差。(T10.8-T12.0)用于该“分裂窗”算法,以校正大气中水蒸气的吸收。
由于是利用RTTOV辐射传输模型的模拟结果建立的M8卫星SST算法的系数,并针对漂流浮标测量(深度为20~30 cm)进行了去偏处理,因此,M8卫星反演的SST被认为是次表层SST。将反演的SST数据定位到60°S—60°N,18.5°W—101.5°E进行投影,经度方向选择2 400个采样点,纬度方向选择2 400个采样点,从而得到0.05°×0.05°网格的M8卫星海面温度数据。
1.2.2 匹配方法
在对M8卫星的小时分辨率海面温度数据与各实测平台数据进行匹配前,首先对这些数据进行质量控制。iQuam实测数据集中包含质量级别标签,质量等级范围为0~5,本文采用最高质量等级5的实测数据进行分析。M8卫星海面温度数据文件也包括质量级别标签,质量等级范围为2~5。本文使用质量等级为3、4、5的数据,分别占总数据量的11.25%、16.95%和31.72%。
经初步的质量控制后,将M8卫星海面温度数据与各实测平台数据进行匹配。匹配的空间窗口范围设定为0.05°×0.05°,即在卫星像素单元格内搜索所有实测数据。在时间上,M8卫星海面温度数据与实测平台数据的时间差不超过10 min。
完成匹配后,将匹配时间由世界时转换为地方时,以便后续开展昼夜差别研究。本文中的夜间定义为太阳天顶角在110°~180°范围内的时段,白天定义为太阳天顶角在0°~90°范围内的时段,黄昏定义为太阳天顶角在90°~110°范围内的时段(本文未对黄昏的海面温度进行对比评估)。使用平均偏差(Bias)、均方根误差(RMSE)、决定系数(R2)、鲁棒标准差(RSD)来评估M8卫星海面温度数据。Bias反映两种数据产品间的差异程度;RMSE又称为标准误差,反映M8卫星产品的精度,其值越大说明M8卫星反演的海面温度产品精度越低[34];R2反映M8卫星数据与实测数据之间的线性关系,当二者线性回归结果越接近1,M8卫星反演的海面温度质量越高;RSD表示数据分布的稳健性,通常用于减少极端值的影响[26]。Bias、RMSE、R2和RSD的计算公式如下:
Bias=
RMSE=
R2=1-
RSD=
式中:tsatellite为M8卫星海面温度值;tin situ为实测海面温度值;Q3为第三分位数,是数据从小到大排序后,位于75%位置的值;Q1为第一分位数,是数据从小到大排序后,位于25%位置的值。
2 M8卫星与实测平台数据的匹配特征
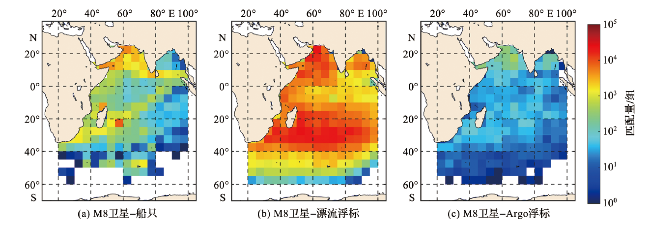
针对M8卫星在印度洋区域(60°S—25°N,20°E—101.5°E)的数据进行验证,时间跨度为2017年4月—2022年3月,共5年。本节给出了M8卫星与三种实测平台数据匹配的空间和时间特征。图1显示了M8卫星与船只、漂流浮标和Argo浮标三种实测平台数据匹配的空间分布情况。三种实测平台的数据几乎覆盖了M8卫星在印度洋的整个观测范围,但匹配数据的空间密度分布很不均匀。船只数据在阿拉伯海沿岸和主要航线上的样本数量较多,每个网格都有成千上万组数据匹配;而在主要航线以外地区,数据量相对较少,特别是南印度洋的中纬度区域、热带东印度洋和孟加拉湾海域数据非常稀少,大多数网格只有几十至上百组数据匹配(图1a)。漂流浮标数据在整个验证区域的覆盖最为密集和完整,大部分地区都有超过上万组数据匹配,部分地区甚至有超过几十万组数据匹配,但在赤道东印度洋和50°S—60°S的区域匹配数据相对较少(图1b)。赤道地区漂流浮标数据匹配量较少可能是由于赤道上升流和表层海流的影响导致漂流浮标远离赤道。此外,云层覆盖和降水等因素也可能降低了M8卫星与漂流浮标的数据匹配量。Argo浮标数据与M8卫星海面温度的数据匹配量最少(图1c),比漂流浮标匹配的数据量少了2~3个数量级。
为进一步分析匹配数据的代表性,绘制了M8卫星与三种实测数据的海面温度、纬度和经度匹配情况分布直方图(图2)。在所有匹配数据中,实测海面温度范围在-2 ~36 ℃之间,其中在28~30 ℃附近匹配情况最好;10 ℃以下温度范围内的匹配度较低,主要是因为卫星观测数据受限于印度洋的范围(60°S—25°N),同时实测数据主要集中在热带地区(图2a)。纬度匹配分布表现出明显的双峰特征,数据匹配主要集中在27°S—33°S和12°N—15°N附近,而赤道地区和40°S以南的中纬度地区匹配数量较少(图2b)。经度匹配分布中,最大值主要分布在50°E—71°E之间的海域,而30°E以西和卫星观测边缘的95°E—100°E海域的匹配数量较少(图2c)。
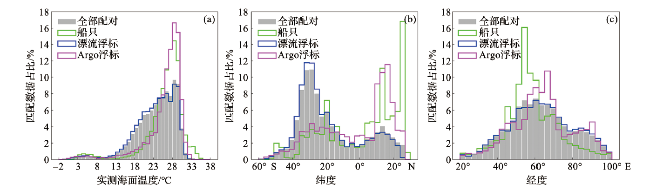
图2 M8卫星与三种实测数据的海面温度(a)、纬度(b)和经度(c)匹配情况分布直方图(海面温度分组间隔为1 ℃,纬度和经度分组间隔为3°,直方图归一化积分为1。) Fig.2 Histograms of SST (a), latitude (b) and longitude (c) distributions for paired M8 and three in-situ platforms (Grouped by 1 ℃ for SST and 3° for latitude and longitude,histograms normalized to a sum of 1.) |
分别比较M8卫星与三种实测数据的匹配情况发现,M8卫星与漂流浮标的匹配情况主导了总匹配数据的变化趋势。这是因为M8卫星与漂流浮标的数据匹配量远远超过与船只、Argo浮标的数据匹配量(图1)。M8卫星与船只、Argo浮标匹配的数据主要集中在阿拉伯海区域。
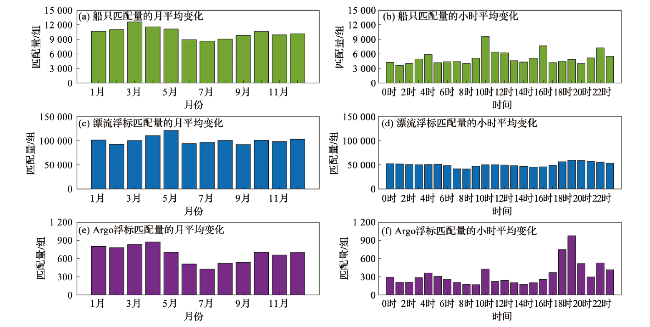
对M8卫星与三种实测平台的匹配数据进行时间分布研究。各实测平台记录的时间为世界时,此处已将实测数据的时间转化为当地时间。图3a、3c和3e表示了M8卫星与三种实测平台数据匹配量的月平均变化。漂流浮标是主要的数据匹配贡献者,各月数据匹配量均占总匹配量的90%以上。船只和Argo浮标每月的平均匹配量约为10 340组和672组。从月份来看,漂流浮标的匹配量在4月和5月较高,在其他月份较为平均;船只和Argo浮标的匹配量在3月和4月较高,在6—9月相对较低。图3b、3d和3f表示了M8卫星与三种实测平台数据匹配量的小时平均变化。M8卫星与船只和Argo浮标数据的小时平均匹配量分布很不均匀,与船只数据的匹配量在10时、16时和22时较多,与Argo浮标数据的匹配量在18时和19时较多,在其余时间的分布也不均匀。M8卫星与漂流浮标数据匹配分布较为均匀,在上午7时、8时和下午的15时、16时匹配数量较少,在夜间匹配数量较多。
综上所述,M8卫星与漂流浮标数据匹配数量最多,空间覆盖范围相对均匀,匹配量的月平均变化和小时平均变化都比较小,漂流浮标数据是验证M8卫星海面温度的理想实测数据源;船只在阿拉伯海沿岸和航线周围具有较多数据,与M8卫星数据的匹配量在不同月内和日内均略有差异;三种实测数据中,Argo浮标数据与M8卫星匹配量最少、空间覆盖率最低,较漂流浮标与船只数据的匹配量分别低2个和1个数量级,同时匹配数量在年内和日内分布都不均匀。
3 M8卫星数据与实测数据误差分析
3.1 整体误差统计
表1 M8卫星与三种实测海面温度数据的误差统计表Tab.1 Statistical table of SST errors between M8 and three in-situ platforms |
| 实测平台 | 匹配量/组 | 平均偏差/℃ | 均方根误差/℃ | 决定系数 |
|---|---|---|---|---|
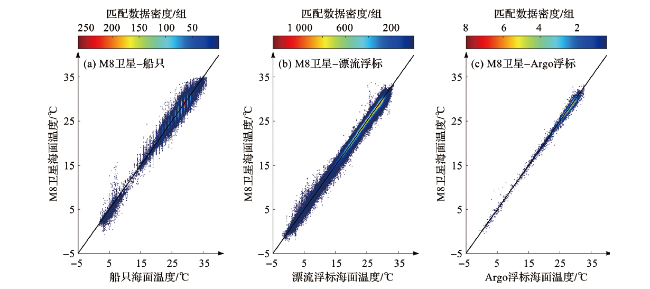
| 船只 | 124 089 | -0.10 | 1.03 | 0.96 |
| 漂流浮标 | 1 208 438 | -0.06 | 0.48 | 0.99 |
| Argo浮标 | 8 067 | -0.10 | 0.53 | 0.99 |
3.2 误差的空间分布
图5a~5c给出了M8卫星与三种实测平台数据间平均偏差的空间分布特征。M8卫星与船只数据相比,在孟加拉湾、阿拉伯海、非洲沿岸地区以及南部卫星观测边缘地区呈现0.1~0.8 ℃的负偏差,在其余大部分地区呈现0.1~1.0 ℃的正偏差,在部分地区偏差绝对值超过1.0 ℃。M8卫星与漂流浮标数据相比,在阿拉伯海和孟加拉湾呈现0.1~0.6 ℃的负偏差,其余地区为弱的负偏差或者接近0.0 ℃的偏差。M8卫星与Argo浮标数据的对比情况整体与船只数据类似,但偏差的绝对值更小。
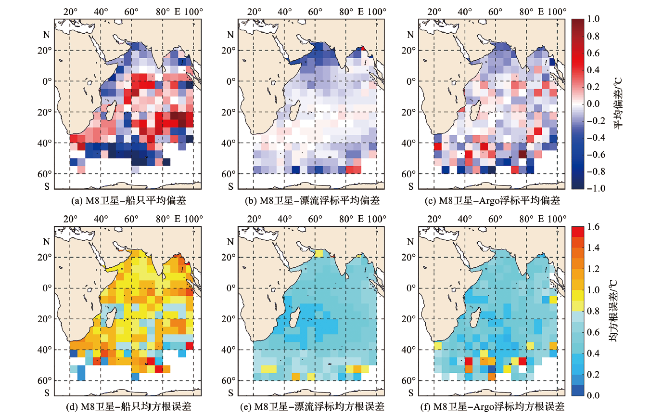
图5d~5f为M8卫星与船只、漂流浮标以及Argo浮标数据之间均方根误差的空间分布情况。M8卫星与船只数据的均方根误差在大部分地区均超过0.8 ℃,在赤道、孟加拉湾和20°S—50°S靠近非洲地区超过1.0 ℃,在卫星观测边缘部分地区超过1.2 ℃。M8卫星与漂流浮标以及Argo浮标数据的均方根误差在大部分地区低于0.6 ℃,在卫星观测边缘部分地区超过0.8 ℃。
通过平均偏差以及均方根误差的对比发现,M8卫星与漂流浮标数据间的一致性最好;Argo浮标虽然测量深度较深,但仪器精度较高,所以M8卫星与Argo浮标数据间的偏差也较小;可能由于船只测量深度较深,且船测海面温度数据具有较大不确定性,M8卫星与船只数据间具有较大的平均偏差以及均方根误差。
3.3 误差的时间分布
下面进一步分析M8卫星数据与三种实测平台数据间的月平均和小时平均的误差情况。M8卫星与三种实测海面温度数据在不同月份的平均偏差基本为负值(图6a),M8卫星与漂流浮标数据在6—8月偏差较小,其中7、8月出现小于0.1 ℃的正偏差,其余月份则稳定为0.1 ℃左右的负偏差;M8卫星与船只数据在4月、5月和7月偏差较大,大于-0.2 ℃,在3月和12月偏差最小,接近于0.0 ℃,其余月份偏差在-0.1~0.0 ℃之间;M8卫星与Argo浮标数据在6月偏差较大,约为-0.2 ℃,在12月偏差最小,接近于0.0 ℃,其余月份偏差在-0.2~0.0 ℃之间。月平均的均方根误差(图6c)分析表明,M8卫星与船只数据的均方根误差在每个月都高于其他平台,基本在1.0 ℃左右,呈现一定的波动,特别是在6月和8月,达到最大值,约为1.1 ℃。M8卫星与漂流浮标和Argo浮标数据的均方根误差相对较小,在0.4~0.7 ℃之间,且全年内变化趋势较为一致。
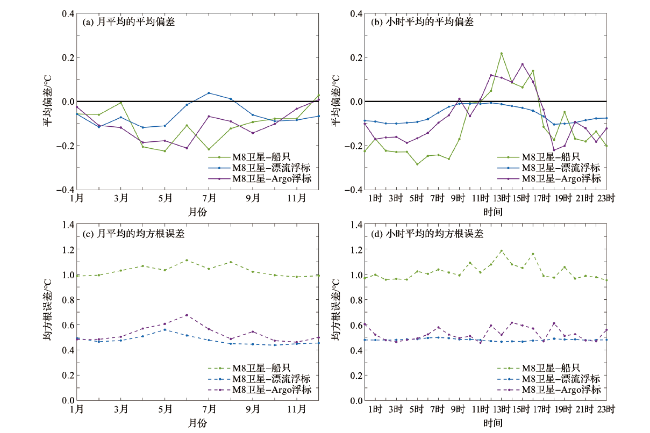
通过小时平均误差分析(图6b和6d)发现,夜间(19时—次日5时),M8卫星与漂流浮标数据平均偏差约为-0.1 ℃,早上5、6时偏差开始变小,中午10时—12时偏差最小,基本接近0.0 ℃,随后偏差开始逐渐增大,至傍晚18时,偏差增至-0.1 ℃;M8卫星与漂流浮标数据的均方根误差在24 h内较为稳定,约为0.5 ℃。M8卫星与船只数据的偏差在夜间均为负,且偏差较大,5时负偏差达到最大,约为-0.3 ℃,从8时开始负偏差逐渐减小直至转为正偏差,到13时,达到最大正偏差,约为0.2 ℃;M8卫星与船只数据不同时刻的均方根误差在0.9 ~1.2 ℃间波动,最大值出现在13时,夜间的均方根误差较小。M8卫星与Argo浮标数据的小时平均的偏差变化特征与船只类似,但从4时起负偏差开始逐渐减小转为正偏差,到15时表现出约0.2 ℃的正偏差,随后偏差回落,至傍晚18时左右,出现最大负偏差,约为-0.2 ℃。
在小时平均统计中,M8卫星与三种实测平台数据在夜间均呈现负偏差,表明M8卫星在夜间相对各实测平台温度均偏低;日出后,M8卫星反演的海面温度迅速升高,M8卫星与实测平台数据间的偏差向正值偏移。M8卫星与漂流浮标数据间的偏差波动较小,而与船只和Argo浮标数据间的偏差波动较大,可能与这两个实测平台测量深度较深有关,同时也可能与船只和Argo浮标匹配数量少有关,较少的匹配数量会导致一些时刻的卫星海面温度无法得到有效验证。
3.4 M8卫星夜间与白天海面温度验证
由于M8卫星在夜间和白天海面温度的反演算法存在差异,下面分别对夜间和白天的反演数据进行准确性评估。这里仅选用与M8卫星数据匹配数目多、覆盖范围广、偏差小的漂流浮标数据进行对比。
统计结果(表2)表明:M8卫星与漂流浮标的匹配量在夜间和白天分别为470 166组和566 952组;夜间和白天海面温度的平均偏差均为负值,分别为-0.08 ℃和-0.04 ℃,夜间偏差相较白天更大;夜间和白天海面温度偏差的中位数分别为-0.05 ℃和0.00 ℃;均方根误差分别为0.47 ℃和0.48 ℃;鲁棒标准差分别为0.41 ℃和0.40 ℃。
表2 M8卫星与漂流浮标夜间和白天海面温度误差统计Tab.2 Statistics of SST errors between M8 and drifting buoys for night and day |
| 时段 | 匹配量/组 | 平均偏差/℃ | 偏差中位数/℃ | 均方根误差/℃ | 鲁棒标准差/℃ |
|---|---|---|---|---|---|
| 夜间 | 470 166 | -0.08 | -0.05 | 0.47 | 0.41 |
| 白天 | 566 952 | -0.04 | 0.00 | 0.48 | 0.40 |
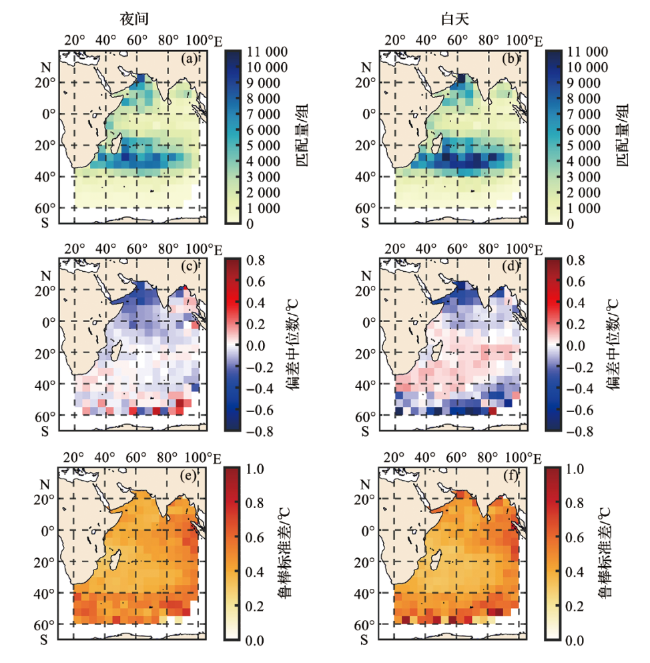
为研究M8卫星与漂流浮标实测数据夜间与白天误差的空间变化特征,图7分别给出了夜间与白天M8卫星与漂流浮标数据间的匹配量、偏差中位数和鲁棒标准差的空间分布特征。在阿拉伯海和南印度洋副热带环流圈(20°S—40°S)地区数据匹配量较多,夜间与白天均超过4 000组,部分区域数据匹配量甚至为上万组;而在热带东印度洋和40°S—60°S区域,夜间与白天的数据匹配量基本不足1 000组(图7a~7b)。在夜间,M8卫星数据在阿拉伯海西北部和孟加拉湾西北部出现了0.6 ℃左右的极大负偏差,在南印度洋副热带环流圈偏差绝对值不超过0.1 ℃,而在南印度洋卫星观测边缘的部分区域,出现了超过0.6 ℃的正偏差(图7c)。相较于夜间,M8卫星数据白天在阿拉伯海、孟加拉湾和南印度洋卫星观测边缘地区显示出更明显的负偏差,40°S—60°S部分区域甚至出现了绝对值超过1.0 ℃的负偏差,而在南印度洋的大部分地区,卫星数据偏差大多为不超过0.1 ℃的正偏差(图7d)。M8卫星与漂流浮标数据的鲁棒标准差的空间分布特征(图7e~7f)表明,夜间和白天的情况基本一致,在阿拉伯海和热带西印度洋地区,M8卫星与漂流浮标数据间鲁棒标准差均不超过0.5 ℃,但在热带东印度洋和40°S—60°S 的部分地区,M8卫星与漂流浮标数据的鲁棒标准差超过了0.6 ℃,局部区域甚至超过了1.0 ℃。
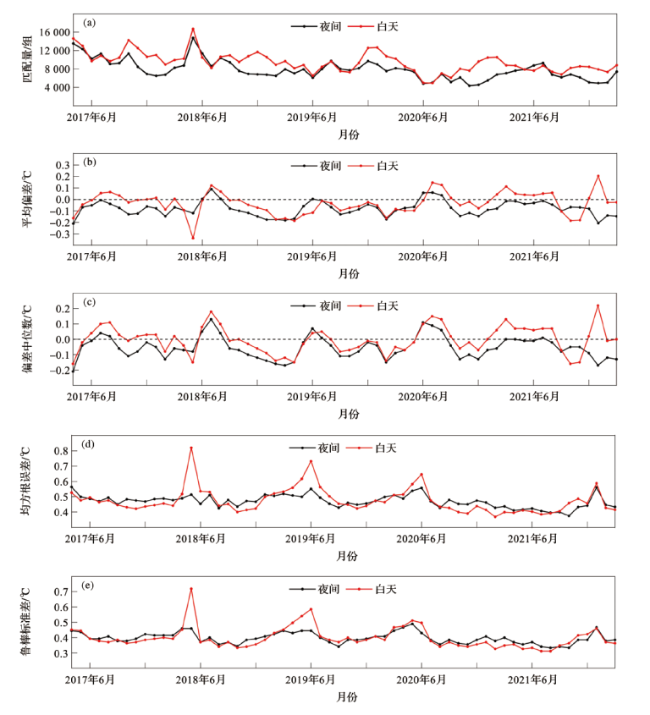
结合2017—2022年M8卫星与漂流浮标数据的平均偏差(图8b)与偏差中位数(图8c)变化情况可以看出,白天的正偏差极大值主要出现在每年的6—8月(夏季)、2021年2—5月以及2022年1月,最大正偏差出现在2022年1月,约为0.2 ℃;负偏差极小值主要出现在2017年4月、2018年5月、2019年4月、2020年2月以及2021年的10—11月,即负偏差极小值主要出现在每年的春、夏转换季,最小负偏差出现在2018年5月,约为-0.34 ℃。夜间的正偏差极大值出现在每年的夏季,最大正偏差出现在2018年7月,约为0.1 ℃;负偏差极小值出现在2017年4月、2019年3月、2020年2月和2022年1月,最小负偏差出现在2022年1月,约为-0.21 ℃。
3.5 M8卫星数据偏差和各参数间的关系
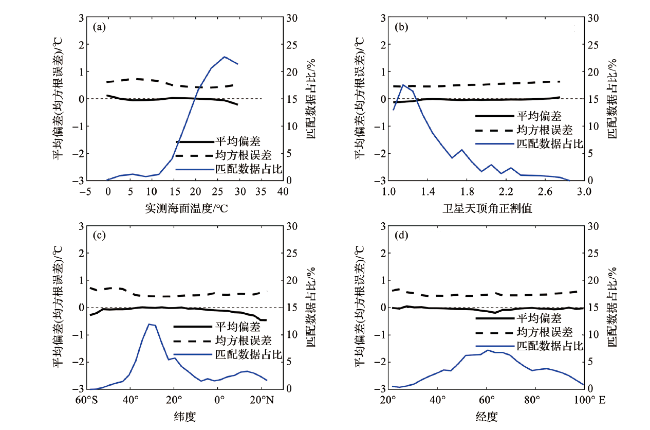
实测海面温度、卫星天顶角、经度和纬度等参数在卫星产品中扮演着重要角色。将M8卫星与漂流浮标实测数据间的偏差作为这些参数的函数(图9),以此来探究M8卫星反演海面温度的准确性和稳定性。
由图9a可知,当实测海面温度大于10 ℃,匹配数据量迅速上升,实测海面温度为25 ℃左右,匹配数据量最大。实测海面温度在5 ℃以下,M8卫星数据表现为微弱正偏差,温度在25 ℃以上时,M8卫星数据表现为0.0~0.2 ℃的负偏差。由图9b可知,匹配数据主要集中在卫星天顶角正割值为1.0~1.4的区间,在此区间内,M8卫星数据具有0.1 ℃左右的负偏差。随着卫星天顶角的增大,M8卫星数据并未出现较大偏差。由图9c和9d可知,匹配数据主要集中在30°S附近海域以及60°E附近的阿拉伯海海域,负偏差的主要贡献来自于阿拉伯海以及卫星观测南部边缘地区,在其他大部分地区M8卫星数据均表现出了较高的可靠性。
4 结论
本文将欧洲静止气象卫星M8在印度洋区域反演的小时分辨率海面温度数据与船只、漂流浮标以及Argo浮标数据进行了全面对比验证,得到如下结果。
1)M8卫星与漂流浮标数据之间的匹配最好,说明漂流浮标是理想的实测数据源。M8卫星数据与三种实测平台数据间的决定系数均大于0.96,表明M8卫星数据与不同数据源的实测数据之间均具有较强的一致性,显示出与实测数据高度一致的特征,M8卫星海面温度数据具有较高的可靠性和准确性。
2)M8卫星与三种实测平台数据的平均偏差均为负值,与Argo浮标和漂流浮标的数据偏差较小且分布均匀,与船只数据的偏差较大,且在空间分布上呈现出明显的不均匀性。M8卫星数据与实测平台数据之间的偏差具有明显的季节性和日周期性。
3)M8卫星与漂流浮标数据间偏差的小时平均变化和月平均变化分析表明,M8卫星在阿拉伯海西北部和孟加拉湾西北部夜间存在0.6 ℃的负偏差,而白天在40°S—60°S部分区域出现了超过1.0 ℃的负偏差。M8卫星反演的海面温度在夏季较易出现正偏差的极大值,在春、夏转换季则存在极小负偏差。这种日夜变化的差异对于改进气候模型和气候监测具有重要意义。
虽然本研究在卫星准确度验证方面取得了积极成果,但仍需进一步探讨和解释M8卫星数据与实测数据间存在细微偏差的具体原因。未来将聚焦于大气条件、海洋表层动力过程对卫星数据的影响以及进一步提高数据处理算法的精确度方面的研究,从而优化海面温度的监测和预测能力。