
0 引言
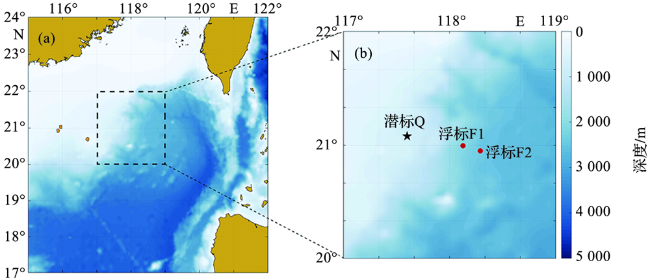
1 数据
2 方法
2.1 一维内孤立波理论方程
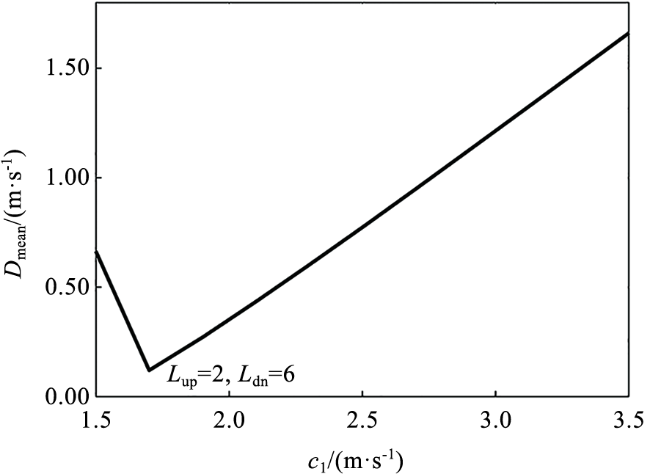
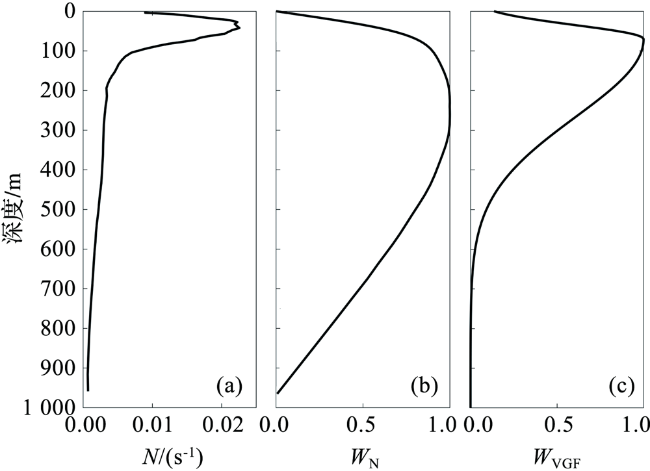
2.2 速度-高斯函数模型求解波函数
3 结果与讨论
3.1 潜标观测验证
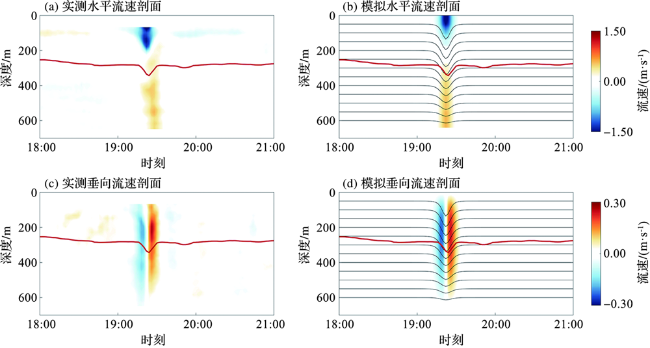
图4 潜标实测全水深水平、垂向波致流剖面(a,c)和速度-高斯函数模型输出的全水深水平、垂向波致流剖面(b,d)(红线显示了ADCP记录的260 m处的内孤立波振幅,黑线显示了速度-高斯函数模型输出的全水深振幅。) Fig.4 The measured horizontal and vertical wave-induced flow profile of the entire water depth measured by the submersible mark(a,c), horizontal and vertical wave-induced flow profile output by the Velocity-Gaussian Function Model in the entire water depth(b,d) (The red line shows the amplitude of the internal solitary wave at 260 m recorded by the ADCP, while the black line corresponds to the full-water-depth amplitude output by the Velocity-Gaussian Function Model.) |
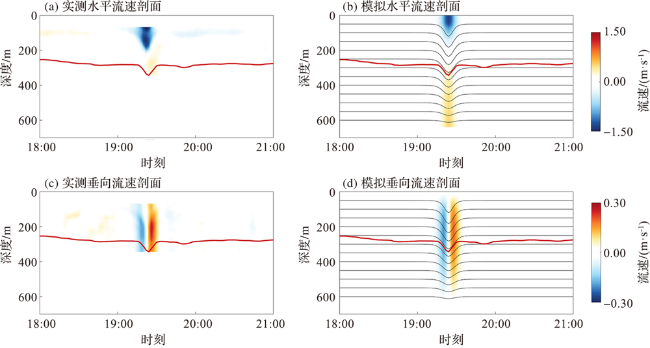
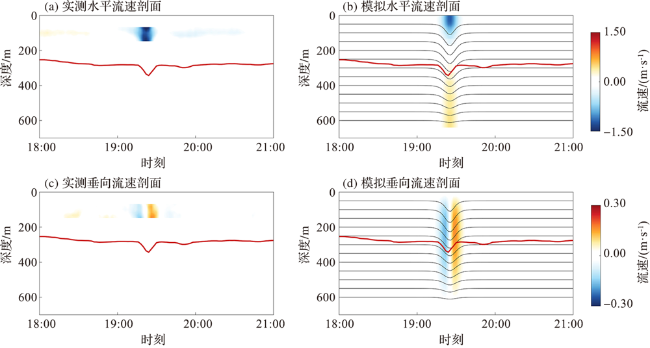
图5 潜标实测350 m以上水深水平、垂向波致流剖面(a,c)和速度-高斯函数模型输出的全水深水平、垂向波致流剖面(b,d)(红线显示了ADCP记录的260 m处的内孤立波振幅,黑线显示了速度-高斯函数模型输出的全水深振幅。) Fig.5 The horizontal and vertical wave-induced flow profile measured above 350 m by the submersible mark (a,c), horizontal and vertical wave-induced flow profile output by the Velocity-Gaussian Function Model in the entire water depth(b,d) (The red line shows the amplitude of the internal solitary wave at 260 m recorded by the ADCP, while the black line corresponds to the full-water-depth amplitude output by theVelocity-Gaussian Function Model.) |
图6 潜标实测150 m以上水深水平、垂向波致流剖面 (a,c)和速度-高斯函数模型输出的全水深水平、垂向波致流剖面 (b,d)(红线显示了ADCP记录的260 m处的内孤立波振幅,黑线显示了速度-高斯函数模型输出的全水深振幅。) Fig.6 The horizontal and the vertical wave-induced flow profile measured above 150 m by the submersible mark (a,c), horizontal and vertical wave-induced flow profile output by the Velocity-Gaussian Function Model in the entire water depth (b,d) (The red line shows the amplitude of the internal solitary wave at 260 m recorded by the ADCP, while the black line corresponds to the full-water-depth amplitude output by the Velocity-Gaussian Function Model.) |
3.2 锚碇浮标观测验证
表1 有限深度理论模型、速度-高斯函数模型计算的内孤立波非线性相速度与锚碇浮标实测值的对比Tab.1 Comparison of the nonlinear phase velocity of internal solitary waves calculated by the finite depth theoretical model and the Velocity-Gaussian Function Model and measured by the anchored buoy |
| 时间(内孤立波到达F2) | 非线性相速度/(m·s-1) | ||||
|---|---|---|---|---|---|
| 日期 | 时刻 | 根据有限深度 理论计算 | 根据速度-高斯 函数模型模拟 | 实测值 | |
| 2021-06-25 | 22:19 | 2.97 | 2.46 | 2.42 | |
| 2021-07-08 | 23:16 | 2.80 | 2.78 | 2.65 | |
| 2021-07-09 | 22:58 | 2.88 | 2.76 | 2.66 | |
| 2021-07-10 | 22:49 | 2.88 | 2.54 | 2.60 | |
| 2021-07-11 | 23:49 | 2.96 | 2.96 | 2.83 | |
| 2021-07-13 | 00:40 | 3.50 | 2.38 | 2.62 | |