
0 引言
1 材料与方法
1.1 样本的采集和固定
表1 本研究中采用的Formosa冷泉沉积物样本信息Tab.1 Information of sediment samples in Formosa cold seep used in this study |
| 样品 编号 | 沉积物描述 | 沉积物柱状 样深度/cm | 样品数 量/个 |
|---|---|---|---|
| D231-1 | 还原性沉积物外部对照 | 14 | 7 |
| D231-2 | 还原性沉积物上边缘交界 | 30 | 15 |
| D231-3 | 还原性沉积物中心1 | 20 | 10 |
| D231-4 | 还原性沉积物中心2 | 18 | 9 |
| D231-5 | 还原性沉积物中心下边缘交界 | 22 | 11 |
| D231-6 | 还原性沉积物白色菌席 | 18 | 9 |
| 合计 | 61 | ||
1.2 沉积物样品16S rRNA基因测序和分析
1.3 D231-4沉积物样品HCR-FISH流程
1.3.1 细胞分离
1.3.2 细胞提取
1.3.3 HCR-FISH流程
表2 本研究中使用的HCR-FISH探针序列Tab.2 HCR-FISH probes used in this study |
| 探针名称 | 靶向类群 | 探针序列(5’-3’) | 来源 | |
|---|---|---|---|---|
| 起始 探针 | ARCH915-H | Archaea | CCGAATACAAAGCATCAACGACTAGAAAAAAGTGCTCCCCCGCCAATTCCT | 文献[8] |
| EUB338-R | Bacteria | TACGCCCTAAGAATCCGAACCCTATGAAATAGCTGCCTCCCGTAGGAGT | 文献[16] | |
| ANME-1-350-H | ANME-1 | CCGAATACAAAGCATCAACGACTAGAAAAAAAGTTTTCGCGCCTGATGC | 文献[16] | |
| ANME-2-538-H | ANME-2 | CCGAATACAAAGCATCAACGACTAGAAAAAAGGCTACCACTCGGGCCGC | 本研究 | |
| ANME-3-1249-H | ANME-3 | CCGAATACAAAGCATCAACGACTAGAAAAAATCGGAGTAGGGACCCATT | 本研究 | |
| DSS658-R | Desulfosarcina-Desulfococcus | TACGCCCTAAGAATCCGAACCCTATGAAATATCCACTTCCCTCTCCCAT | 本研究 | |
| 扩增 探针 | H1 | CATAGGGTTCGGATTCTTAGGGCGTAGCAGCATCAATACGCCCTAAGAATCC | 文献[21] | |
| H2 | TACGCCCTAAGAATCCGAACCCTATGGGATTCTTAGGGCGTATTGATGCTGC | 文献[21] | ||
| R1 | TCTAGTCGTTGATGCTTTGTATTCGGCGACAGATAACCGAATACAAAGCATC | 文献[21] | ||
| R2 | CCGAATACAAAGCATCAACGACTAGAGATGCTTTGTATTCGGTTATCTGTCG | 文献[21] | ||
1.3.4 DAPI复染及制片观察
2 结果与分析
2.1 ANME和SRB的组成及相关性分析
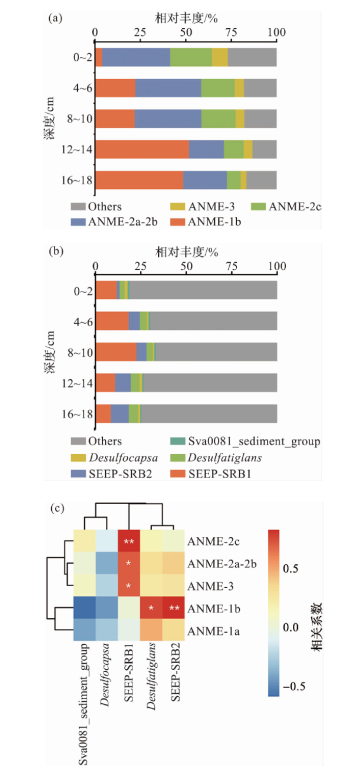
图1 Formosa冷泉沉积物样本中ANME和SRB类群的组成及相关性(图a表示D231-4站位中ANME类群随深度的变化,图中的“Others”表示除ANME以外的古菌和ASV小于1%的ANME;图b表示D231-4站位中SRB类群随深度的变化,图中的“Others”表示除SRB以外的细菌和ASV小于1%的SRB;图c表示D231站位所有层位样本中ANME和SRB类群的Pearson相关性热图,共使用61个沉积物样品,*表示p<0.05,**表示p<0.01。) Fig.1 Composition and correlation of ANME and SRB groups in the sediment samples of Formosa cold seep (Figure a illustrates the variation of ANME groups with depth in site D231-4, where “Others” in the figure represents archaea other than ANME and ANME with ASV abundances less than 1%. Figure b depicts the variation of SRB groups with depth in site D231-4, where “Others” denotes bacteria other than SRB and SRB with ASV abundances less than 1%. Figure c presents a Pearson correlation heatmap of ANME and SRB groups across all depth intervals from station D231, based on 61 sediment samples. In the heatmap, * indicates p<0.05, and ** indicates p<0.01.) |
2.2 菌团组成及形态
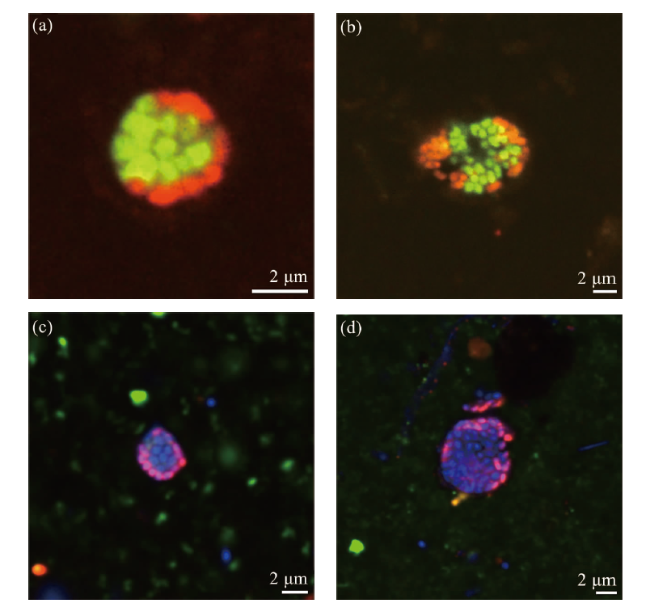
图2 Formosa冷泉样本中ANME-SRB菌团的HCR-FISH图像(图a显示了由古菌和细菌组成的菌团;图b显示了由ANME-2和SRB组成的ANME-SRB菌团;与DSS探针阳性杂交的ANME-SRB菌团中未观察到与靶向ANME-1(图c)或ANME-3(图d)的探针杂交信号。采用寡核苷酸探针DSS658-R和EUB338-R分别靶向SRB类群和细菌,标记为红色;探针ARCH915-H、ANME-1-350-H、ANME-2-538-H和ANME-3-1249-H分别靶向古菌、ANME-1、ANME-2和ANME-3,标记为绿色;DAPI复染用于细胞核染色,显示为蓝色。) Fig.2 HCR-FISH images of ANME-SRB consortia in the sediment samples of Formosa cold seep (Figure a illustrates microbial consortia composed of archaea and bacteria. Figure b displays ANME-SRB consortia consisting of ANME-2 and sulfate-reducing bacteria (SRB). No hybridization signals were observed for ANME-SRB consortia that were positively hybridized with the DSS probe when probed with ANME-1-targeting (Figure c) or ANME-3-targeting (Figure d) probes. Oligonucleotide probes DSS658-R and EUB338-R were employed to target SRB and bacteria, respectively, and were labeled red. Probes ARCH915-H, ANME-1-350-H, ANME-2-538-H, and ANME-3-1249-H were used to target archaea, ANME-1, ANME-2, and ANME-3, respectively, and were labeled green. DAPI staining was applied for nuclear staining and appeared blue.) |
表3 不同深度沉积物中观察到的ANME细胞团数量Tab.3 The ANME consortia number observed in the sediments at different depths |
| 层位 | 细胞团数量/个 | ||
|---|---|---|---|
| ANME-1 | ANME-2 | ANME-3 | |
| 0~2 cm | 0 | 86 | 0 |
| 4~6 cm | 0 | 71 | 0 |
| 8~10 cm | 0 | 73 | 0 |
| 12~14 cm | 0 | 82 | 0 |
| 16~18 cm | 0 | 78 | 0 |
| 平均 | 0 | 78 | 0 |
2.3 不同深度下菌团的大小变化及与环境因子的相关性
2.4 菌团聚集体
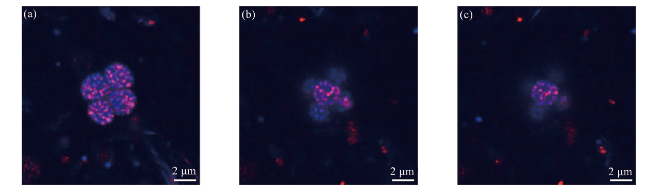
图5 菌团簇的HCR-FISH图像(菌团与靶向SRB的探针(DSS658-R)阳性杂交,显示为红色; DAPI显示为蓝色。从图a到图c是来自不同z轴的扫描结果。) Fig.5 The HCR-FISH images of the consortia cluster (The microbial consortia exhibited positive hybridization with the SRB-targeting probe (DSS658-R, red), DAPI staining appeared blue. Figures a to c represent scanning results from different z-axes.) |