Journal of Marine Sciences ›› 2025, Vol. 43 ›› Issue (1): 57-68.DOI: 10.3969/j.issn.1001-909X.2025.01.006
Previous Articles Next Articles
Evaluation of ecological restoration effect in the surrounding sea area of artificial island based on Bayesian network
HOU Zonghao( ), ZHANG Yifei*(), FANG Xin, DUAN Yixin
- Second Institute of Oceanography, MNR, Hangzhou 310012, China
-
Received:2024-02-28Revised:2024-05-28Online:2025-03-15Published:2025-05-30 -
Contact:ZHANG Yifei
CLC Number:
Cite this article
HOU Zonghao, ZHANG Yifei, FANG Xin, DUAN Yixin. Evaluation of ecological restoration effect in the surrounding sea area of artificial island based on Bayesian network[J]. Journal of Marine Sciences, 2025, 43(1): 57-68.
share this article
Add to citation manager EndNote|Ris|BibTeX
URL: http://hyxyj.sio.org.cn/EN/10.3969/j.issn.1001-909X.2025.01.006
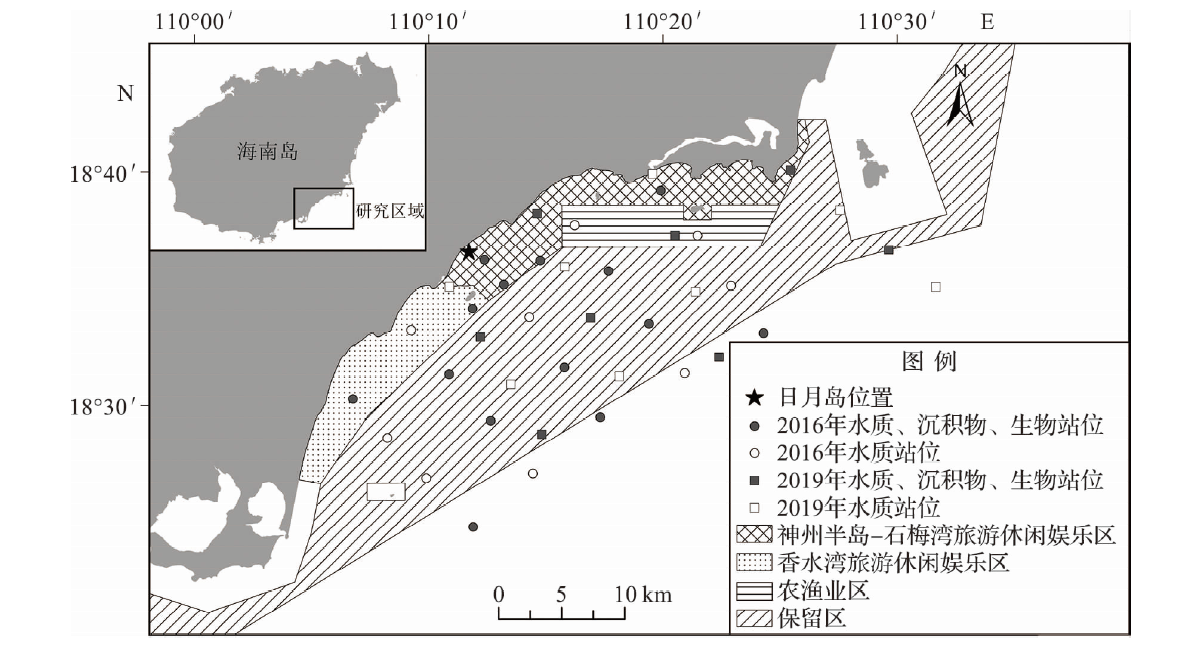
Fig.1 Marine functional zoning and survey stations location of the study area
| 目标层 | 准则层 | 要素层 | 指标层 | 正负性 |
|---|---|---|---|---|
| 海域生态环境质量A | 压力P | 水环境压力B1 | COD/(mg·L-1) P1 | - |
| PO4-P/(mg·L-1) P2 | - | |||
| 无机氮/(mg·L-1) P3 | - | |||
| DO/(mg·L-1) P4 | + | |||
| 石油类/(mg·L-1) P5 | - | |||
| 沉积物环境压力B2 | 硫化物/(×10-6) P6 | - | ||
| 铜/(×10-6) P7 | - | |||
| 锌/(×10-6) P8 | - | |||
| 总汞/(×10-6) P9 | - | |||
| 镉/(×10-6) P10 | - | |||
| 状态S | 生物状况B3 | 浮游动物丰度/(ind·m-3) S1 | + | |
| 浮游植物细胞丰度/(×104个·m-3) S2 | + | |||
| 仔稚鱼密度/(尾·m-3) S3 | + | |||
| 底栖生物栖息密度/(ind·m-2) S4 | + | |||
| 响应R | 生物响应B4 | 浮游动物多样性指数 R1 | + | |
| 浮游植物多样性指数 R2 | + | |||
| 底栖生物多样性指数 R3 | + | |||
| 初级生产力/(mg·m-2·d-1) R4 | + |
Tab.1 Evaluation index system of ecological restoration effect in the sea area around Riyue Island
| 目标层 | 准则层 | 要素层 | 指标层 | 正负性 |
|---|---|---|---|---|
| 海域生态环境质量A | 压力P | 水环境压力B1 | COD/(mg·L-1) P1 | - |
| PO4-P/(mg·L-1) P2 | - | |||
| 无机氮/(mg·L-1) P3 | - | |||
| DO/(mg·L-1) P4 | + | |||
| 石油类/(mg·L-1) P5 | - | |||
| 沉积物环境压力B2 | 硫化物/(×10-6) P6 | - | ||
| 铜/(×10-6) P7 | - | |||
| 锌/(×10-6) P8 | - | |||
| 总汞/(×10-6) P9 | - | |||
| 镉/(×10-6) P10 | - | |||
| 状态S | 生物状况B3 | 浮游动物丰度/(ind·m-3) S1 | + | |
| 浮游植物细胞丰度/(×104个·m-3) S2 | + | |||
| 仔稚鱼密度/(尾·m-3) S3 | + | |||
| 底栖生物栖息密度/(ind·m-2) S4 | + | |||
| 响应R | 生物响应B4 | 浮游动物多样性指数 R1 | + | |
| 浮游植物多样性指数 R2 | + | |||
| 底栖生物多样性指数 R3 | + | |||
| 初级生产力/(mg·m-2·d-1) R4 | + |
| 要素层 | 指标 | 2016年4月 | 2019年5月 | 要素层 | 指标 | 2016年4月 | 2019年5月 | ||||||
|---|---|---|---|---|---|---|---|---|---|---|---|---|---|
| 平均值 | 方差 | 平均值 | 方差 | 平均值 | 方差 | 平均值 | 方差 | ||||||
| B1 | P1 | 0.243 4 | 0.009 8 | 0.859 8 | 0.000 6 | B3 | S1 | 0.356 3 | 0.014 5 | 0.014 3 | 0.000 0 | ||
| P2 | 0.287 7 | 0.006 9 | 0.752 2 | 0.009 6 | S2 | 0.430 2 | 0.022 0 | 0.377 7 | 0.067 6 | ||||
| P3 | 0.578 4 | 0.014 1 | 0.900 5 | 0.002 2 | S3 | 0.272 1 | 0.018 8 | 0.293 1 | 0.073 5 | ||||
| P4 | 0.488 1 | 0.013 4 | 0.648 8 | 0.003 8 | S4 | 0.429 5 | 0.011 9 | 0.386 6 | 0.011 9 | ||||
| P5 | 0.521 2 | 0.008 9 | 0.861 0 | 0.002 0 | B4 | R1 | 0.365 9 | 0.013 6 | 0.905 3 | 0.000 5 | |||
| B2 | P6 | 0.440 8 | 0.021 4 | 0.810 3 | 0.007 5 | R2 | 0.759 9 | 0.003 4 | 0.462 1 | 0.040 3 | |||
| P7 | 0.403 6 | 0.013 7 | 0.451 9 | 0.056 1 | R3 | 0.689 0 | 0.011 3 | 0.213 9 | 0.016 0 | ||||
| P8 | 0.298 2 | 0.007 9 | 0.646 6 | 0.022 0 | R4 | 0.166 4 | 0.001 0 | 0.575 2 | 0.013 4 | ||||
| P9 | 0.694 8 | 0.008 0 | 0.628 8 | 0.001 2 | |||||||||
| P10 | 0.446 4 | 0.002 5 | 0.619 6 | 0.008 0 | |||||||||
Tab.2 The average and variance of each index after normalization
| 要素层 | 指标 | 2016年4月 | 2019年5月 | 要素层 | 指标 | 2016年4月 | 2019年5月 | ||||||
|---|---|---|---|---|---|---|---|---|---|---|---|---|---|
| 平均值 | 方差 | 平均值 | 方差 | 平均值 | 方差 | 平均值 | 方差 | ||||||
| B1 | P1 | 0.243 4 | 0.009 8 | 0.859 8 | 0.000 6 | B3 | S1 | 0.356 3 | 0.014 5 | 0.014 3 | 0.000 0 | ||
| P2 | 0.287 7 | 0.006 9 | 0.752 2 | 0.009 6 | S2 | 0.430 2 | 0.022 0 | 0.377 7 | 0.067 6 | ||||
| P3 | 0.578 4 | 0.014 1 | 0.900 5 | 0.002 2 | S3 | 0.272 1 | 0.018 8 | 0.293 1 | 0.073 5 | ||||
| P4 | 0.488 1 | 0.013 4 | 0.648 8 | 0.003 8 | S4 | 0.429 5 | 0.011 9 | 0.386 6 | 0.011 9 | ||||
| P5 | 0.521 2 | 0.008 9 | 0.861 0 | 0.002 0 | B4 | R1 | 0.365 9 | 0.013 6 | 0.905 3 | 0.000 5 | |||
| B2 | P6 | 0.440 8 | 0.021 4 | 0.810 3 | 0.007 5 | R2 | 0.759 9 | 0.003 4 | 0.462 1 | 0.040 3 | |||
| P7 | 0.403 6 | 0.013 7 | 0.451 9 | 0.056 1 | R3 | 0.689 0 | 0.011 3 | 0.213 9 | 0.016 0 | ||||
| P8 | 0.298 2 | 0.007 9 | 0.646 6 | 0.022 0 | R4 | 0.166 4 | 0.001 0 | 0.575 2 | 0.013 4 | ||||
| P9 | 0.694 8 | 0.008 0 | 0.628 8 | 0.001 2 | |||||||||
| P10 | 0.446 4 | 0.002 5 | 0.619 6 | 0.008 0 | |||||||||
| 要素层 | 指标层 | 权重 | 要素层 | 指标层 | 权重 |
|---|---|---|---|---|---|
| B1 | P1 | 0.254 8 | B3 | S1 | 0.178 8 |
| P2 | 0.192 6 | S2 | 0.218 8 | ||
| P3 | 0.192 6 | S3 | 0.242 8 | ||
| P4 | 0.278 9 | S4 | 0.359 7 | ||
| P5 | 0.081 2 | B4 | R1 | 0.175 2 | |
| B2 | P6 | 0.315 1 | R2 | 0.267 9 | |
| P7 | 0.232 8 | R3 | 0.296 4 | ||
| P8 | 0.163 8 | R4 | 0.260 5 | ||
| P9 | 0.157 7 | ||||
| P10 | 0.130 6 | ||||
Tab.3 Weights of the indexes in each element layer
| 要素层 | 指标层 | 权重 | 要素层 | 指标层 | 权重 |
|---|---|---|---|---|---|
| B1 | P1 | 0.254 8 | B3 | S1 | 0.178 8 |
| P2 | 0.192 6 | S2 | 0.218 8 | ||
| P3 | 0.192 6 | S3 | 0.242 8 | ||
| P4 | 0.278 9 | S4 | 0.359 7 | ||
| P5 | 0.081 2 | B4 | R1 | 0.175 2 | |
| B2 | P6 | 0.315 1 | R2 | 0.267 9 | |
| P7 | 0.232 8 | R3 | 0.296 4 | ||
| P8 | 0.163 8 | R4 | 0.260 5 | ||
| P9 | 0.157 7 | ||||
| P10 | 0.130 6 | ||||
| 功能区 | 要素层 | 权重 |
|---|---|---|
| 旅游休闲娱乐区 | B1 | 0.302 4 |
| B2 | 0.215 7 | |
| B3 | 0.240 9 | |
| B4 | 0.240 9 | |
| 农渔业区 | B1 | 0.154 2 |
| B2 | 0.185 8 | |
| B3 | 0.330 0 | |
| B4 | 0.330 0 | |
| 保留区 | B1 | 0.255 6 |
| B2 | 0.259 6 | |
| B3 | 0.259 1 | |
| B4 | 0.225 7 |
Tab.4 Weights of the elements in each functional zone
| 功能区 | 要素层 | 权重 |
|---|---|---|
| 旅游休闲娱乐区 | B1 | 0.302 4 |
| B2 | 0.215 7 | |
| B3 | 0.240 9 | |
| B4 | 0.240 9 | |
| 农渔业区 | B1 | 0.154 2 |
| B2 | 0.185 8 | |
| B3 | 0.330 0 | |
| B4 | 0.330 0 | |
| 保留区 | B1 | 0.255 6 |
| B2 | 0.259 6 | |
| B3 | 0.259 1 | |
| B4 | 0.225 7 |
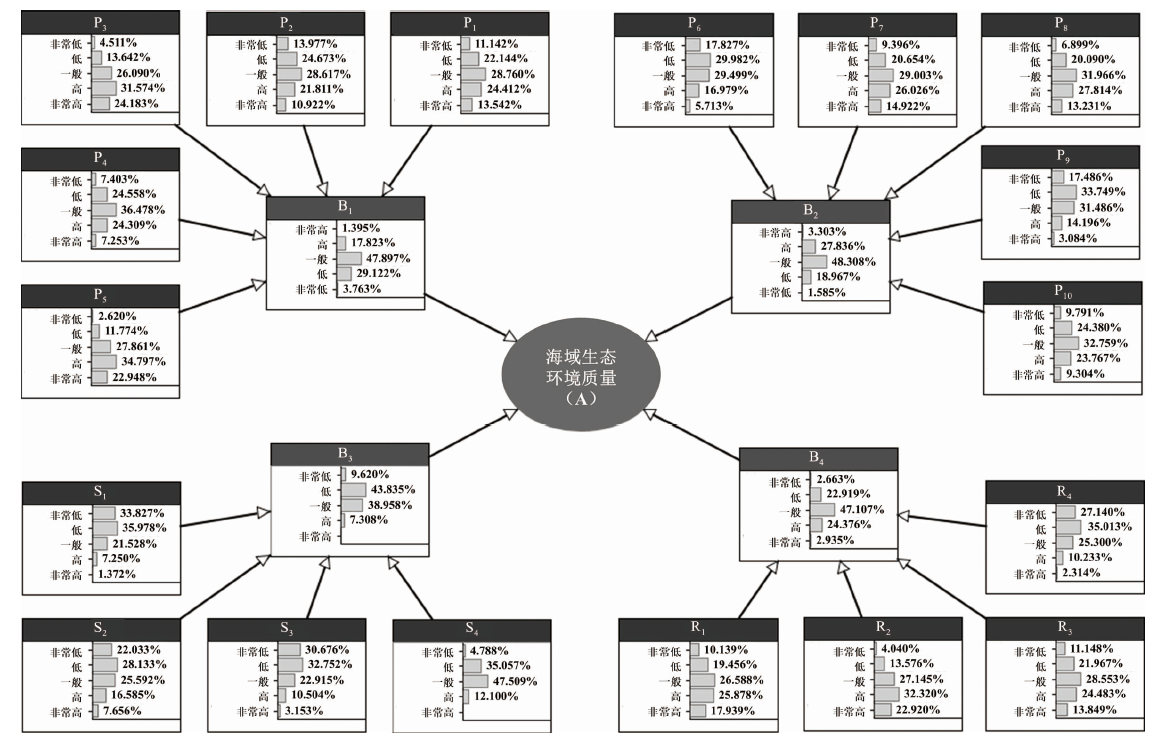
Fig.2 Bayesian network model for evaluation of ecological restoration effect in the sea area around Riyue Island
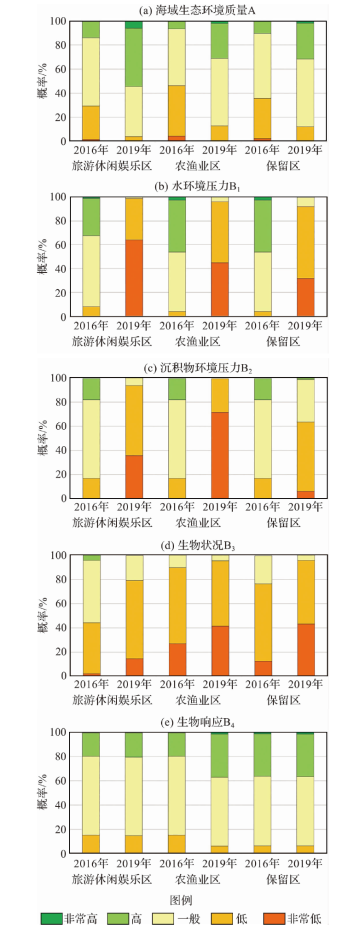
Fig.3 Evaluation results of ecological restoration effects in the sea area around Riyue Island
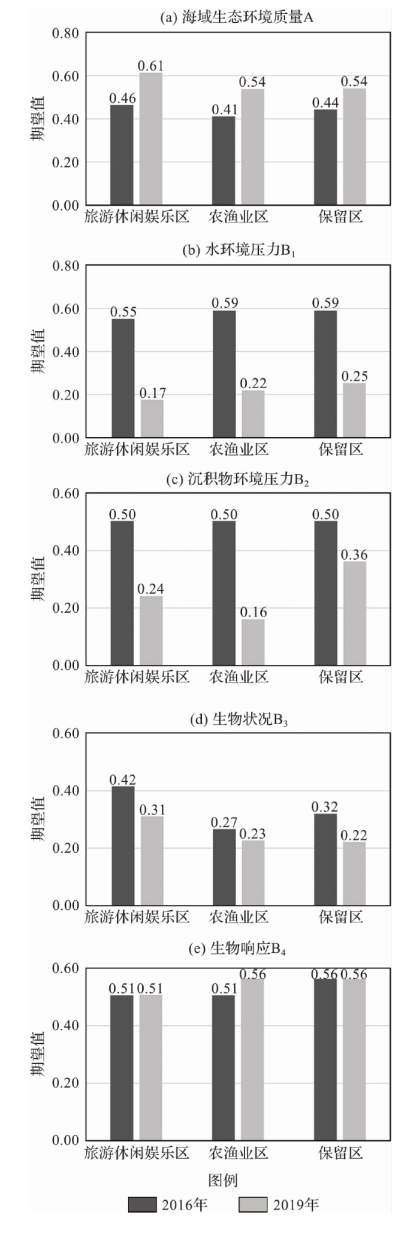
Fig.4 The expectation of the probability distribution at the target layer and the element layers in each marine functional zone
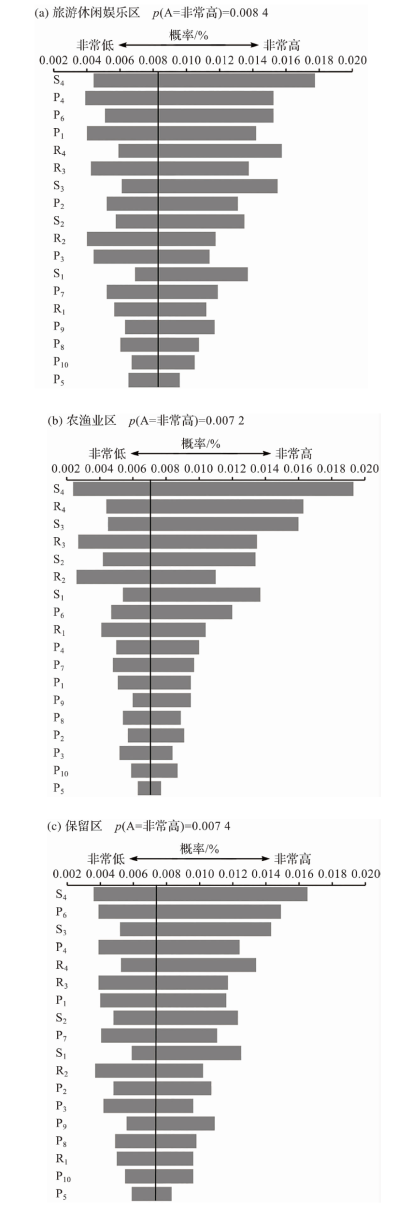
Fig.5 Results of sensitivity analysis of ecological restoration effect evaluation indexes in the sea area around Riyue Island [p(A=very high) represents the marginal probability of the ecological environment quality being at a very high level, indicated by the black vertical line in the figure. The horizontal bars show the range of probability fluctuations.]
| [1] | 肖哲宇, 戚洪帅, 蔡锋, 等. 人工岛建设对海口湾沉积特征与泥沙运移的影响[J]. 海洋学报, 2022, 44(3):137-146. |
| XIAO Z Y, QI H S, CAI F, et al. The impact of artificial island construction on sedimentary characteristics and sediment transport in the Haikou Bay[J]. Haiyang Xuebao, 2022, 44(3): 137-146. | |
| [2] | AFZAL M S, TAHIR F, AL-GHAMDI S G. Recommendations and strategies to mitigate environmental implications of artificial island developments in the gulf[J]. Sustainability, 2022, 14(9): 5027. |
| [3] | CHEE S Y, OTHMAN A G, SIM Y K, et al. Land reclamation and artificial islands: Walking the tightrope between development and conservation[J]. Global Ecology and Conservation, 2017, 12: 80-95. |
| [4] |
MARTIN D M. Ecological restoration should be redefined for the twenty-first century[J]. Restoration Ecology, 2017, 25(5): 668-673.
DOI PMID |
| [5] | WANG J W, LIU Y P, LIU M Y, et al. Multi-phase environmental impact assessment of marine ecological restoration project based on DPSIR-cloud model[J]. International Journal of Environmental Research and Public Health, 2022, 19(20): 13295. |
| [6] | BASCONI L, CADIER C, GUERRERO L G. Challenges in marine restoration ecology: How techniques, assessment metrics, and ecosystem valuation can lead to improved restoration success[M]//YOUMARES 9—The oceans: Our research, our future. Cham: Springer International Publishing, 2019: 83-99. |
| [7] | 符小明, 唐建业, 吴卫强, 等. 海州湾生态修复效果评价[J]. 大连海洋大学学报, 2017, 32(1):93-98. |
| FU X M, TANG J Y, WU W Q, et al. Evaluation of ecological restoration performance in Haizhou Bay, Lianyungang[J]. Journal of Dalian Ocean University, 2017, 32(1): 93-98. | |
| [8] | 杨金艳, 罗福生, 王爱军, 等. 淤积型海湾整治修复效果综合评价:以厦门湾为例[J]. 应用海洋学学报, 2020, 39(3):389-399. |
| YANG J Y, LUO F S, WANG A J, et al. Comprehensive evaluation for silted bay restoration: A case study in Xiamen Bay[J]. Journal of Applied Oceanography, 2020, 39(3): 389-399. | |
| [9] | 张秋丰, 白洁, 马玉艳, 等. 天津海岸带生态修复效果评估方法研究[J]. 海洋环境科学, 2019, 38(5):782-789,795. |
| ZHANG Q F, BAI J, MA Y Y, et al. Research on the method for evaluating ecological restoration effect in the coastal zone of Tianjin[J]. Marine Environmental Science, 2019, 38(5): 782-789, 795. | |
| [10] | 于小芹, 马云瑞, 余静. 基于熵权TOPSIS模型的山东省海岸带生态修复政策效果评价研究[J]. 海洋环境科学, 2022, 41(1):74-79. |
| YU X Q, MA Y R, YU J. Evaluation of coastal ecological restoration policy effect based on entropy-weight TOPSIS Model in Shandong province[J]. Marine Environmental Science, 2022, 41(1): 74-79. | |
| [11] | 吴逸凡, 张亦飞, 方欣, 等. 基于Choquet模糊积分的人工鱼礁生态修复效果综合评价[J]. 海洋环境科学, 2022, 41(3):467-473. |
| WU Y F, ZHANG Y F, FANG X, et al. Ecological restoration effect evaluation of artificial reefs with Choquet integral algorithom[J]. Marine Environmental Science, 2022, 41(3): 467-473. | |
| [12] | ANDRICEVIC R. Ecological quality assessment under uncertainty for transitional and coastal waters: Central Eastern Adriatic Sea study[J]. Ecological Indicators, 2022, 138: 108850. |
| [13] | XU L F, LIU D D. Evaluation of the effect and investment benefit of marine ecosystem protection and restoration[J]. Frontiers in Ecology and Evolution, 2022, 10: 991198. |
| [14] | NIEMEIJER D, DE GROOT R S. A conceptual framework for selecting environmental indicator sets[J]. Ecological Indicators, 2008, 8(1): 14-25. |
| [15] | 朱明敏. 贝叶斯网络结构学习与推理研究[D]. 西安: 西安电子科技大学, 2013. |
| ZHU M M. Research on Bayesian network structure learning and reasoning[D]. Xi’an: Xidian University, 2013. | |
| [16] | MARCOT B G, PENMAN T D. Advances in Bayesian network modelling: Integration of modelling technologies[J]. Environmental Modelling & Software, 2019, 111: 386-393. |
| [17] |
HUGHEY K F D, CULLEN R, KERR G N, et al. Application of the pressure-state-response framework to perceptions reporting of the state of the New Zealand environment[J]. Journal of Environmental Management, 2004, 70(1): 85-93.
PMID |
| [18] |
WOLFSLEHNER B, VACIK H. Evaluating sustainable forest management strategies with the analytic network process in a pressure-state-response framework[J]. Journal of Environmental Management, 2008, 88(1): 1-10.
PMID |
| [19] | 何彦龙, 袁一鸣, 王腾, 等. 基于GIS的长江口海域生态系统脆弱性综合评价[J]. 生态学报, 2019, 39(11):3918-3925. |
| HE Y L, YUAN Y M, WANG T, et al. Integrated assessment of marine ecological vulnerability in the Yangtze River Estuary using GIS[J]. Acta Ecologica Sinica, 2019, 39(11): 3918-3925. | |
| [20] | FENTON N, NEIL M. Risk assessment and decision analysis with Bayesian networks[M]. Florida: CRC Press, 2018: 113-265. |
| [21] | REZAEI J. Best-worst multi-criteria decision-making method[J]. Omega, 2015, 53:49-57. |
| [22] | LIU P D, ZHU B Y, WANG P. A weighting model based on best-worst method and its application for environmental performance evaluation[J]. Applied Soft Computing, 2021, 103: 107168. |
| [23] | SAFARZADEH S, KHANSEFID S, RASTI B M. A group multi-criteria decision-making based on best-worst method[J]. Computers & Industrial Engineering, 2018, 126: 111-121. |
| [24] | LIANG F Q, BRUNELLI M, REZAEI J. Consistency issues in the best worst method: Measurements and thresholds[J]. Omega, 2020, 96: 102175. |
| [25] | GUO K, ZHANG X C, KUAI X, et al. A spatial Bayesian-network approach as a decision-making tool for ecological-risk prevention in land ecosystems[J]. Ecological Modelling, 2020, 419: 108929. |
| [26] | KAIKKONEN L, PARVIAINEN T, RAHIKAINEN M, et al. Bayesian networks in environmental risk assessment: A review[J]. Integrated Environmental Assessment and Management, 2021, 17(1): 62-78. |
| [27] | 杨湘艳, 余静. 基于贝叶斯网络的海洋生态环境状况评价:以山东省为例[J]. 海洋通报, 2021, 40(4):473-480. |
| YANG X Y, YU J. Assessment of marine ecological environment based on Bayesian networks: A case study of Shandong Province[J]. Marine Science Bulletin, 2021, 40(4): 473-480. | |
| [28] | 宫秀军. 贝叶斯学习理论及其应用研究[D]. 北京: 中国科学院研究生院(计算技术研究所), 2002. |
| GONG X J. Research on Bayesian learning theory and its application[D]. Beijing: Institute of Computing Technology, Chinese Academy of Sciences, 2002. | |
| [29] | FENTON N, NEIL M. Ranked nodes: A simple and effective way to model qualitative judgements in large-scale Bayesian Networks[M]. London: University of London, 2005. |
| [30] | 蔡毅, 邢岩, 胡丹. 敏感性分析综述[J]. 北京师范大学学报:自然科学版, 2008, 44(1):9-16. |
| CAI Y, XING Y, HU D. On sensitivity analysis[J]. Journal of Beijing Normal University: Natural Science, 2008, 44(1): 9-16. | |
| [31] | 张晗旭, 李馨宇, 崔保山, 等. 黄河三角洲湿地生态修复工程对底栖动物的影响效果研究[J]. 环境工程, 2023, 41(1):222-231. |
| ZHANG H X, LI X Y, CUI B S, et al. Effect of wetland ecological restoration project on macrobenthos community in the Yellow River Delta[J]. Environmental Engineering, 2023, 41(1): 222-231. | |
| [32] | 粟丽, 许友伟, 张魁, 等. 南海区拖网渔业发展趋势及其对渔业资源的影响[J]. 南方水产科学, 2023, 19(4):41-48. |
| SU L, XU Y W, ZHANG K, et al. Development trend of trawl fishery and its impact on fishery resources in South China Sea[J]. South China Fisheries Science, 2023, 19(4): 41-48. | |
| [33] |
ZHANG J H, GAO Y, SHI X J, et al. Species composition and diversity of marine organisms from benthic trawling in Daya Bay of the northern South China Sea[J]. Biodiversity Science, 2017, 25(9): 1019-1030.
DOI |
| [34] | NIE W, FENG D, LOHPAISANKRIT W, et al. A dynamic Bayesian network-based model for evaluating rainfall-induced landslides[J]. Bulletin of Engineering Geology and the Environment, 2019, 78(3): 2069-2080. |
| No related articles found! |
| Viewed | ||||||
|
Full text |
|
|||||
|
Abstract |
|
|||||