
0 引言
入海河流是连接陆地和海洋的重要桥梁,人类活动产生的工业废水、生活污水会通过河流输运进入近岸海域。作为水质监测和评估中使用最广泛的参数之一,化学需氧量(Chemical Oxygen Demand, COD)是指水中还原性物质在强氧化剂作用下发生氧化还原反应时消耗氧的量。目前,在水质监测、控制水污染和管理地表水等实际应用中,最常用的指标为高锰酸盐指数(Permanganate Index, CODMn)[1],该指标可表征水体中有机污染程度,常用于自然水体或洁净水体的测定,可有效测量水中可被氧化的还原性物质(有机物)总量。因此,CODMn可间接表征入海河流的有机碳含量,进而有助于估算河流入海有机碳的输运通量[2⇓-4]。
相较于传统的基于水化学原理的现场监测方法,遥感技术具有可大范围同步观测、历史可回溯等突出优势。通过卫星遥感影像,结合实测数据,可进一步构建水质反演模型,实现入海河流水质的大范围连续动态监测。自20世纪70年代以来,遥感技术已广泛应用于河流、湖泊水质参数的反演、监测和长时序分析[5]。例如,解启蒙 等[6]通过分析遥感反射率和实测数据之间的相关性,基于Landsat-8卫星数据,建立了具有较高精度的清河水库CODMn遥感反演模型,为水库水质监测提供了可靠数据支撑;王丽艳 等[7]基于实测数据和MODIS遥感数据,估算并分析了呼伦湖COD的时空变化特征,为呼伦湖水环境质量管理提供了科学依据;王歆晖 等[8]利用哨兵2号遥感数据,结合实测数据,构建了基于综合水质指标(包含CODMn等参数)的水质遥感反演模型,为河流水质监管提供了依据;吴铭 等[9]利用1999—2018年的Landsat系列遥感影像数据和实测数据,建立了北极Lena河的水质反演模型,并分析了河流水质长期演变过程。但目前国内外关于污染物遥感反演的研究主要面向内陆湖泊或大型河流等,针对中小河流入海污染物的遥感评估研究相对较少[10]。
本研究以瓯江为例,基于Landsat系列卫星遥感数据,结合实测水质数据,构建了瓯江中下游河段CODMn遥感反演模型,分析了瓯江中下游河段CODMn的时空变化特征。在此基础上,进一步结合流域降水数据估算分析了1986—2020年瓯江CODMn入海通量的长期演变特征。
1 数据与方法
1.1 研究区域概况
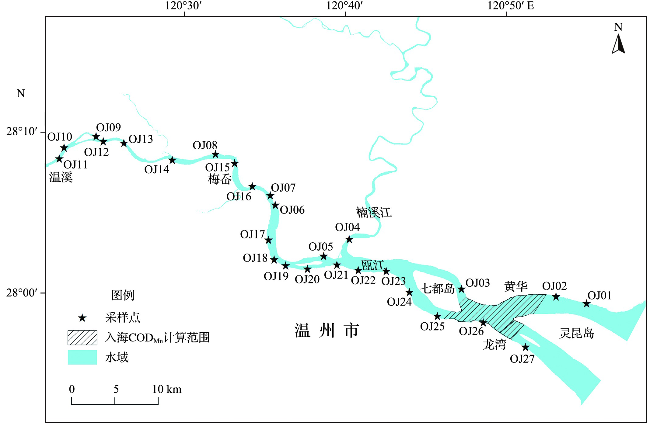
瓯江位于浙江省南部,为浙江省第二大河流,从温州湾入海。其干流全长388 km,流域面积18 165 km2,平均年降水量为1 745.8 mm,年径流量为202.7亿m3。瓯江为典型的山溪性河流,径流年内分配具有明显的季节性,年内径流主要由4—9月的汛期贡献(占全年径流量的78%以上),最大径流量主要出现在6月。按照径流量大小将4—9月划为湿季,其余月份为干季①(① 温州市水利电力勘测设计院.温州市第三次水资源调查评价报告.2019.)。瓯江多年平均流量为446 m3/s,径流携带上游各县市乡镇生活污水和工农业废水进入河口海域[11]。
1.2 实验数据
1.2.1 实测数据
为分析同一点位CODMn在干、湿季节的差异,选取两次采样均覆盖到的站点进行对比(表1),结果表明,研究区域同一采样点的CODMn在干、湿季差异并不显著,但总体上来说,湿季的CODMn略大于干季。
表1 瓯江中下游河段现场调查CODMn结果Tab.1 CODMn results of field survey in the middle and lower reaches of Oujiang River |
| 站点名称 | CODMn/(mg·L-1) | |
|---|---|---|
| 9月湿季航次 | 12月干季航次 | |
| OJ10 | 1.26 | 1.10 |
| OJ09 | 1.37 | 0.80 |
| OJ13 | 0.98 | 1.10 |
| OJ14 | 1.63 | 1.10 |
| OJ08 | 1.89 | 1.00 |
| OJ15 | 1.69 | 1.00 |
| OJ16 | 2.01 | 1.40 |
| OJ17 | 2.28 | 1.10 |
| OJ19 | 2.20 | 1.30 |
| OJ20 | 3.12 | 3.10 |
| OJ03 | 5.47 | 5.20 |
| 最大值 | 6.67 | 6.20 |
| 最小值 | 0.98 | 0.80 |
| 平均值 | 2.84 | 2.21 |
| 标准差 | 1.60 | 1.87 |
1.2.2 遥感数据
本研究选择美国地质调查局公布的陆地卫星(Landsat)高空间分辨率(30 m)多光谱遥感数据进行分析,遥感数据从美国地质调查局网站(https://earthexplorer.usgs.gov/)下载获取。本研究拟选择1986—2020年瓯江河道上无云覆盖或云量小于30%的Landsat影像数据,有243幅Landsat Level-1级遥感数据符合上述条件(表2)。其中,数据选择时确保每年干、湿季至少有1幅遥感影像可用,影像基本覆盖了各个月份、季节、年份,具有一定的代表性,以满足分析不同水文条件下CODMn时空动态分布状况的需要。
表2 研究使用的遥感影像数据Tab.2 Remote sensing data used in the study |
| 卫星名称 | 遥感器 | 时间跨度 | 图幅数量/幅 |
|---|---|---|---|
| Landsat-5 | TM | 1986-01-07—2011-10-27 | 134 |
| Landsat-7 | ETM+ | 1999-10-02—2003-01-14 | 21 |
| Landsat-7 | ETM+(修复条带后) | 2003-07-25—2021-01-15 | 42 |
| Landsat-8 | OLI | 2013-04-23—2021-12-09 | 46 |
本研究中,建模时使用2021年9月4日和2021年12月9日的Landsat-8卫星影像,用于匹配现场实测的CODMn数据。
本研究使用ENVI 5.3软件对Landsat系列遥感数据进行预处理,主要包括辐射定标和大气校正。其中,辐射定标通过Radiometric Calibration工具实现,将辐亮度值输出为BIL格式;大气校正通过FLAASH大气校正算法实现,并根据干、湿季节选择不同的气溶胶模型。基于获得的遥感反射率数据,进一步提取采样点的遥感反射率信息,提取时以采样点所在像元为中心,选择该中心像元周围3×3窗口范围内反射率值最低的像元作为该采样点对应的遥感反射率信息进行取样,以降低混合像元影响。
1.2.3 降水数据
本研究使用的水文数据来源于PENG et al[16]提供的基于CRU(Climatic Research Unit)气候数据集和World Clim气候数据集生成的中国地区月均降水数据。经过区域筛选和计算处理,获得瓯江流域月尺度降水量信息,并在此基础上计算得到瓯江流域年均降水量。
1.3 遥感模型的构建
1.3.1 相关性分析
对采样点临近像元各波段的反射率与实测CODMn数据进行敏感性分析。使用SPSS 25软件分析拟合单波段、多波段组合与CODMn之间的相关性,寻找皮尔逊相关系数较高的波段组合,以便后续得到拟合度更高的回归曲线和反演模型。
1.3.2 反演模型
以相关性较高的波段组合作为自变量,CODMn实测值作为因变量,建立回归方程,得到瓯江中下游河段CODMn的遥感反演模型。
经过相关性分析并对比决定系数(R2),最终筛选得到如表3所示的3种R2较高的波段组合形式和遥感反演模型(上述模型均已通过显著性检验)。
表3 部分波段组合、模型形式及模型决定系数Tab.3 Partial band combination results and R2 of the models |
| 波段组合 | 模型形式 | R2 | p | n |
|---|---|---|---|---|
| ln(Blue+NIR)/ln(Red) | Y=816.827-1 484.774X+675.798X2 | 0.523 | <0.001 | 42 |
| ln(Green×NIR)/ln(Red+NIR) | Y=3 368.372-2 742.496X+269.527X3 | 0.577 | <0.001 | 42 |
| ln(Blue×NIR)/ln(Red+NIR) | Y=1 706.314-1 400.998X+140.141X3 | 0.611 | <0.001 | 42 |
比较了各模型在瓯江中下游河段的CODMn反演误差,最终确定使用ln(Blue+NIR)/ln(Red)的波段组合形式构建遥感反演模型:
Y=816.827-1 484.774X+675.798X2
基于上述遥感反演模型,结合遥感数据和水体光谱信息,可进一步反演瓯江中下游河段CODMn,从而获取CODMn时空变化特征。
1.3.3 反演模型验证
通过温州环境监测站(七都岛,2017年)和中国环境监测总站(龙湾,2018—2021年)提供的CODMn实测数据对模型进行精度验证。
基于前文构建的定量遥感反演模型,获得各个站点的CODMn反演值,并与实测值进行对比分析。验证结果表明,反演模型的平均绝对误差为0.63 mg/L,平均相对误差为28%,在可接受范围内。
1.4 CODMn入海通量计算方法
利用下式进行CODMn入海通量估算:
T=C×Q
式中:T为入海通量,C为河流入海处CODMn(即图1中“X”型区域的反演值均值),Q为河流入海径流量。
Qi=0.061 6×P-22.87
Q=Qi×S
式中:Qi为地表年径流量,P为年降水量,Q为河流入海径流量,S为流域面积。
受降水量年际差异的影响,若仅从CODMn入海通量变化角度分析瓯江入海水质演变会存在一定误差。因此,本研究引入“比值”的概念:将瓯江1986—2020年各年的CODMn入海通量与入海径流量之比作为当年瓯江入海水体水质状况优劣的参考依据,以探讨瓯江流域水质状况的年际变化。该概念可以理解为“单位入海水体中所含CODMn”,即消除径流量年际差异后的瓯江入海水体CODMn变化情况。
2 结果与分析
2.1 瓯江CODMn空间分布特征
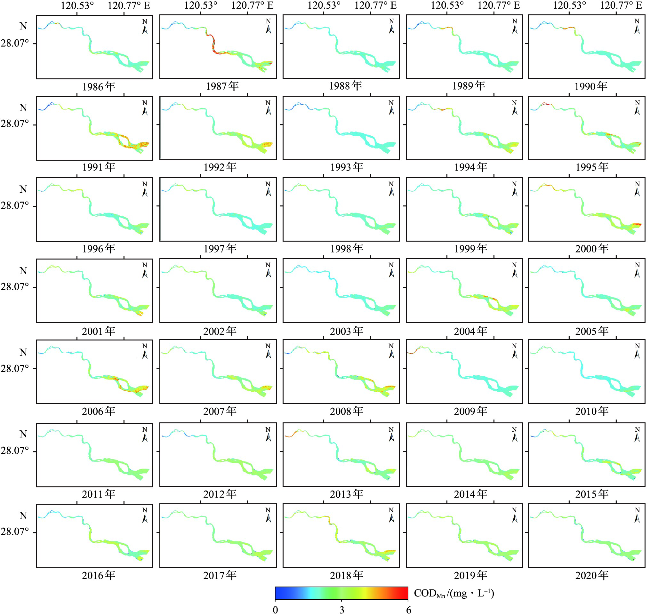
图3 瓯江中下游河段CODMn空间分布(1986—2020年干季)Fig.3 Spatial distribution of CODMn in the middle and lower reaches of Oujiang River (dry season 1986-2020) |
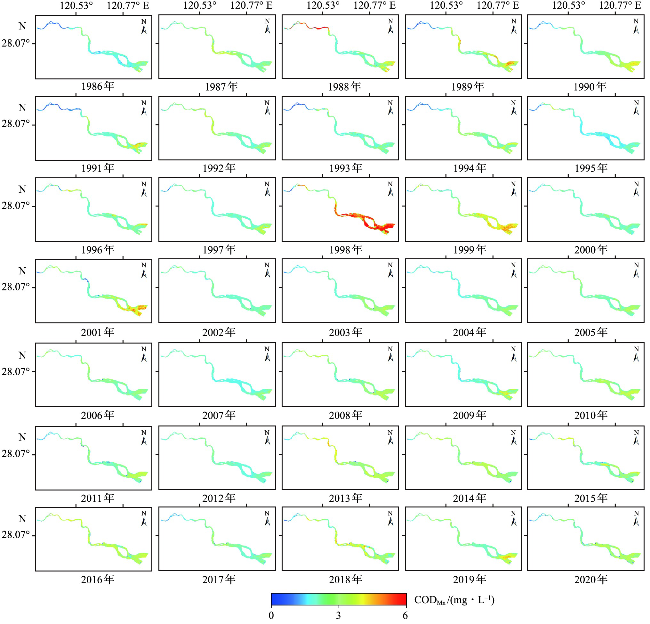
图4 瓯江中下游河段CODMn空间分布(1986—2020年湿季)Fig.4 Spatial distribution of CODMn in the middle and lower reaches of Oujiang River (wet season 1986-2020) |
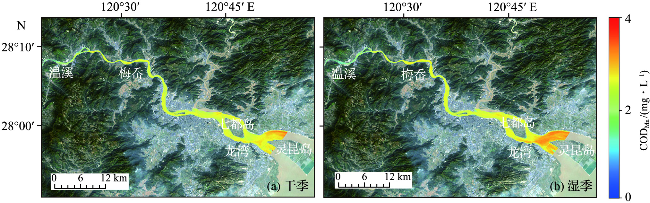
从瓯江中下游河段CODMn多年平均空间分布(图5)可见,瓯江中下游河段CODMn的多年平均值在干、湿季的差异并不显著,并呈现出高度的一致性。温溪—梅岙段森林植被覆盖程度较高,人类活动干扰程度低,因此温溪—梅岙段整体水质状况良好,水体清澈,CODMn总体约为1 mg/L;随着河道途经的乡村、城市数量增加,人类活动产生的生活污水、废水排入瓯江,水体中的CODMn逐渐升高,至灵昆岛附近区域,CODMn已增至约3 mg/L;但由于海水的稀释作用,CODMn在入海口附近略有下降。
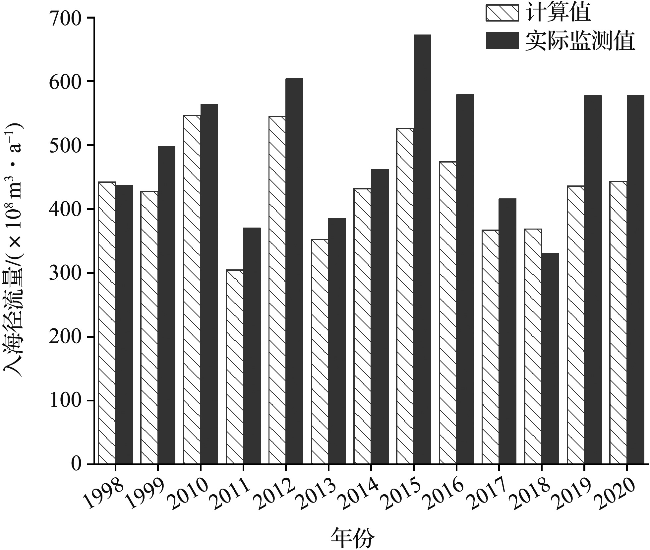
2.2 瓯江CODMn入海通量估算
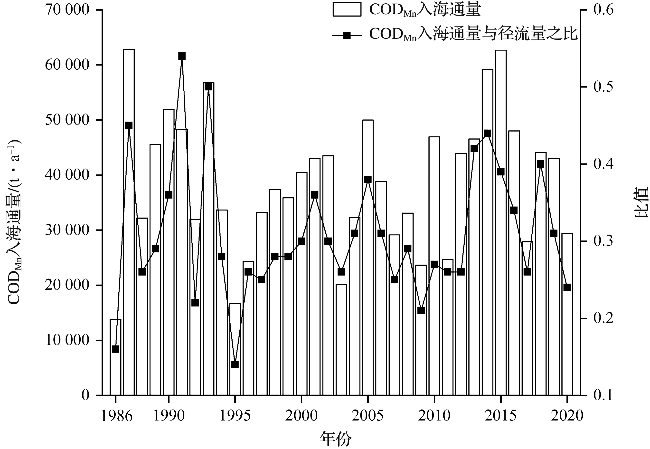
根据公式(2)、(4)估算瓯江CODMn年入海通量,结果见图6。
结果显示,1986—2020年瓯江CODMn入海通量年际变化较大,整体呈现波动变化趋势。CODMn入海通量与径流量比值的变化趋势总体与CODMn入海通量变化趋势一致。1986—1995年,瓯江入海水体CODMn变化波动较大;1996—2011年,CODMn开始趋于稳定,CODMn的年际差异趋于平缓;2012年之后,CODMn又开始趋于波动变化。但总体来说,瓯江水质在1986—2020年之间的变化并不显著,并有稳中向好的变化趋势。
在没有人为干预的理想情况下,河流径流量和CODMn入海通量通常有着很好的相关性[20],但随着人类生产、生活、建设活动的加剧,对瓯江中下游河段CODMn的影响逐渐加强。结合图6,可进一步发现:1986—1994年瓯江CODMn入海通量与径流量比值的平均值约为0.34,处于相对较高的水平,其中,最小值为0.16(1986年),最大值为0.54(1991年),标准差为0.12,在该时段内瓯江入海水质指标CODMn呈现出较大的波动变化。1994年后,随着人们对环境问题的重视程度逐步提升以及各项环保措施的颁布和实施,瓯江水质有所提升,CODMn入海通量和径流量的比值整体呈现下降趋势。1995—2020年,瓯江CODMn入海通量与径流量比值的平均值降为0.29,标准差为0.07,其中,最小值为0.14(1995年),最大值为0.44(2014年),该时期瓯江入海水质状况相对稳定,与1986—1994年相比,水质得到改善。2018—2020年,瓯江CODMn入海通量与径流量比值逐年下降,到2020年已降至0.24左右。总地来说,瓯江CODMn入海总量呈现出波动降低的趋势。
3 结论
本文以瓯江作为研究对象,基于Landsat系列卫星遥感数据,结合实测数据,构建了瓯江CODMn遥感反演算法,并进一步结合降水量数据估算径流量和CODMn入海通量,进而实现了瓯江CODMn入海通量长时序变化遥感监测,研究结果表明。
1)瓯江中下游河段CODMn在干、湿季的差异并不显著,但在大部分年份,湿季的CODMn略大于干季。
2)1986—2020年瓯江中下游河段CODMn多年平均空间分布显示:温溪—梅岙河段CODMn普遍较低,保持在1 mg/L左右;梅岙—灵都岛河段,CODMn逐渐累积升高,到灵昆岛附近,CODMn升至3 mg/L左右。
3)1986—2020年瓯江CODMn入海通量长时序反演结果表明,瓯江年均CODMn入海通量整体波动较大,呈现降低—升高—降低的演变趋势。
4)1986—1994年瓯江CODMn入海通量与径流量比值的平均值约为0.34,处于相对较高的水平;1994年后,瓯江CODMn入海通量和径流量的比值开始下降,1995—2020年比值均值降低至0.29左右,说明瓯江CODMn入海总量呈现波动降低的趋势。