
0 引言
1 研究方法
1.1 模型及方法
1.2 案例选取
1.3 试验设置
表1 WRF模式物理参数化方案配置Tab.1 Configuration of the physical parameterization schemes in the WRF model |
| 物理选项 | 参数化方案 |
|---|---|
| 云微物理方案(mp_physics) | WSM 6-class graupel方案 |
| 长波辐射(ra_lw_physics) | RRTMG方案 |
| 短波辐射(ra_sw_physics) | RRTMG方案 |
| 表面层物理选项(sf_sfclay_physics) | Monin-Obukhov方案 |
| 地表陆面方案(sf_surface_physics) | Noah地表模型 |
| 行星边界层(bl_pbl_physics) | YSU方案 |
| 积云参数(cu_physics) | Kain-Fritsch方案 |
2 模式验证
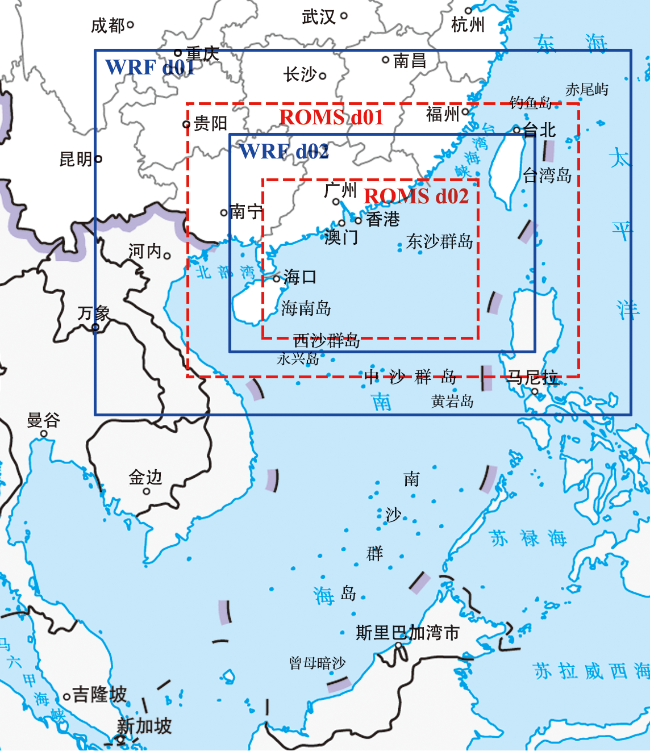
图1 耦合模式计算区域及嵌套网格示意图(蓝色实线表示WRF嵌套网格,红色虚线表示ROMS嵌套网格。) Fig.1 The simulation domain and nested grids of the coupled air-sea model (The blue solid line represents the WRF nested grid,and the red dashed line represents the ROMS nested grid.) |
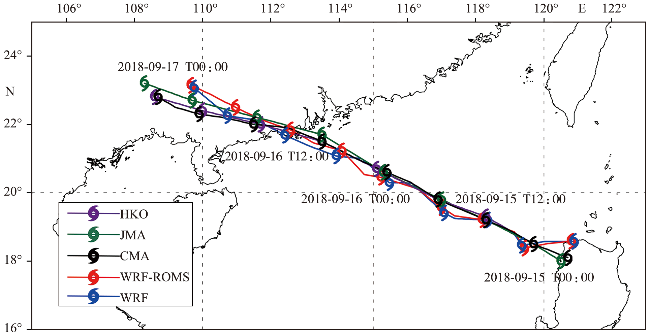
图2 不同模式下超强台风“山竹”模拟路径与最佳路径的对比Fig.2 Comparison between the simulated track and the best track of super typhoon Mangkhut in different models |
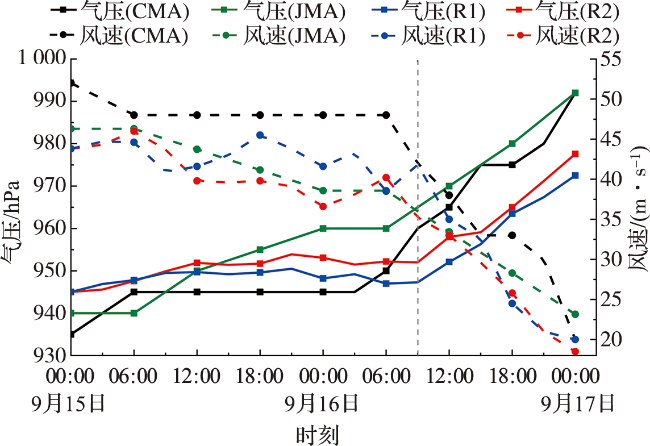
图3 模式与最佳路径数据集的台风中心气压和近中心最大风速对比(竖向虚线代表台风登陆时刻。) Fig.3 Comparison of typhoon central pressure and maximum wind speed from the models with those from the best-track dataset (Vertical dashed line represents the time of typhoon landfall.) |
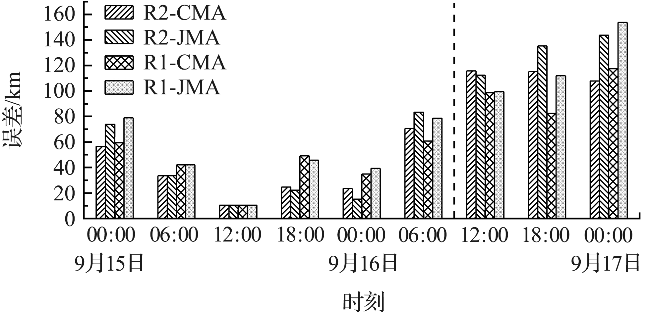
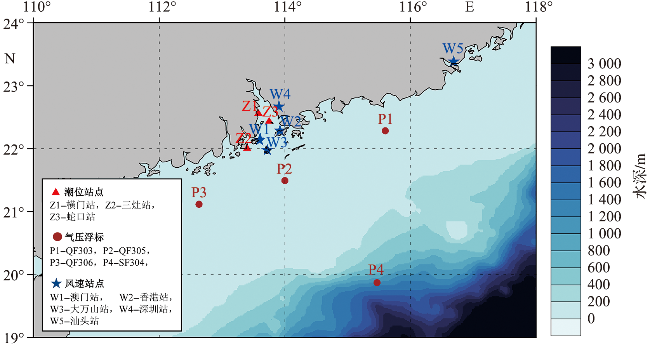
图5 超强台风“山竹”影响期间风速、海平面气压、潮位测站分布位置示意图Fig.5 Distribution diagram of wind speed, sea level pressure and tide stations during the influence of super typhoon Mangkhut |
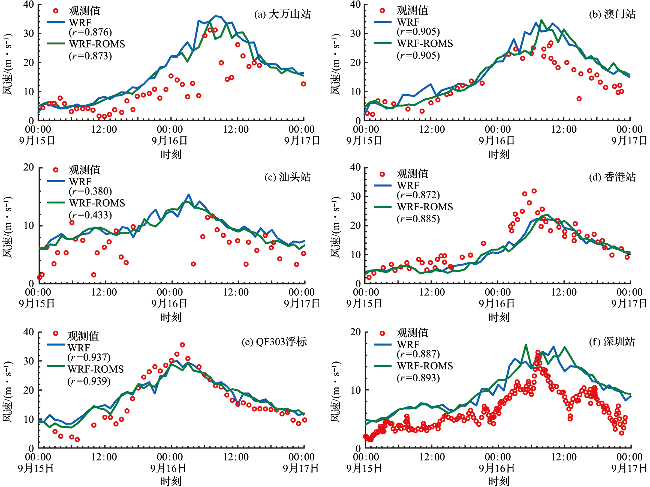
图6 模拟风速与实测风速时程对比Fig.6 Time series comparison between models’ wind speed and observed wind speed |
3 结果与讨论
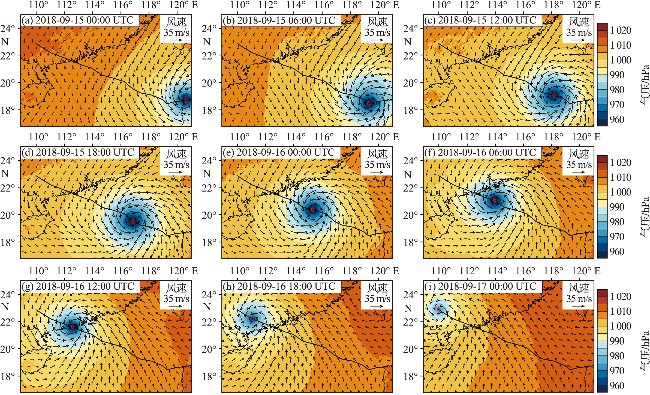
3.1 台风风场与气压场
3.2 风生流场
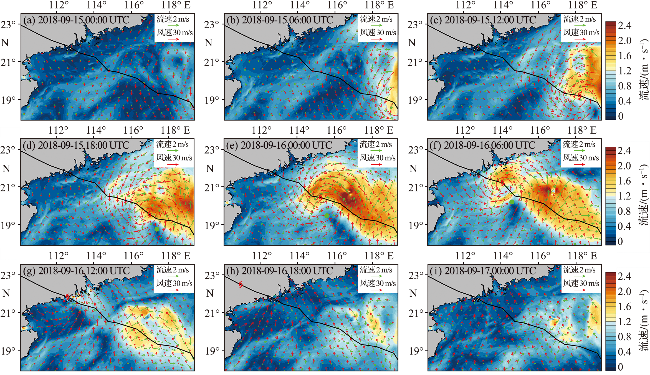
 表示台风中心;
  表示流场中心。)
 represents the typhoon center;
  represents the center of the flow field.)
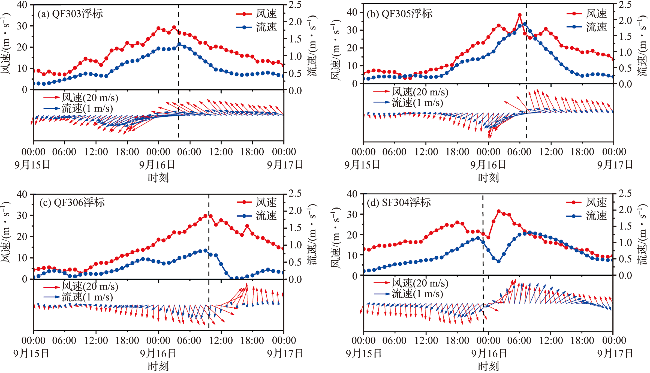
3.3 风暴增水
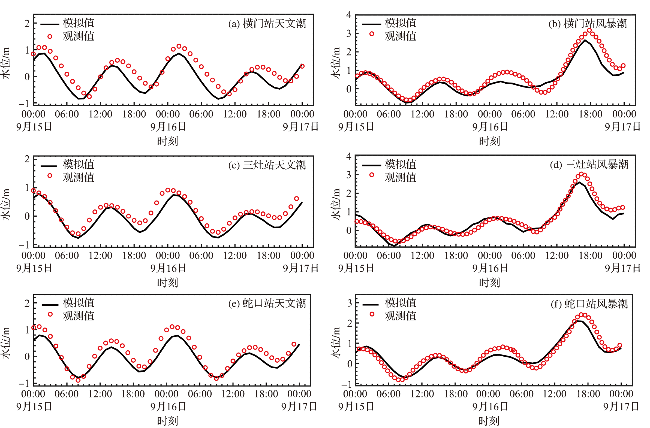
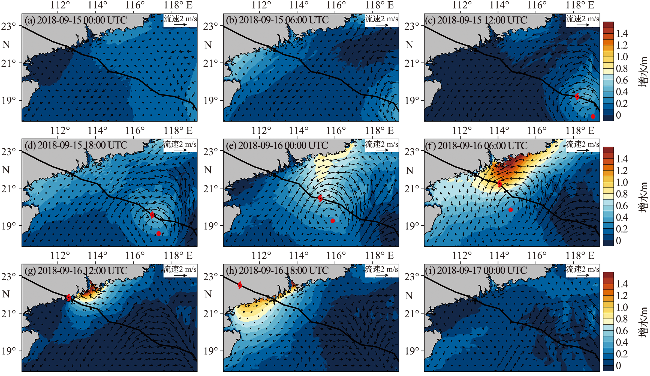
图12 海表流场和台风引起的风暴增水的空间分布( Fig.12 Spatial distribution of sea surface current fields and surge caused by super typhoon Mangkhut ( |
 表示台风中心;
  表示流场中心。)
 represents the typhoon center;
  represents the center of the flow field.)
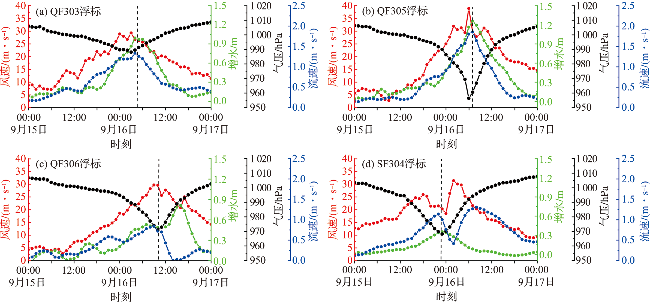