
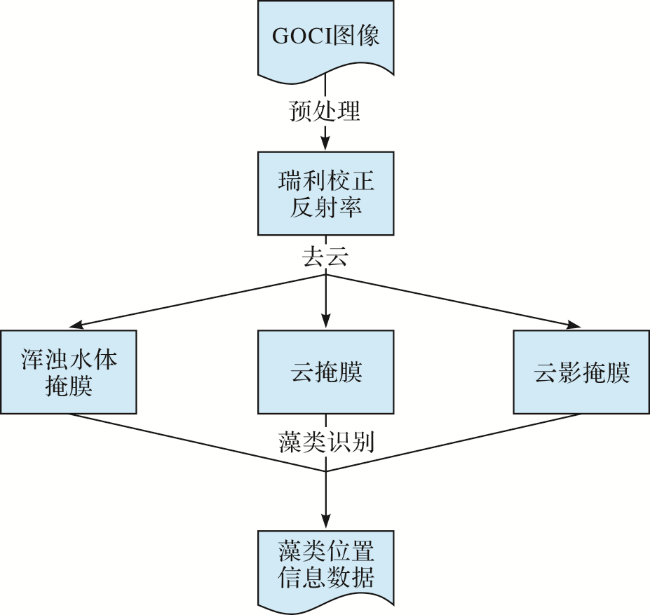
0 引言
1 方法和数据
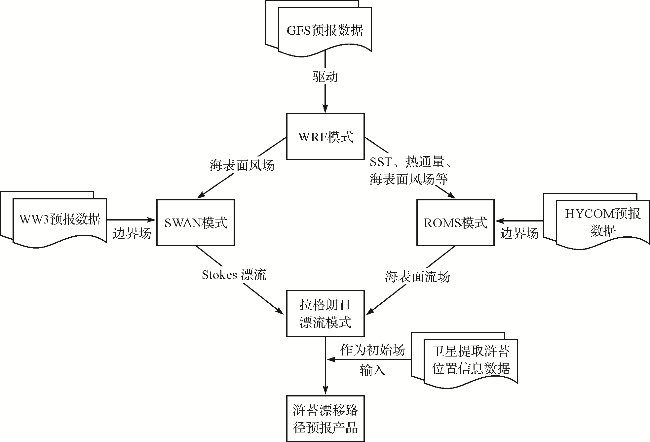
1.1 预报流程
1.2 模式设置
1.2.1 WRF模式设置
1.2.2 SWAN模式设置
1.2.3 ROMS模式设置
1.3 数据
1.4 遥感技术
1.4.1 数据下载
1.4.2 数据预处理
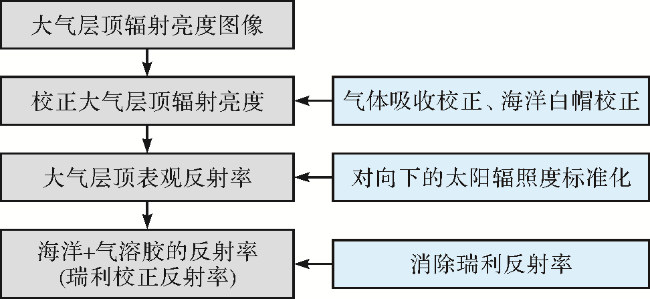
1.4.3 算法介绍
2 结果与讨论
2.1 模式输出物理场验证
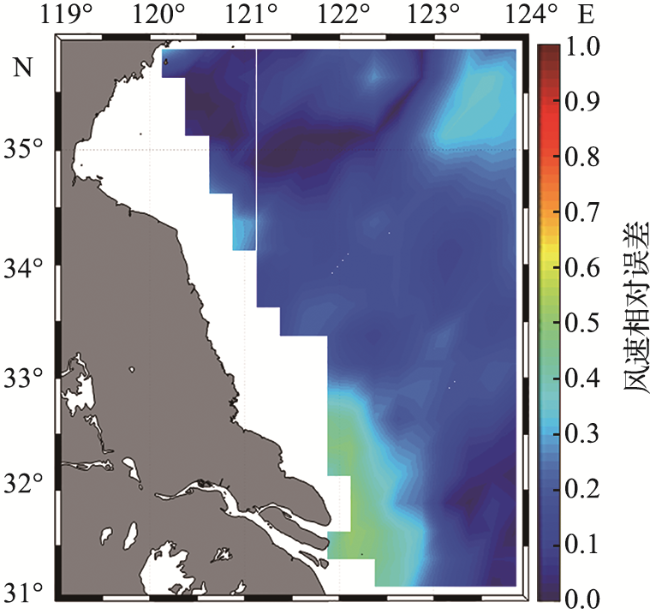
2.1.1 WRF模式验证
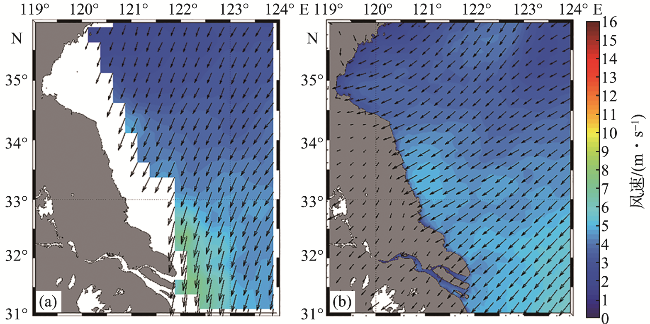
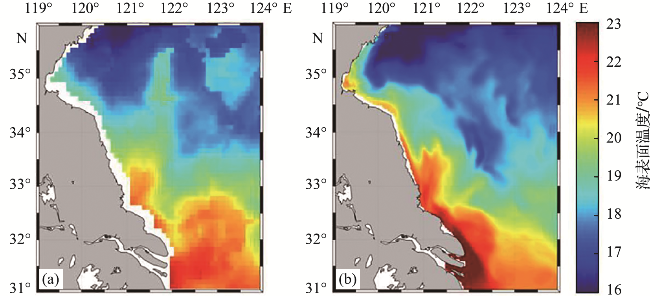
图6 ASCAT观测的(a)和WRF模式模拟的(b)2019年9月研究区海面10 m风速月平均数据对比Fig.6 Comparison between ASCAT observation (a) and WRF model simulation (b) in monthly average sea surface wind speed data at 10 meters in the study area in September 2019 |
2.1.2 SWAN模式验证
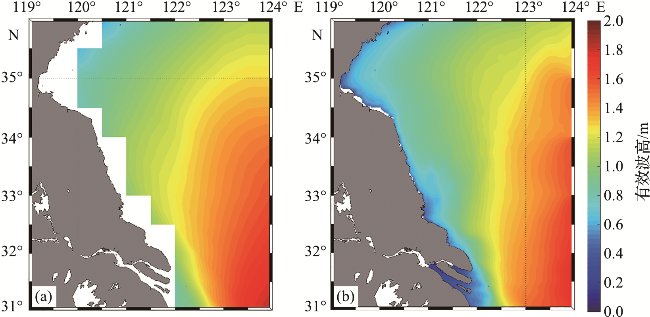
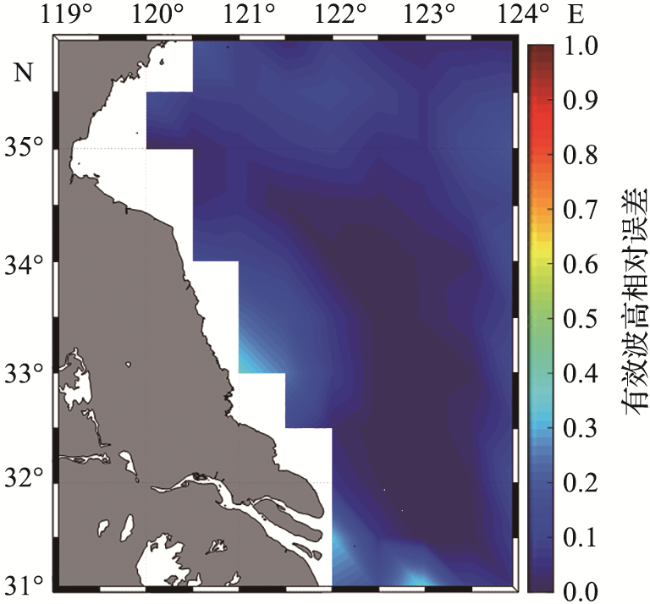
图8 ERA5(a)和SWAN模式(b)模拟的2019年9月研究区月平均有效波高对比Fig.8 Comparison the of monthly average significant wave heights simulated by ERA5 (a) and SWAN model (b) in the study area in September 2019 |
2.1.3 ROMS模式验证
2.2 浒苔漂移评估
2.2.1 评估方法
2.2.2 第一组数据对比
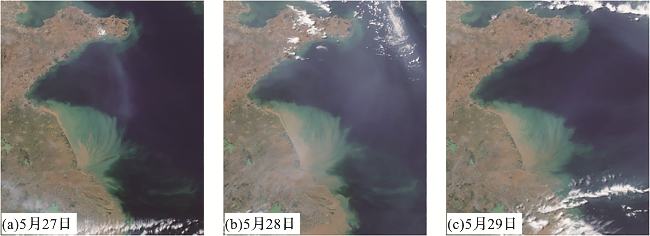
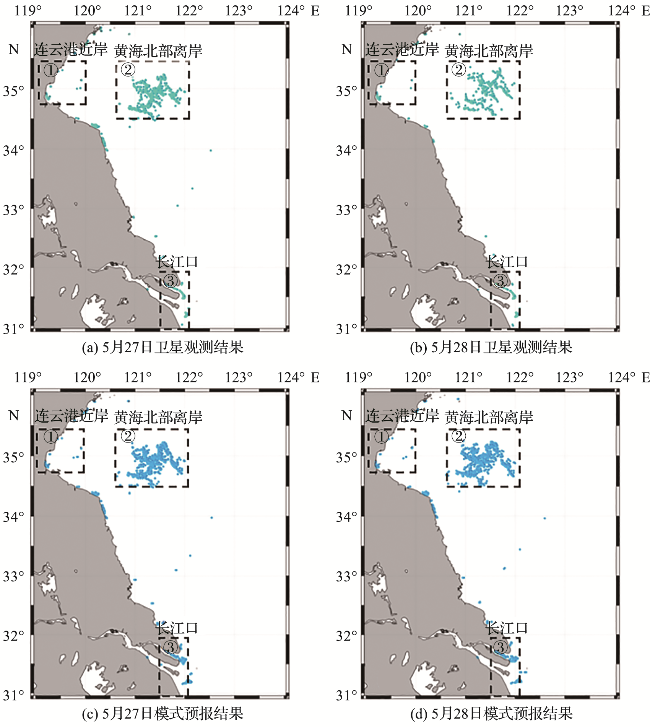
图12 2017年5月27日与28日模式预报的浒苔覆盖区域与卫星观测结果对比(虚框表示浒苔出现区块。) Fig.12 Comparison of the coverage area of UIva prolifera predicted by the model and satellite observations on May 27th and 28th, 2017 (The dashed box represents the appearance block of UIva prolifera.) |
表1 48 h模式预报与卫星观测的浒苔覆盖面积及中心点位置(2017年5月27日与28日的平均值)Tab.1 48-hour model prediction and satellite observation of the coverage area and center point position of UIva prolifera (average values of May 27th and 28th, 2017) |
| 区域 | 浒苔覆盖面积 | 浒苔中心点位置 | |||||
|---|---|---|---|---|---|---|---|
| 卫星观测/km2 | 模式预报/km2 | 误差/% | 卫星观测 | 模式预报 | 误差/km | ||
| 连云港近岸 | 38.89 | 31.56 | 23.20 | 34.88 °N,119.25 °E | 34.89 °N,119.24 °E | 0.01 | |
| 黄海北部离岸 | 975.17 | 1 170.60 | 16.70 | 35.01 °N,121.41 °E | 34.87 °N,121.23 °E | 0.28 | |
| 长江口 | 133.82 | 166.23 | 19.50 | 31.48 °N,121.93 °E | 31.64 °N,121.86 °E | 0.28 | |
| 江苏近海 | 1 147.88 | 1 368.39 | 16.11 | ||||
注:表中空白表示无数据。 |
表2 48 h模式预报与卫星观测的浒苔漂移方向(2017年5月27日和28日)Tab.2 48-hour model prediction and satellite observation of the drift direction of UIva prolifera (May 27th and 28th, 2017) |
| 区域 | 5月27日浒苔漂移方向/(°) | 5月28日浒苔漂移方向/(°) | |||||
|---|---|---|---|---|---|---|---|
| 卫星观测 | 模式预报 | 误差 | 卫星观测 | 模式预报 | 误差 | ||
| 连云港近岸 | 275.49 | 214.42 | 61.07 | 88.85 | 52.59 | 36.26 | |
| 黄海北部离岸 | 39.88 | 48.84 | -8.96 | 33.60 | 137.89 | -104.29 | |
| 长江口 | 294.16 | 334.53 | -40.37 | 95.58 | 86.68 | 8.90 | |
注:表中漂移方向为当日模式或卫星结果与前一日结果根据公式(12)计算得到。 |
2.2.3 第二组数据对比
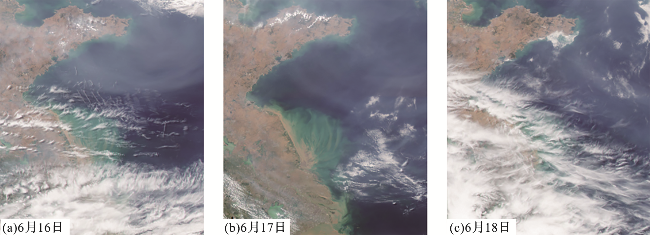
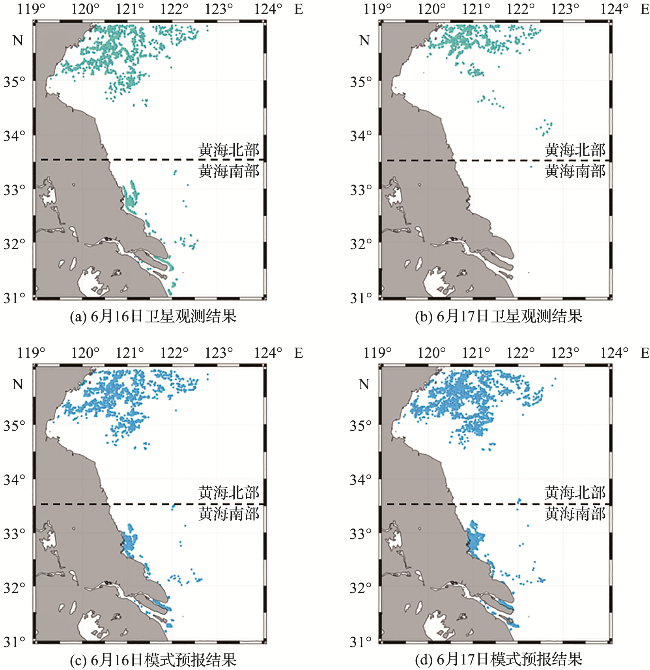
图14 2017年6月16日与17日模式预报的浒苔覆盖区域与卫星观测结果对比Fig.14 Comparison of the coverage area of UIva prolifera predicted by the model and satellite observations on June 16th and 17th, 2017 |
表3 48 h模式预报与卫星观测的浒苔覆盖面积及中心点位置(2017年6月16日和17日的平均值)Tab.3 48-hour model prediction and satellite observation of the coverage area and center point position of UIva prolifera (average values of June 16th and 17th, 2017) |
| 区域 | 浒苔覆盖面积 | 浒苔中心点位置 | |||||
|---|---|---|---|---|---|---|---|
| 卫星观测/km2 | 模式预报/km2 | 误差/% | 卫星观测 | 模式预报 | 误差/km | ||
| 黄海北部 | 1 270.30 | 1 212.00 | 4.81 | 35.61°N,120.85°E | 34.88°N,121.17°E | 1.20 | |
| 黄海南部 | 440.61 | 155.71 | 182.97 | 32.89°N,122.84°E | 31.62°N,121.85°E | 2.04 | |
| 江苏近海 | 1 710.91 | 1 367.71 | 25.09 | ||||
注:表中空白表示无数据。 |
表4 48 h模式预报与卫星观测的浒苔漂移方向(2017年6月16日和17日)Tab.4 48-hour model prediction and satellite observation of the drift direction of UIva prolifera (June 16th and 17th, 2017) |
| 区域 | 6月16日浒苔漂移方向/(°) | 6月17日浒苔漂移方向/(°) | |||||
|---|---|---|---|---|---|---|---|
| 卫星观测 | 模式预报 | 误差 | 卫星观测 | 模式预报 | 误差 | ||
| 黄海北部 | 58.61 | 66.13 | -7.52 | 47.53 | 126.43 | -78.90 | |
| 黄海南部 | 229.13 | 224.27 | 4.86 | 48.73 | 268.99 | -220.26 | |
注:表中漂移方向为当日模式与卫星结果与前一日结果根据公式(12)计算得到。 |
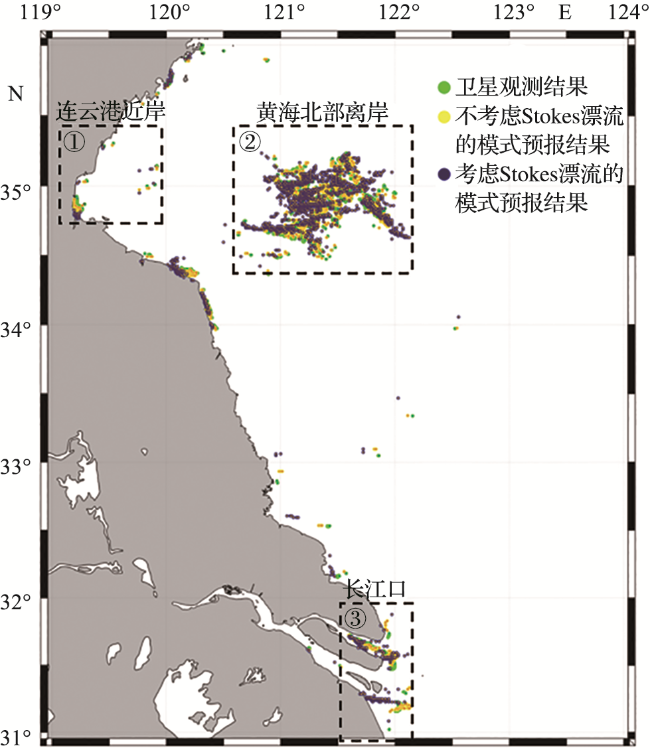
2.3 Stokes漂流对模式预报的影响
图15 考虑Stokes漂流模式和不考虑Stokes漂流模式24 h预报的浒苔分布与卫星观测结果的对比(2017年5月27日)Fig.15 Comparison between the distribution of UIva prolifera predicted by the 24-hour forecast considering and without considering the Stokes Drift model and the satellite observation results (May 27th, 2017) |
表5 考虑Stokes漂流模式和不考虑Stokes漂流模式预报的24 h浒苔覆盖面积与卫星观测结果对比(2017年5月27日)Tab.5 Comparison of 24-hour UIva prolifera coverage area predicted by considering and without considering the Stokes Drift model with satellite observation results (May 27th, 2017) |
| 区域 | 浒苔覆盖面积/km2 | 模式预报浒苔覆盖面积与卫星观测结果的误差/% | ||||
|---|---|---|---|---|---|---|
| 卫星观测 | 考虑Stokes漂流模式 | 不考虑Stokes漂流模式 | 考虑Stokes漂流模式 | 不考虑Stokes漂流模式 | ||
| 连云港近岸 | 34.34 | 32.26 | 26.65 | 0.06 | 28.84 | |
| 黄海北部离岸 | 1 029.70 | 1 200.77 | 1 474.32 | 14.25 | 30.16 | |
| 长江口 | 143.42 | 175.35 | 200.60 | 18.21 | 28.50 | |
| 江苏近海 | 1 207.46 | 1 408.38 | 1 701.57 | 14.27 | 29.04 | |
表6 考虑Stokes漂流模式和不考虑Stokes漂流模式预报的24 h浒苔中心点位置与卫星观测结果对比(2017年5月27日)Tab.6 Comparison of the 24-hour center position of UIva prolifera predicted by considering and without considering the Stokes Drift model with satellite observation results (May 27th, 2017) |
| 区域 | 浒苔中心点位置 | 模式预报浒苔中心点位置与卫星观测结果的误差/km | ||||
|---|---|---|---|---|---|---|
| 卫星观测 | 考虑Stokes漂流模式 | 不考虑Stokes漂流模式 | 考虑Stokes漂流模式 | 不考虑Stokes漂流模式 | ||
| 连云港近岸 | 34.87°N,119.25°E | 34.87°N,119.24°E | 34.88°N,119.23°E | 0.01 | 0.02 | |
| 黄海北部离岸 | 34.96°N,121.34°E | 34.86°N,121.23°E | 34.86°N,121.24°E | 0.19 | 0.19 | |
| 长江口 | 31.45°N,121.93°E | 31.64°N,121.76°E | 31.63°N,121.86°E | 0.38 | 0.32 | |
表7 考虑Stokes漂流模式和不考虑Stokes漂流模式预报的24 h浒苔漂移方向(2017年5月27日)Tab.7 Comparison of 24-hour drift directions of UIva prolifera predicted by considering and without considering the Stokes Drift model with satellite observation results (May 27th, 2017) |
| 区域 | 浒苔漂移方向/(°) | 模式预报浒苔漂移方向与卫星观测结果的误差/(°) | ||||
|---|---|---|---|---|---|---|
| 卫星观测 | 考虑Stokes漂流模式 | 不考虑Stokes漂流模式 | 考虑Stokes漂流模式 | 不考虑Stokes漂流模式 | ||
| 连云港近岸 | 275.49 | 279.85 | 214.42 | -4.36 | 61.07 | |
| 黄海北部离岸 | 39.88 | 40.44 | 48.84 | -0.57 | -8.96 | |
| 长江口 | 294.16 | 156.28 | 334.53 | 137.88 | -40.37 | |
注:表中漂移方向为当日模式或卫星结果与前一日结果根据公式(12)计算得到。 |