
0 引言
1 数据与方法
表1 SHIPS-RII预报因子Tab.1 Predictive factors utilized in SHIPS-RII |
| 序号 | 预报因子 | 定义 |
|---|---|---|
| 1 | PER | 前12 h TC强度变化 |
| 2 | VMX0 | 最大持续风速(t=0 h) |
| 3 | POT | TC潜在强度(TC当前强度-最大可能强度) |
| 4 | OHC | 海洋热含量 |
| 5 | SHRD | 滤波后500 km半径范围内850 hPa与200 hPa之间的水平风垂直切变 |
| 6 | D200 | 1 000 km半径范围内200 hPa散度 |
| 7 | TPW | 500 km半径范围内以上切方向为中心的90°方位象限内总降水量小于45 mm的区域所占百分比 |
| 8 | PC2 | 440 km半径范围内GOES-IR图像的第二主成分(t=0 h) |
| 9 | SDBT | 50~200 km半径范围内GOES BT的标准差 |
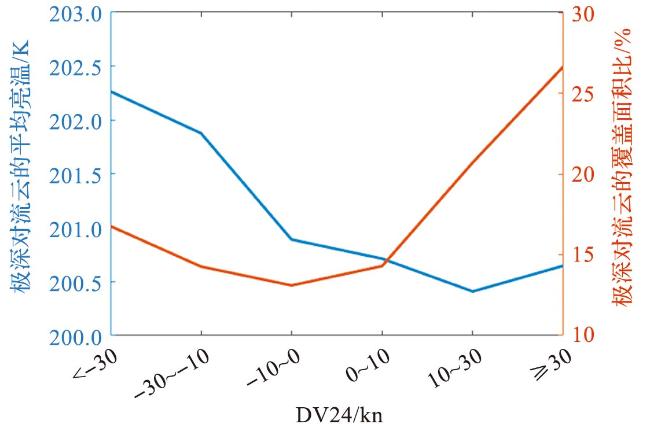
2 极深对流云与TC强度变化的关系
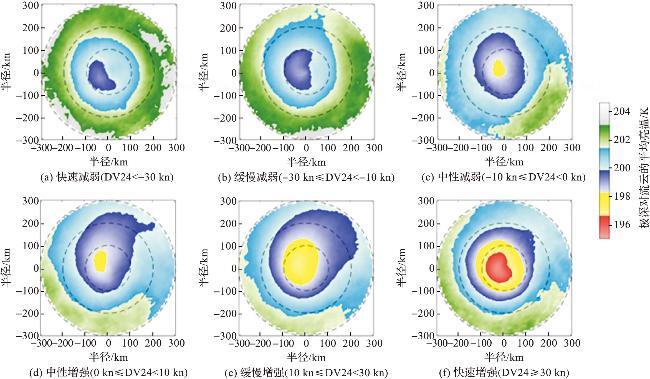
图2 2000—2019年西北太平洋TC中心300 km半径范围内极深对流云的平均亮温随TC强度变化率变化的合成图Fig.2 Composite image showing the variation in average brightness temperature of extremely deep convective clouds within a 300 km radius of the Western North Pacific (WNP) TC center from 2000 to 2019, as a function of TC intensity change rate |
3 模型预测能力对比
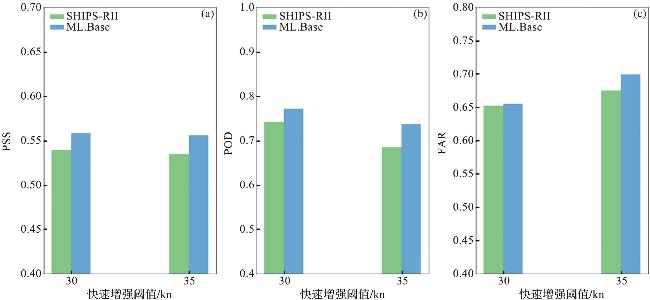
图4 SHIPS-RII模型和ML.Base模型对于西北太平洋 2011—2019年间TC快速增强的预测能力对比Fig.4 Comparison of prediction capabilities of the SHIPS-RII model and the ML.Base model for TC rapid intensification in WNP from 2011 to 2019 |
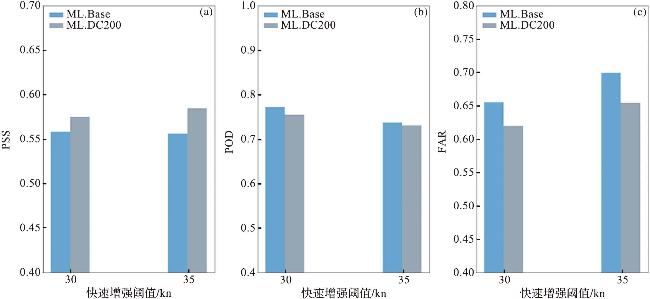
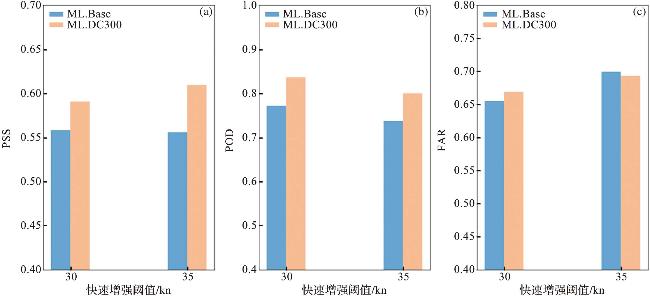
图5 ML.Base模型和ML.DC200模型对于西北太平洋2011—2019年间TC快速增强的预测能力对比Fig.5 Comparison of prediction capabilities of the ML.Base model and the ML.DC200 model for TC rapid intensification in WNP from 2011 to 2019 |
4 机器学习模型的应用
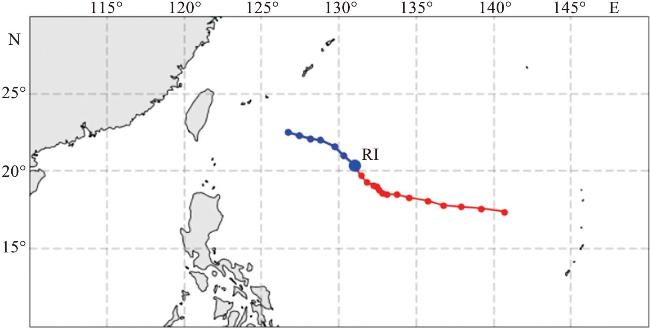
图7 2015年台风杜鹃增强期间的轨迹(图中RI代表快速增强开始的位置,蓝色线表示快速增强,红色线表示非快速增强。) Fig.7 The track during typhoon Dujuan’s intensification in 2015 (RI represents where rapid intensification begins, blue line indicates rapid intensification and red line indicates non-rapid intensification.) |
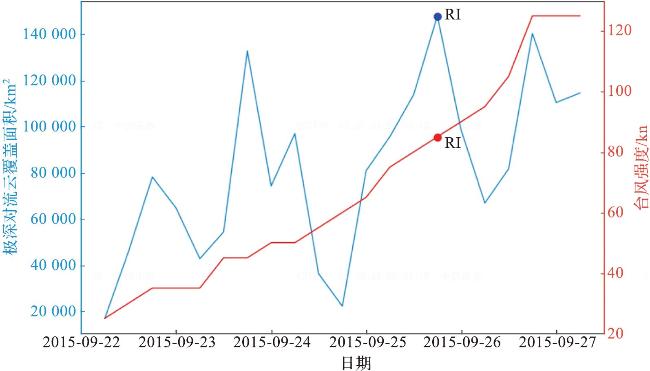
图8 典型台风杜鹃生命周期内TC中心300 km半径范围内极深对流云覆盖面积和台风强度随时间的变化(图中RI代表快速增强开始的位置。) Fig.8 Variation of coverage area of extremely deep convective clouds within a 300 km radius of the TC center and TC intensity during the life cycle of typical typhoon Dujuan (RI represents where rapid intensification begins.) |