
0 引言
ENSO(El Niño-Southern Oscillation)是热带海洋和大气中最强的年际变率,不仅控制着热带地区的天气和气候,也会通过大气遥相关把能量和信号传递到中高纬度[1-2]。拉尼娜和厄尔尼诺是ENSO循环过程中的两个位相,受到大气环流(风和深对流)、海温和海洋波动等因素的影响。然而,准确预测ENSO仍然是现今气候模式的一大挑战[3⇓-5],这主要是ENSO的复杂性和多样性造成的。拉尼娜和厄尔尼诺在振幅、经纬向分布格局、纬向传播、充放电过程、时间演化及其全球影响等方面均存在一定的不对称特征[6-7]。一个显著的特征就是拉尼娜和厄尔尼诺在时间演化上的不对称:厄尔尼诺通常从北半球夏季发展,至次年春季衰退,持续一年左右;而拉尼娜不仅会出现持续一年的事件,还会出现连续多年发生的现象[8-9]。多年拉尼娜对全球气候的影响更加持久,特别是陆地上会出现凉爽潮湿的气候[10-11],这甚至可能减缓全球变暖的速度[12⇓-14]。因此,进一步理解多重拉尼娜事件的特征,能够更好地认识热带太平洋海气耦合过程及其对全球气候系统的影响,提高对ENSO的预报和预测能力。
国内外学者对拉尼娜事件开展了大量研究[15-16],发现拉尼娜的爆发离不开大气和海洋的共同作用。在拉尼娜期间,海洋表面主要表现为东冷西暖的温度异常分布,并且东风异常及东高西低的海表面气压有利于海面温度异常的维持。WYRTKI[17-18]首先提出西太平洋次表层暖水的积累是厄尔尼诺及拉尼娜形成的必要前提,在拉尼娜(厄尔尼诺)爆发前夕,整个热带太平洋的上层海洋暖水趋于减少(增加),而在拉尼娜(厄尔尼诺)爆发期间,暖水由赤道外地区聚集到赤道(由赤道排放到赤道外地区),这也造成了ENSO正负位相循环。JIN[19-20]在耦合模型的基础上建立并推导了“充放电振荡”模型,强调了“充放电过程”理论(recharge-discharge oscillator theory):厄尔尼诺期间,与赤道中太平洋西风异常和赤道东太平洋暖海温异常相关的Sverdrup输运辐散,导致赤道暖水释放,使得整个赤道太平洋温跃层深度变浅;随后,变浅的温跃层使得异常的冷水通过上升流泵入表层,导致拉尼娜的发生。他们的工作从观测和理论上均证实了“充电-放电”过程使得耦合的海洋-大气系统在年际时间尺度上发生振荡。
前人对一年期的拉尼娜事件的研究比较深入,对连续多年发生的拉尼娜事件的研究相对较少,其根本原因是后者的发生频率较低,而连续三年发生的“三重”拉尼娜事件更是罕见。在全球变暖的影响下,厄尔尼诺逐渐减少,而拉尼娜的发生则更加频繁,多重拉尼娜事件也会逐渐增多[21-22]。自1950年以来,有记录的“三重”拉尼娜事件仅发生过三次,其中第三次出现在2020—2023年。自2020年拉尼娜爆发后,热带东太平洋海面温度一直处于负异常,之后的2021年、2022年都爆发了拉尼娜,直到2023年夏季,该“三重”拉尼娜事件才彻底消亡。此次“三重”拉尼娜引发了一系列气象灾害。例如,2020年,在中国西部地区、华南地区和长江流域发生的夏季高温和干旱[23-24],2020年、2021年冬季,在中国北部和南部发生的极端寒潮[25-26]。有研究利用卫星遥感数据分析了中国东部沿海地区在2020年/2021年拉尼娜期间的风场异常,指出该风场异常可能导致沿海地区的降水偏多,与单次拉尼娜事件的影响有所区别[27-28]。JEONG等[29]认为2022年北大西洋海温变暖以及太平洋年代际振荡(Pacific decadal oscillation,PDO)和印度洋偶极子(Indian Ocean dipole,IOD)的负位相就是由发生在赤道中东太平洋海域的拉尼娜事件驱动的,而负位相的IOD与拉尼娜结合,导致了巴基斯坦和印度西北部的强降雨。在这期间,整个欧洲遭受了持续的干旱和热浪[30-31]。上述现象都说明多重拉尼娜事件对气候的影响可能比单次拉尼娜事件更加持久、更加剧烈,对人类生命财产安全的威胁也更大,因此有必要对 “三重”拉尼娜事件进行研究和分析。
针对2020—2023年“三重”拉尼娜事件,郑飞等[32]发现其发生与前期海洋暖水异常有显著关联;FANG等[33]认为东太平洋经向风应力异常对于触发2022—2023年拉尼娜事件很重要;LI等[34]发现海温经向梯度与年周期海温的反对称模式有关,推测这可能是2020—2023年“三重”拉尼娜事件发生的重要因素。尽管在这些研究中已对触发“三重”拉尼娜事件的可能机制进行了探讨[35-36],但当前还缺乏对各重拉尼娜间差异与联系的分析,而这能够帮助人们理解哪些大气和海洋过程在连续三年发生拉尼娜事件中起着至关重要的作用。因此,本文重点讨论了2020—2023年“三重”拉尼娜期间热带太平洋上层海洋的时空差异,并分析了海表和次表层变化对此次拉尼娜的贡献。
1 数据与方法
本文使用的海面温度(sea surface temperature, SST)数据来源于扩展重建海面温度(extended reconstructed sea surface temperature,ERSST v3b)月平均数据,空间分辨率为2°×2°。次表层海温数据为全球海洋资料同化系统(the global ocean data assimilation system,GODAS)月平均数据,其水平分辨率为1/3°(纬度)×1°(经度),垂向共32层。海表面风场选用的是美国国家环境预报中心(National Centers for Environmental Prediction,NCEP)再分析数据集,空间分辨率为2.5°× 2.5°。本文数据时段为2020年1月—2023年5月。
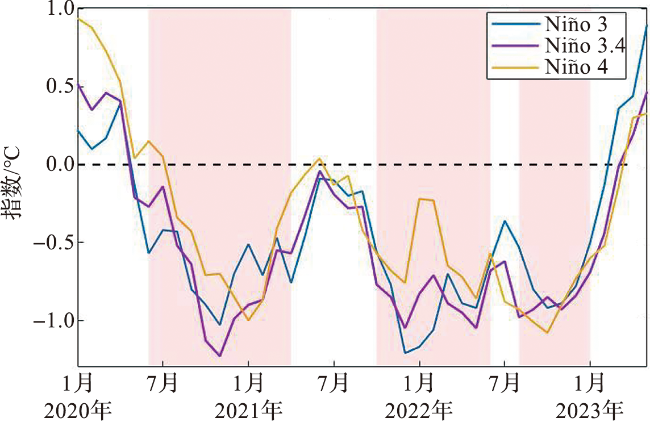
Niño 3、Niño 3.4和Niño 4指数分别为Niño 3区(150°W—90°W,5°N—5°S)、Niño 3.4区(170°W—120°W,5°N—5°S)以及Niño 4区(160°E—150°W,5°N—5°S)的平均海面温度异常,指数可以表征拉尼娜强度,低于-0.5 ℃时视为拉尼娜事件爆发。这三个指数下载于美国国家海洋和大气管理局(National Oceanic and Atmospheric Administration,NOAA;https://psl.noaa.gov/data/correlation/nina34.anom.data)。
本文以各变量2003—2022年的平均值作为气候态来计算各变量的异常场。
2 结果
2.1 海温和海表风场分布差异
图1展示了2020年1月—2023年5月三个Niño指数的变化情况。从图中可以看出,三个指数的变化在这三年基本一致:自2020年5月开始,指数由正转负,至同年6月,指数逐渐低于-0.5 ℃,代表着“第一重”拉尼娜事件暴发,2021年1月起,指数开始增加,至4月指数大于-0.5 ℃,表示“第一重”拉尼娜事件结束;2021年10月暴发“第二重”拉尼娜事件,2022年6月,“第二重”拉尼娜事件结束;2022年8月,三个指数再次均低于-0.5 ℃,“第三重”拉尼娜暴发,持续到2023年1月消亡。三重拉尼娜事件的持续时间分别为11个月、9个月和6个月(图1阴影所示),即“第一重”拉尼娜事件的持续时间最长,“第三重”拉尼娜事件的持续时间最短。从图1中可以看到,“三重”拉尼娜期间,指数最大值分别为-1.29 ℃(Niño 3.4,2020年12月)、-1.27 ℃(Niño 3,2021年12月)和-1.09 ℃(Niño 4,2022年9月),说明“第一重”拉尼娜相对最强;“第二重”拉尼娜时,海温负异常中心偏东,为东部型; “第三重”拉尼娜事件相对最弱,呈中部型。
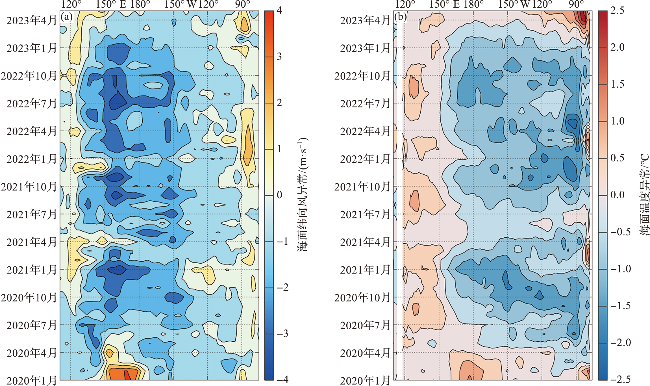
为了进一步分析海表面风场和海温异常在各重拉尼娜期间的差异,对2020年1月—2023年5月热带太平洋(5°S—5°N)平均海面温度异常和纬向风异常随时间的演变过程进行分析(图3)。从图中可以看出,东风异常中心主要出现在130°E—140°W之间,海面温度负异常位于150°E以东的区域。整体来看,赤道纬向风的变化超前海温变化,其从2020年4月由正异常转为负异常,表明纬向风由西风异常转变为东风异常,一个月之后(2020年5月),赤道中东太平洋的海面温度异常也由正转负。在“三重”拉尼娜期间,东风异常持续控制着赤道西太平洋和中太平洋,极大值中心位于150°E—180°之间,虽然在2021年4月出现了西风异常,但仅持续了1个月,强度也较弱。相应地,在2021年夏季(6—8月),受纬向风强迫,海面温度负异常减弱,甚至在赤道东太平洋出现了较弱的海温正异常。随后东风异常再次出现并增强,分别在2021年10—12月和2022年6—10月达到最强,促进了 “第二重”和“第三重”拉尼娜事件的暴发。2023年2月以后,东风异常和海面温度负异常逐渐减弱,这也意味着持续三年的拉尼娜事件开始衰退,热带太平洋风场和海面温度异常信号逐渐消退。
2.2 次表层温度差异
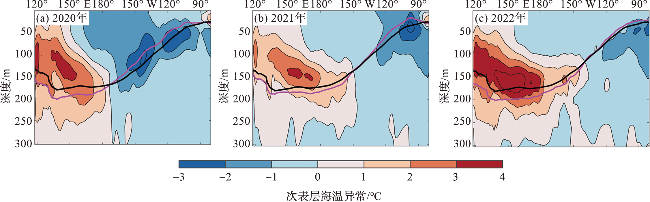
图4 赤道太平洋(2°S—2°N)次表层海温异常以及20 ℃等温线深度(紫色线表示20 ℃等温线深度的各年冬季均值,黑色粗线表示20 ℃等温线深度的气候态。) Fig.4 The subsurface ocean temperature anomaly and the 20 ℃ isotherm depth between 2°S and 2°N over the tropical Pacific (The purple line represents the mean value of 20 ℃ isotherm depth in winter of each year and the black thick line indicats the climatological state of the 20 ℃ isotherm depth.) |
图4中的紫色实线表示20 ℃等温线深度的冬季均值,它相对于气候态呈现西深东浅的分布,反映了开尔文波传播的结果。海洋波动主要受到纬向风应力驱动,对于拉尼娜的暴发及维持十分重要,有研究认为东风异常引起的东传、上升的开尔文波是激发拉尼娜事件的重要因素之一,并且,东风异常还有助于热带中东太平洋地区的冷水上涌和表层降温[39-40]。20 ℃等温线变化通常代表着温跃层深度的起伏,东传、上升的开尔文波表现在温跃层深度上即为向东传播的负异常信号。如图5所示,在“三重”拉尼娜期间,赤道太平洋温跃层深度基本呈现西部加深、东部变浅的特征,在2020年末、2021年10月和2022年7月初,均可以看到东太平洋温跃层深度变浅,并且随着时间推移向东传播。通过计算发现,20 ℃深度负异常信号从西太平洋传播至东太平洋沿岸花费了约3个月的时间,传播速度约为2.3 m/s,与赤道海洋开尔文波的传播速度一致。赤道中东太平洋温跃层深度负异常(变浅)通常在冬季最高,最大可以达到30 m。这种波动和温跃层深度的变化一定程度上有助于“三重”拉尼娜事件的维持。然而对比发现,在各重拉尼娜期间,开尔文波东传速度和温跃层深度差异均不明显,这也意味着海洋波动对“三重”拉尼娜差异的影响较小。
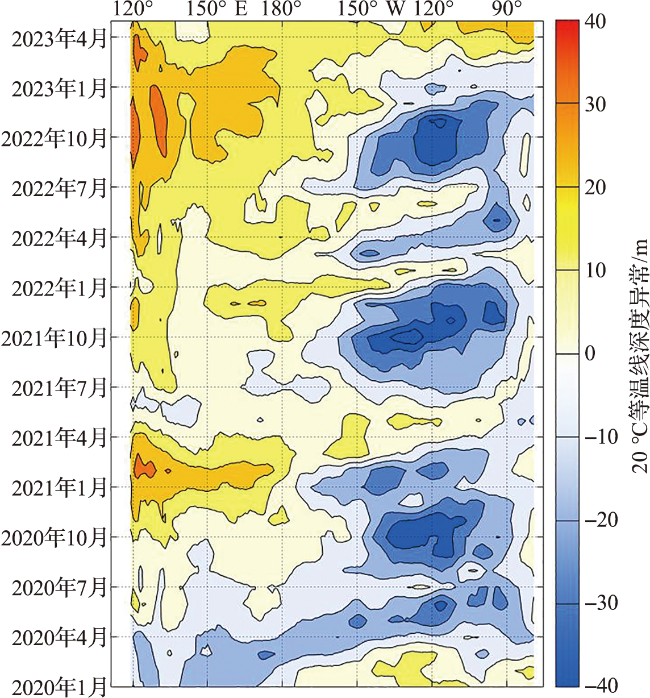
图5 2020年1月—2023年5月热带太平洋2°N—2°S平均20 ℃等温线深度异常(正值代表温跃层加深,负值表示温跃层变浅。) Fig.5 The averaged 20 ℃ isotherm depth anomaly between 2°N and 2°S over the tropical Pacific from January 2020 to May 2023 (Positive value indicates deepening thermocline, while negative value indicates shallowing thermocline.) |
根据充放电理论[19-20],在ENSO循环过程中,海洋上层热含量会产生一个充电(放电)的Sverdrup响应以调节ENSO的位相变化。海洋上层热含量往往用暖水体积表示,它是温跃层深度在120°E—80°W,5°N—5°S的积分,已被观测和模式证实其超前ENSO的海温变化1~3个季节。通常,在厄尔尼诺发生前,暖水体积会异常增多,而在拉尼娜发生前,暖水体积会减少。如图6所示,从2020年初开始,暖水体积逐渐减少[19-20],在5月份达到最低值(-1.08×10¹⁴ m3),随后暖水体积开始增加,“第一重”拉尼娜暴发后,暖水体积仍然快速增加,直至2021年3月达到极大值,随后再次下降,至2021年10月,暖水体积达到极小值,之后再次增多并一直持续到“三重”拉尼娜事件结束。前人研究指出,暖水体积的增长速率与拉尼娜或厄尔尼诺的强度有关[41]。从图6中可以看到,在“第一重”和“第二重”拉尼娜暴发后,暖水体积均迅速增长,但在“第三重”拉尼娜的前期,暖水体积的上升趋势较弱,这可能也是导致其强度较前两重拉尼娜弱的原因。
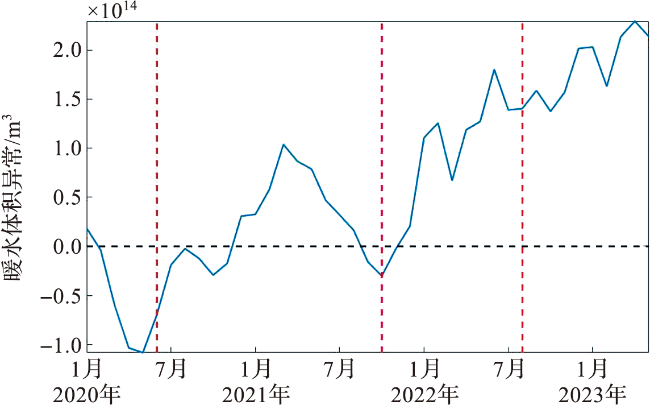
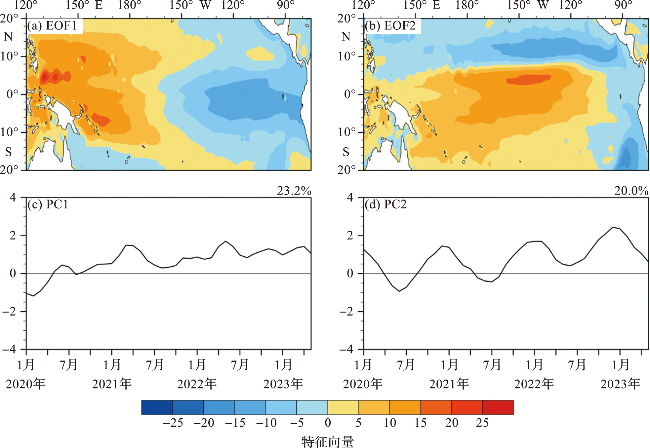
图7展示了热带太平洋20 ℃等温线深度的经验正交函数分解(empirical orthogonal function,EOF)的前两个模态及其时间序列。前两个模态表征了次表层海温的主要变化,方差贡献率分别为23.2%和20.0%。第一模态表现为东侧温跃层变浅,西侧加深,与拉尼娜期间的温跃层变化一致,代表着拉尼娜期间次表层温度变化。PC1在“三重”拉尼娜期间大多为正值,从2020年1月开始快速增长,至同年4月由负转正,代表拉尼娜事件的快速发展;在2021年3月达到极大值,后维持在相对稳定的水平,与暖水体积异常的特征一致(图6)。第二模态表现为经向跷跷板结构,表征着赤道暖水体积的辐聚和辐散:正异常时,暖水向赤道辐合,赤道平均温跃层加深;负异常时,暖水辐散,赤道平均温跃层上升。PC2存在一定的季节变化,表现为冬季上升,夏季下降,这是造成拉尼娜季节锁相的重要因素。2020年冬季和2021年冬季,PC2出现均极大值,此时拉尼娜强度也达到了最大。此外,对20 ℃等温线深度数据去趋势处理后再进行EOF分析,得到的空间分布和时间序列与图7类似,这说明影响20 ℃等温线深度的主要因素与长期趋势(如全球变暖)之间没有明显的相关关系。
3 总结和讨论
“三重”拉尼娜事件在历史上并不多见,但相比单次拉尼娜事件,其影响会更加剧烈。随着全球变暖,多重拉尼娜事件可能会更加频发[42]。前人重点关注了多重拉尼娜的机制及其对气候的影响,但对多重拉尼娜期间各重间差异的关注很少。在各重拉尼娜期间,海洋和大气会发生不一样的变化,厘清这些差异也有助于增加对多重拉尼娜过程及机制的理解,进而提升对其预报的能力。本文对比了2020—2023年“三重”拉尼娜期间海面温度、次表层海温以及风场的时空变化特征,得到如下结论。
1)2020年(第一重)拉尼娜相对最强、持续时间最长;2021年(第二重)拉尼娜的冷中心位置偏东,呈“东部型”;2022年(第三重)拉尼娜强度相对较弱、持续时间最短,冷中心的位置偏中部,呈“中部型”。纬向风异常与海面温度异常耦合,但前者的强度及位置在各重拉尼娜间的差异较小。
2)在“三重”拉尼娜期间,次表层海温异常中心位置与海面温度异常一致。东传开尔文波和温跃层深度在各重拉尼娜期间的差异较小。暖水体积及其增长速率影响了“三重”拉尼娜强度,暖水的经向辐合与辐散造成了“三重”拉尼娜事件的季节锁相。
对厄尔尼诺和拉尼娜这样复杂的气候影响进行监测和预报,目前还只是初级阶段,尤其是对多重拉尼娜的预测,还需要对其开展更深入的机理性分析。由于至今还没有建立起全球的气候安全网,因此实现对厄尔尼诺和拉尼娜的精准预报还需很长一段时间,这也需要更深层次地去理解拉尼娜的发生机制,加深对ENSO循环的认识。因此,未来需要更好地理解气候系统的各个方面,加强全球气候合作和应对能力,以应对气候变化带来的挑战和机遇。