
0 引言
海啸是一种极具破坏性的自然灾害,通常在地震、山体滑坡、火山爆发和陨石撞击时被引发[1] 。海啸波是一种十分特殊的波浪,其波长最大可以达到数百公里,传播速度可达1 000 km/h,从远海传播至近岸的过程中,受地形影响和波浪浅化作用,波长骤减而波高陡增,可形成10 m高的巨浪,而在其破碎时所释放的巨大能量会摧毁堤岸、淹没土地,甚至危及人类生命[2-3]。有研究表明,热带和亚热带地区存在大量珊瑚礁,典型的珊瑚礁地形主要由较陡的礁前斜坡和延伸向岸滩且坡度较缓的礁坪组成[4]。当波浪从开阔海域传播到近岸珊瑚礁边缘时,大部分波浪能量会通过礁前斜坡的反射、礁缘附近的波浪破碎以及礁坪上的底摩擦耗散掉[5⇓-7]。但是,随着全球变暖,海平面上升,一些珊瑚礁海岸地区,尤其是低洼的环礁岛地区,面临飓风和海啸引发的极端巨浪和波浪的威胁日益增加,仅靠珊瑚礁等自然屏障已无法保护沿海地区不受自然灾害的影响[8],需要在海岸附近布置海堤或淹没式人工结构物等人工屏障以有效保护海岸。由于孤立波和海啸波在波形和水动力特性方面存在相似性[9],近些年来一直被用于模拟海啸与海岸工程之间的相互作用。 LIU等[10]通过物理模型实验系统分析了孤立波爬高和垂直障碍物之间的相互作用。张金牛等[11]通过数值波浪水槽系统分析了在斜坡式海堤上相对波高和相对超高对孤立波越浪量的影响。张良斌等[12]基于不可压缩雷诺平均Navier-Stokes方程和k-ε方程的两相流数值模型,系统研究了风对孤立波海堤越浪特性的影响。CHANG等[13]利用粒子图像测速仪和数值模型,基于k-ε湍流模型的不可压缩雷诺平均Navier-Stokes方程,对孤立波和淹没式矩形潜堤之间的相互作用进行了实验和数值研究。LIN等[14]利用粒子图像测速仪对孤立波与水下垂直板相互作用诱发的涡流脱落过程进行了实验研究。韩新宇等[15]基于格子Boltzmann法数值模拟了孤立波与矩形潜堤和半圆形潜堤的相互作用过程,并对水流分离、涡流脱落及波浪破碎进行了研究。TOUHAMI等[16]利用 COULWAVE 模型研究了淹没式人工结构物的峰顶深度对孤立波爬高的影响。YAO等[17]通过开展一系列模型实验,系统研究了孤立波在不同岸礁地形上的传播变形和爬高过程。肖理等[18]通过实验和数值模拟研究了孤立波分别在有、无礁冠的岸礁上传播的水动力特性及对直墙的作用。FU等[19]采用非静压模型NHWAVE,研究了不同有效波高和礁坪水深对非规则波在岸礁上传播时的礁坪增水、波生流和波面沿程波高等的影响。王旭等[20-21]基于非静压模型NHWAVE,分别系统研究了人工采砂坑和礁坪透水层对规则波和亚重力波岸礁水动力特性的影响。AI等[22]使用非静压模型的两种迭代方式求解压力修正项的Poisson方程,采用从浅水到深水多个实验案例对模型精度进行验证,两种迭代方式的计算结果吻合度均较好。
相较于传统露出水面的离岸堤,淹没式人工结构物(如潜堤)可以保持水流向陆地,无损于视觉景观。而关于礁前斜坡上的淹没式人工结构物对孤立波在冲击岸礁时的水动力特性影响的研究较少。为弥补该领域研究的不足,基于非静压模型,本文系统研究了淹没式人工结构物影响下的孤立波在冲击岸礁时的传播变形及爬高过程的水动力特性,重点讨论了入射波高、礁坪水深、礁前斜坡坡度及人工结构物的坡度和峰宽等因素的影响。
1 数值模型
1.1 控制方程
基于MA 等[23]开发的非静压模型NHWAVE建立波浪数值水槽,求解雷诺平均的Navier-Stokes方程,其连续性方程和动量守恒方程如下:
+ + + =0
+ + + =Sh+Sp+Sτ+Sc
D=h(x, y, t)+η(x, y, t)
U=(Du,Dv,Dw)
$F=\left(D u u+\frac{1}{2} g \eta^{2}+g h \eta, D u v, D u w\right)$
G=(Duv,Dvv+ gη2+ghη,Dvw)
H=(uω,vω,wω)
式中:t为时间,x、y、z为笛卡尔坐标的三个方向,u、v、w代表x、y、z三个方向上的速度分量,Sh代表静压项,Sp代表动压项,Sτ代表湍流应力项,Sc代表底摩擦项,ω代表σ坐标系下的速度,h为静止水深,p为压力,ρ为水密度,g为重力加速度,η为自由液面高程。
式(2)中各源项的计算公式如下所示:
Sh=
Sp=
Sτ=
Sc=DFc= Cd|u|u
式中:Fc为摩擦力,Cd为底摩擦系数。
1.2 湍流模型
采用标准的k-ε湍流模型来计算湍流黏性系数,其控制方程如下所示:
$\frac{\partial D k}{\partial t}+\nabla \cdot 2(D u k)=\nabla \cdot\left[D\left(v+\frac{v_{\mathrm{t}}}{\sigma_k}\right) \nabla k\right]+D\left(P_{\mathrm{s}}-\varepsilon\right)$
$\begin{gathered}\frac{\partial D k}{\partial t}+\nabla \cdot(D u \varepsilon)=\nabla \cdot\left[D\left(v+\frac{v_{\mathrm{t}}}{\sigma_{\varepsilon}}\right) \nabla \varepsilon\right]+ \\ \frac{\varepsilon}{k} D\left(C_{1 \varepsilon} P_{\mathrm{s}}-C_{2 \varepsilon} \varepsilon\right)\end{gathered}$
vt=Cμ
k=
ε=
式中:vt为湍流运动黏度;k是体积平均的湍流动能;U'表示流体速度的脉动部分, 是脉动速度的均方根; ε是湍流耗散率;l为湍流长度尺度;Ps代表剪切力;Δ为哈密顿算子;σk、σε、C1ε、C2ε、Cμ是湍流相关经验系数,参考文献[24]取值为σk=1.0,σε=1.3,C1ε=1.44,C2ε=1.92,Cμ=0.09。
2 数值验证
2.1 孤立波在岸礁上的传播
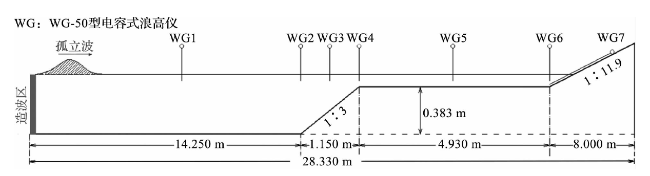
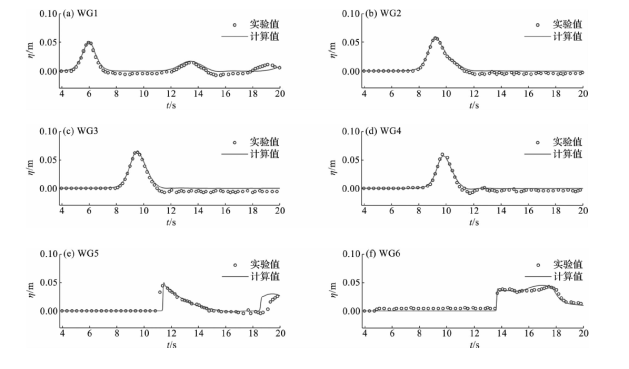
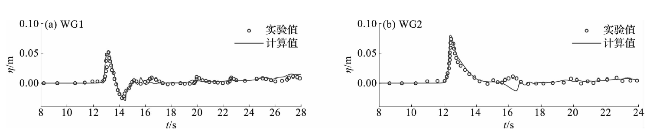
图2 无人工结构物岸礁上不同位置测点自由液面的时间序列对比验证Fig.2 Time series validation of water elevation at different wave gauges on shore reefs without artificial structure |
2.2 孤立波在潜堤地形上的传播
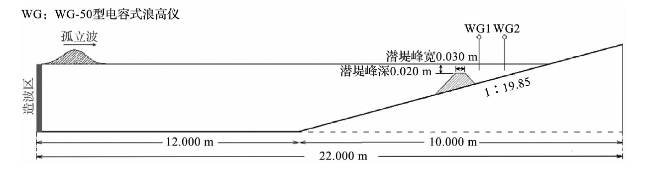
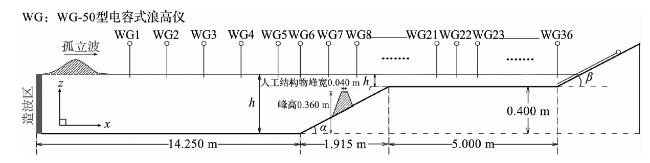
为验证非静压模型在含有潜堤地形上具有计算孤立波传播变形的能力,与TOUHAMI等[26]的物理实验结果进行对比。二维数值水槽计算域布置与物理实验模型布置相同(图4)。数值水槽长22.000 m,以12.000 m处为起点,布置一个1∶19.85的倾斜斜坡直至终点,斜坡中间安装梯形潜堤,潜堤两侧的坡度均为1∶2.5,潜堤峰宽为0.030 m,潜堤峰深为0.020 m,采用2个浪高仪布置在潜堤下游,分别距离造波机15.250 m和15.600 m。数值计算域水平方向网格大小为dx=0.01 m,垂直方向共划分30层网格,其中入射波高H=0.120 m,静水深h=0.300 m。通过沿程不同位置处测点自由液面时程曲线的实验值与计算值的对比(图5)可知,数值计算结果与物理实验结果吻合较好。
3 工况设置
共设置了36种工况,分别讨论了入射波高(以入射波高比H/h表示)、礁坪水深(hr)、人工结构物坡度(以cot &表示)、人工结构物峰宽(Wp)以及礁前斜坡坡度(以cot α表示)等因素对岸礁上孤立波水动力特性的影响,具体的工况设置见表1。
表1 数值模拟工况表Tab.1 Parameter setup of numerical simulation |
| 工况 | 入射波高/m | 礁坪 水深/m | 结构物 坡度 | 结构物 峰宽/m | 结构物 峰高/m | 礁前斜坡 坡度 | 工况 | 入射波高/m | 礁坪 水深/m | 结构物 坡度 | 结构物 峰宽/m | 结构物 峰高/m | 礁前斜坡 坡度 |
|---|---|---|---|---|---|---|---|---|---|---|---|---|---|
| A1 | 0.063 45 | 0.040 | 1∶5 | D4 | 0.105 75 | 0.080 | 1∶1.25 | 0.040 | 0.360 | 1∶5 | |||
| A2 | 0.084 60 | 0.040 | 1∶5 | D5 | 0.105 75 | 0.100 | 1∶1.25 | 0.040 | 0.360 | 1∶5 | |||
| A3 | 0.105 75 | 0.040 | 1∶5 | E1 | 0.105 75 | 0.040 | 1∶0.25 | 0.040 | 0.360 | 1∶5 | |||
| A4 | 0.126 90 | 0.040 | 1∶5 | E2 | 0.105 75 | 0.040 | 1∶0.75 | 0.040 | 0.360 | 1∶5 | |||
| A5 | 0.148 05 | 0.040 | 1∶5 | E3 | 0.105 75 | 0.040 | 1∶1.75 | 0.040 | 0.360 | 1∶5 | |||
| B1 | 0.063 45 | 0.040 | 1∶1.25 | 0.040 | 0.360 | 1∶5 | E4 | 0.105 75 | 0.040 | 1∶2.25 | 0.040 | 0.360 | 1∶5 |
| B2 | 0.084 60 | 0.040 | 1∶1.25 | 0.040 | 0.360 | 1∶5 | F1 | 0.105 75 | 0.040 | 1∶1.25 | 0.000 | 0.360 | 1∶5 |
| B3 | 0.105 75 | 0.040 | 1∶1.25 | 0.040 | 0.360 | 1∶5 | F2 | 0.105 75 | 0.040 | 1∶1.25 | 0.020 | 0.360 | 1∶5 |
| B4 | 0.126 90 | 0.040 | 1∶1.25 | 0.040 | 0.360 | 1∶5 | F3 | 0.105 75 | 0.040 | 1∶1.25 | 0.060 | 0.360 | 1∶5 |
| B5 | 0.148 05 | 0.040 | 1∶1.25 | 0.040 | 0.360 | 1∶5 | F4 | 0.105 75 | 0.040 | 1∶1.25 | 0.080 | 0.360 | 1∶5 |
| C1 | 0.105 75 | 0.000 | 1∶5 | G1 | 0.105 75 | 0.040 | 1∶3 | ||||||
| C2 | 0.105 75 | 0.020 | 1∶5 | G2 | 0.105 75 | 0.040 | 1∶4 | ||||||
| C3 | 0.105 75 | 0.060 | 1∶5 | G3 | 0.105 75 | 0.040 | 1∶6 | ||||||
| C4 | 0.105 75 | 0.080 | 1∶5 | G4 | 0.105 75 | 0.040 | 1∶7 | ||||||
| C5 | 0.105 75 | 0.100 | 1∶5 | H1 | 0.105 75 | 0.040 | 1∶1.25 | 0.040 | 0.360 | 1∶3 | |||
| D1 | 0.105 75 | 0.000 | 1∶1.25 | 0.040 | 0.360 | 1∶5 | H2 | 0.105 75 | 0.040 | 1∶1.25 | 0.040 | 0.360 | 1∶4 |
| D2 | 0.105 75 | 0.020 | 1∶1.25 | 0.040 | 0.360 | 1∶5 | H3 | 0.105 75 | 0.040 | 1∶1.25 | 0.040 | 0.360 | 1∶6 |
| D3 | 0.105 75 | 0.060 | 1∶1.25 | 0.040 | 0.360 | 1∶5 | H4 | 0.105 75 | 0.040 | 1∶1.25 | 0.040 | 0.360 | 1∶7 |
4 结果与分析
4.1 水动力特性分析
图7展示了孤立波在无人工结构物和有人工结构物的岸礁上传播时,不同时刻的速度云图对比,其中无人工结构物的岸礁采用A3工况,有人工结构物的岸礁采用B3工况。波浪在远海端传播(t=7.10 s)时,在数值计算域内呈现出一个标准的孤立波波形,由高速带、中速带和低速带组成。当孤立波传至人工结构物(t=8.40 s)时,与人工结构物前的低速水体发生质量和动量交换,并在此处形成复杂的涡流。相比在无人工结构物岸礁上的波浪,通过人工结构物的波浪已经不再是孤立波的波形。随后孤立波发生破碎(t=8.80 s),形成近似于锯齿状的涌浪沿礁传播(t=10.16 s、t=13.40 s)。
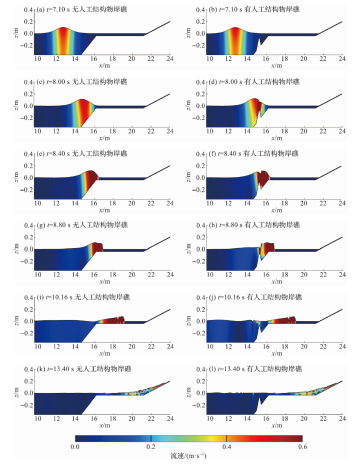
图8展示了沿程8个代表性位置测点处,孤立波在无人工结构物和有人工结构物的岸礁上传播时,不同时刻的自由液面时间序列对比。入射波在未受到人工结构物影响时(x=10.000 m),两种情况下的波形基本吻合。当波浪到达人工结构物坡脚(x=14.250 m、x=14.900 m)时,有人工结构物岸礁的入射波主波尾部开始出现次峰,说明人工结构物开始对其产生轻微影响。当入射波主峰经过人工结构物峰顶(x=15.200 m、x=15.400 m)时,无人工结构物岸礁的波浪还存在孤立波的形态,而通过人工结构物的波浪已经破碎,不再是孤立波波形,产生较大次峰,说明人工结构物对波浪传播变形产生了较大影响。两种情况下,波浪破碎后沿程传播阶段的自由液面基本一致(x=16.150 m、x=18.500 m、x=21.165 m),但存在较小的相位差,说明人工结构物降低了波浪沿程传播的流速,有人工结构物岸礁上波浪的传播相较无人工结构物岸礁上的滞后。
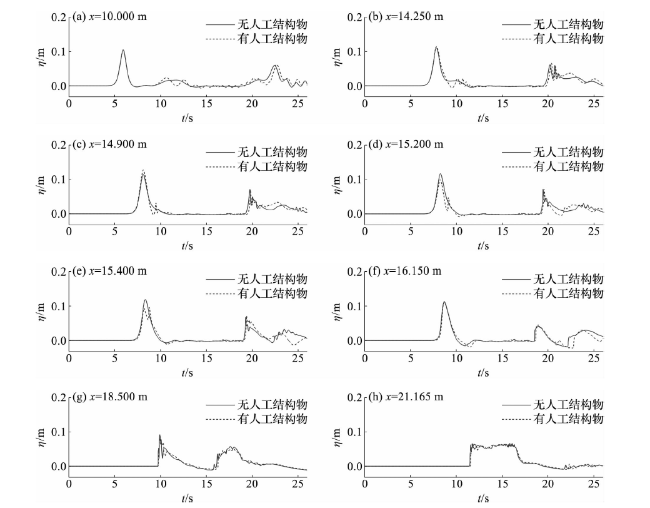
图9展示了无量纲化最大波高Hi/H(Hi为沿程各测点处的最大波高,H为入射波高)的空间分布。波浪传播至礁前斜坡时,随着水深的减小,波浪发生浅水变形,波高逐渐增大。由于孤立波的波长无限长,在安装人工结构物的岸礁上,孤立波波峰到达人工结构物之前,孤立波前半部分会由于人工结构物的反射作用与波峰叠加,使得增加的波幅比无人工结构物岸礁上的大。所以,孤立波受存在人工结构物岸礁地形的浅化作用更明显。在人工结构物前,波浪浅水变形达到极限,然后在人工结构物峰顶或峰后发生波浪破碎,使得波高急剧减小,进入礁坪后继续发生浅水变形。即在有人工结构物的岸礁,波浪会提前发生卷破。
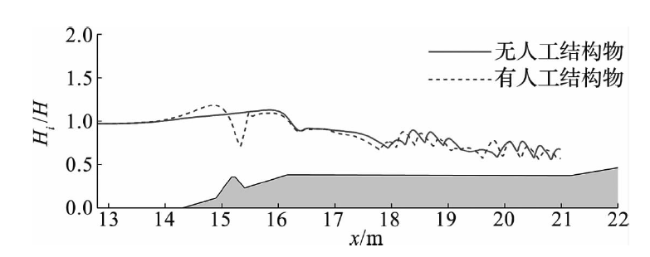
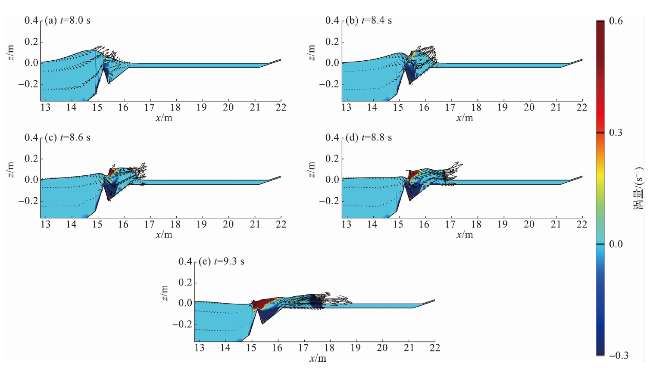
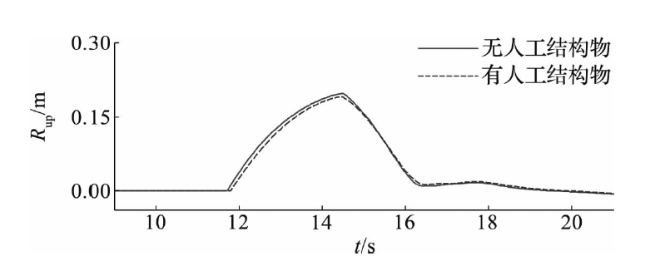
图10展示了孤立波在有人工结构物岸礁地形上传播的涡量分布。由图可见,在人工结构物顶部出现正涡,而在人工结构物背部主要分布负涡。这种现象同时伴随着高速流体的分布(图7j、7k),这是导致结构物被冲毁的重要原因之一。当孤立波传播到人工结构物(t=8.0 s)时,结构物背水面上方有小范围负涡依附于结构物上。随着孤立波继续沿程传播(t=8.4 s、t=8.6 s、t=8.8 s),小范围负涡持续发展成马蹄状涡且向岸方向移动壮大,结构物背水面下方出现负涡,上方出现正涡,环形矢量逐渐明显(t=9.3 s)。与此同时液面上方逐渐有正涡和小范围负涡出现,且正涡逐渐发展充分。在人工结构物位置形成的复杂涡结构使得此位置处的自由液面发生畸变,且耗散了更多的孤立波能量。因此,有人工结构物岸礁上的波浪爬高略小于无人工结构物岸礁(图11)。值得注意的是,涡量大是形成冲刷的主要原因。因此,当反射流与主流交汇时,在人工结构物表面产生的强烈剪切作用容易导致此交界段受到较为严重的冲刷。
4.2 最大波高沿程的空间分布分析
本节分别分析了入射波高、礁坪水深、人工结构物坡度、人工结构物峰宽和礁前斜坡坡度对孤立波最大波高沿程空间分布的影响。
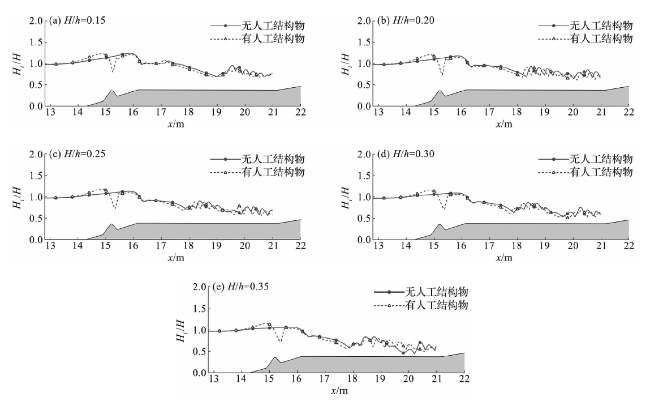
图12 有、无人工结构物时不同入射波高下最大波高的沿程分布Fig.12 Along-track distributions of maximum wave heights along shore reefs with and without artificial structure under different incident wave heights |
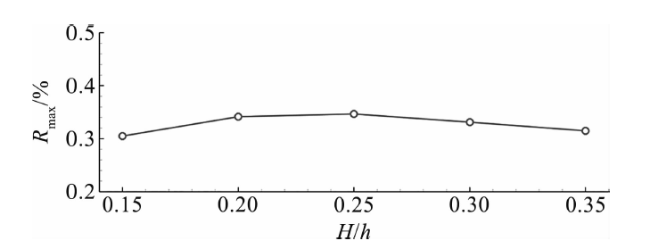
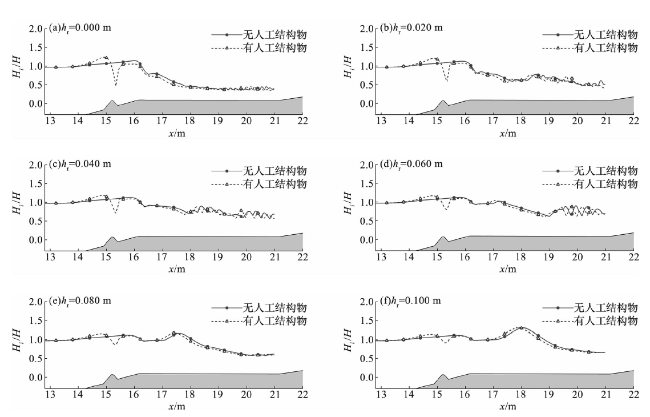
图14 有、无人工结构物时不同礁坪水深下最大波高的沿程分布Fig.14 Along-track distributions of maximum wave heights along shore reefs with and without artificial structure under different reef flat water depths |
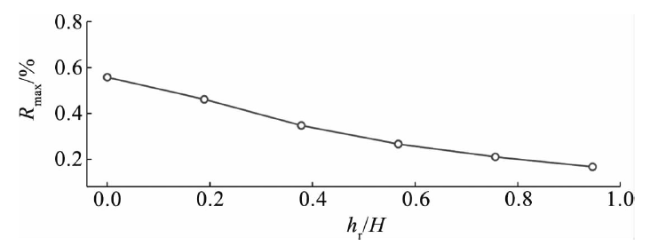
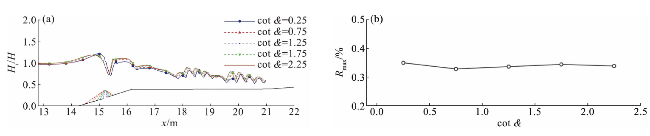
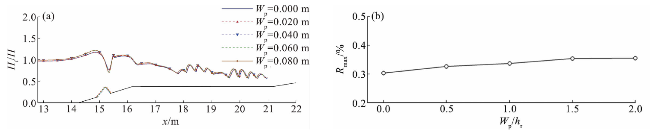
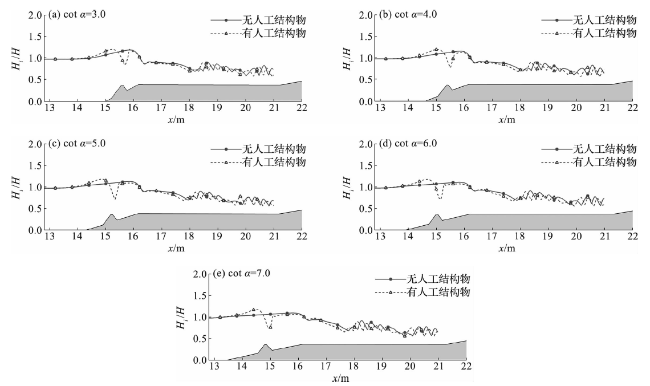
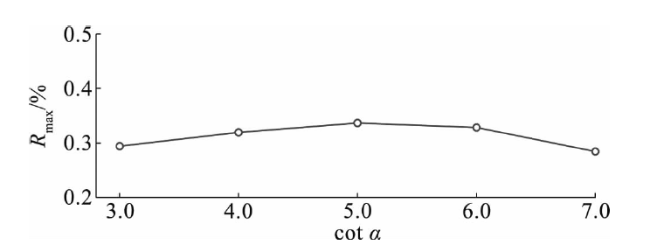
图18 有、无人工结构物时不同礁前斜坡坡度下最大波高的沿程分布Fig.18 Along-track distribution of maximum wave heights along shore reef with and without artificial structure under different reef front slope gradients |
4.3 孤立波反射系数分析
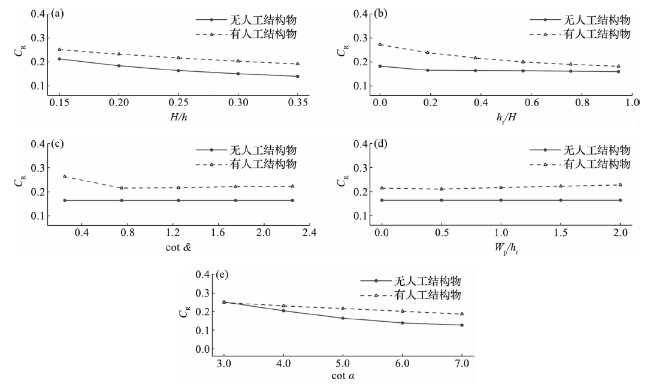
本节分别展示了入射波高、礁坪水深、人工结构物坡度、人工结构物峰宽和礁前斜坡坡度对孤立波反射系数(简称反射系数, CR)的影响。总体上看,有人工结构物岸礁的反射系数均大于无人工结构物岸礁的。由图20a可知,无论是否存在人工结构物,岸礁上的反射系数均随着入射波高的增大而减小,且随着入射波高的增大,两种反射系数的差值缓慢增大,到H/h>0.25时,差值达到稳定,约为0.05。由图20b可知,在两种情况下,岸礁上的反射系数在总体上均随着礁坪水深的增加而减小,且两种反射系数的差值也逐渐减小,这是因为随着礁坪水深的增加,波浪受人工结构物的影响逐渐降低。图20c展示了人工结构物坡度对波浪反射系数的影响。当坡度接近直角时,人工结构物的反射作用最大,在其他坡度下,反射系数大幅下降且趋于平稳。图20d展示了反射系数随人工结构物峰宽的增加而缓慢增加。图20e展示了人工结构物安装在不同坡度的礁前斜坡上时,反射系数的变化。从图中可以看出,随着礁前斜坡的坡度变缓,波浪反射系数逐渐下降,两种情况下反射系数的差值逐渐增大,到cot α>6时逐渐稳定在0.06左右。
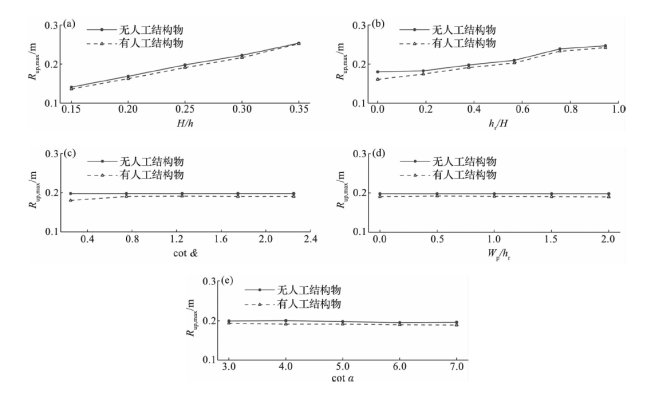
4.4 波浪爬高分析
本节系统分析了入射波高、礁坪水深、人工结构物坡度、人工结构物峰宽以及礁前斜坡坡度对孤立波最大波浪爬高(Rup,max)的影响。由图21可知,在不同的工况下,人工结构物的存在均会降低最大波浪爬高。然而,随着入射波高的增大,这种降低的幅度逐渐减小。这是因为人工结构物耗散的能量比例随着入射波高的增加而减小(图21a)。礁坪水深hr=0.000 m 时,人工结构物导致的最大波浪爬高的减小效果最为显著,随着水深的增加,减小的幅度逐渐减小,在hr超过0.060 m(hr/H=0.6)时趋于稳定(图21b)。这是由于水深的增加减弱了波浪与人工结构物的相互作用,从而减少了能量的耗散。图21c表明,当人工结构物坡度逐渐变缓时,波浪爬高的减幅逐渐减小,当cot &>1.25 时,最大波浪爬高趋于稳定。从图21d和21e可以看出,人工结构物峰宽和礁前斜坡坡度的变化对最大波浪爬高几乎没有影响。
5 结论
本研究基于非静压模型NHWAVE系统分析了孤立波在安装淹没式人工结构物的岸礁上传播演变的过程,并与未安装人工结构物岸礁工况进行对比,得到如下主要结论。
1)孤立波到达人工结构物前坡脚区域时,波形不再对称,波幅达到峰值。孤立波在岸礁上传播达到浅水变形条件时,随着礁前斜坡上的水深变浅,波高沿程增大,波陡变大,波峰变尖,直至波浪不能维持孤立波波形而破碎。人工结构物的存在会导致孤立波在人工结构物前的波高增幅较大,而后波浪会在人工结构物峰顶或峰后附近发生破碎,局部波高急剧减小,在礁坪上的完全破碎点也提前,从而达到消浪的目的。
2)人工结构物对波浪的反射系数分别随着入射波高和礁坪水深的增大而减小。改变人工结构物坡度和峰宽对波浪的反射增幅有一定影响,但效果十分有限。随着礁前斜坡坡度变缓,淹没式人工结构物对波浪的反射系数减小。
3)最大波浪爬高随着入射波高的增大而增大的效果显著,并且呈现出强线性趋势。在水深条件不变的情况下,无人工结构物岸礁的最大波浪爬高比有人工结构物岸礁的大,说明人工结构物的存在对波浪的爬高有阻碍作用。随着礁坪水深的增大,人工结构物对最大波浪爬高的减幅逐渐减小并趋于稳定。改变人工结构物峰宽对最大波浪爬高降幅的影响不大。另外,在不同礁前斜坡坡度上安装人工结构物对波浪的最大爬高降幅影响也不大。