Generation and dissipation of near-inertial internal waves under the regulation of seamount width

  • WANG Wenbo , 1 ,
  • XIE Xiaohui , 1, 2, 3, *
Expand
  • 1. Second Institute of Oceanography, MNR, Hangzhou 310012, China
  • 2. School of Oceanography, Shanghai Jiao Tong University, Shanghai 200030, China
  • 3. Southern Marine Science and Engineering Guangdong Laboratory (Zhuhai), Zhuhai 519000, China

Received date: 2024-10-02

  Revised date: 2025-04-09

  Online published: 2025-08-05

Abstract

The interaction between deep-ocean geostrophic current and seamounts can generate near-inertial internal waves (NIWs). While the intensity of these waves relates to the seamount height, its dependence on seamount width remains elusive. This study employs a two-dimensional, non-hydrostatic numerical model based on MITgcm to investigate the interaction of geostrophic current with deep-sea seamounts and examine how differing seamount widths influence the generation and dissipation of NIWs. Our results demonstrate that topographic forcing triggers robust nonlinear wave-wave interactions along the summit edges on the downstream flank of the seamount. This process generates energetic near-inertial internal waves that radiate away and develop, facilitating energy transfer from the geostrophic mean flow to the NIWs. For a fixed seamount height, narrower seamounts induce stronger near-inertial waves, characterized by more rapid wave development and decay. Moreover, the downstream flank exhibits significantly enhanced vertical shears within the near-inertial internal waves, driving greater turbulent dissipation compared to the upstream flank. Therefore, our findings highlight that, in addition to seamount height, seamount width is also a critical factor governing the generation and subsequent evolution of near-inertial internal waves.

Cite this article

WANG Wenbo , XIE Xiaohui . Generation and dissipation of near-inertial internal waves under the regulation of seamount width[J]. Journal of Marine Sciences, 2025 , 43(2) : 11 -18 . DOI: 10.3969/j.issn.1001-909X.2025.02.002

0 引言

海洋内波是发生在层结稳定海水内部的一种波动,以约化重力和科氏力的合力为恢复力,频率介于惯性频率f(f=2Ωsinφ,Ω为地球的角速度,φ为纬度)和浮力频率N之间。在海洋内波谱中,惯性频率附近往往会出现显著的峰值,这些内波被称为近惯性内波。近惯性内波具有强切变特征,能使海洋混合层加深30%,能量向小尺度湍流运动串级、耗散,是上层海洋和深海海洋湍流混合的主要贡献者[1-2]。因此,理解近惯性内波的产生、传播和演变对于估算全球海洋能量收支至关重要。另外,近惯性内波在产生强混合的同时,还能够调节营养物的分布,影响海洋生物地球化学过程[3]
近惯性内波的生成机制复杂,包括但不限于风强迫[4-5]、非线性波-波相互作用[6](如参数亚谐波不稳定性)、锋面强迫[7]以及流与地形的相互作用等[8-10]。风强迫一直被认为是海表近惯性内波生成的主要驱动力,而最近的数值模拟[11-13]发现,全球风生近惯性内波的总能量约为0.4 TW,其中75%~85% 耗散在了150 m以浅的上层海洋中,只有很少量进入1 000 m以深的深海海洋,并且这些预测得到了现场观测[14]的支持。最新的研究认为,平均流是深海海洋中近惯性内波的可能能量来源,当低频流流经粗糙地形时,地转平衡被打破,使得能量持续向近惯性内波转移[15-16]。为了表征流与地形相互作用的不同状态,NIKURASHIN等[8]引入了一个无量纲参数——陡度J(J=N·h/U,h为地形高度,U为平均流的流速)。J≪1,表示亚临界状态,此时地形与流相互作用产生的波基本上是线性的;J≈1和 J≫1,表示临界和超临界状态,此时产生的波之间的非线性关系变得重要,并因地形产生流阻塞效应[17]。NIKURASHIN等[8]还引入了另一个无量纲参数——地形宽度χ (χ=U·k/N,k为底部地形的波数),用来判断背风波是否能辐射出去(自由传播)。若χ∈(f/N,1),背风波能辐射出去;若χ∉(f/N,1),背风波不能辐射出去。k值越大(海山越窄), χ值相应也越大。NIKURASHIN等[8]通过二维理想模型揭示了地转流在粗糙地形上产生背风波,背风波破碎激发产生近惯性内波的过程。ZEMSKOVA等[9]发现,无论χ是否在背风波的辐射范围内,近惯性内波都会产生,并且湍流耗散率也是相当的。观测证实,在距离海山顶部1 000 m的范围内,近惯性内波的能量会明显增强[18-20]。XIE等[21]基于西太平洋海山锚系数据,研究发现地转流流经大尺度非辐射地形(平顶海山)时产生强近惯性内波,并通过二维非静力理想数值模型再现了该内波的生成过程:频率为[0, f, f]的三波之间的非线性相互作用可能将能量从平均流传递到近惯性内波,从而有效促进了大尺度地形上地转流的能量衰减。尽管之前的研究已经提出了地转流与大尺度非辐射地形相互作用产生内波的机制[22-23],但尚未就地形宽度χ对内波的影响展开探究。本文利用理想的垂直二维模型,分析了非辐射、大尺度地形限制下,地形宽度对近惯性内波的影响。

1 数值模型设置与数值实验介绍

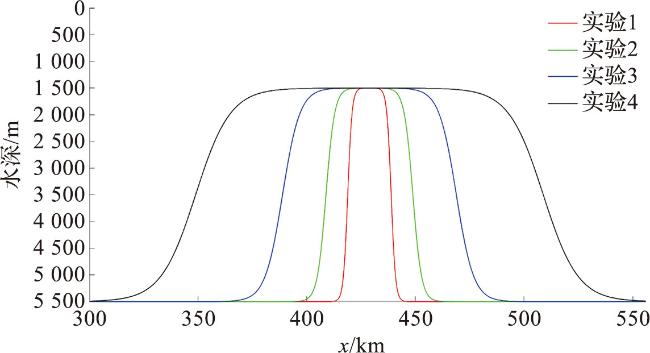
本文采用麻省理工学院开发的二维非静力模型(MITgcm),研究了地转流与海山的相互作用。模型研究区宽度和高度分别设置为1 000 km和5 500 m,水平分辨率Δx=100 m,垂直分辨率Δz=10 m;局地惯性频率和背景浮力频率分别设置为f=5×10⁻⁵ rad·s-1N=1×10⁻³ s-1;背景垂直粘度Av和扩散系数Kv设为1×10⁻³ m2·s-1;水平粘度AH和扩散系数KH设为1×10⁻² m2·s-1。在模型的经向动量方程中加入科氏力项(f·Ug),充当在所有深度上与地转流维持平衡所需的正压梯度力,得到流向向右、上下均一的地转流,流速Ug=0.01 m·s-1。模型从静止状态初始化,共模拟15 d。
深海海山区是研究矿产资源分布和海洋动力过程的热点区域,全球已发现的大型海山有一半以上位于西太平洋区域,采薇海山为西太平洋一个典型的大型平顶海山。XIE等[21]通过对采薇海山的观测和数值模拟,研究了地转流与海山相互作用产生近惯性内波的过程。本文基于采薇海山地形,采用双曲正切函数配置理想的平顶海山(图1),设置4个不同χ的数值实验(具体参数设置见表1),海山高度设为4 000 m,J=400(≫1)。
图1 数值实验地形示意图

Fig.1 Schematic diagram of the topography in numerical experiments

表1 数值实验参数

Tab.1 The parameters in numerical experiments

实验
序号
J 海山
高度/m
海山底部
宽度/km
海山顶部
宽度/km
χ
1 400 4 000 30 15 2×10⁻³
2 400 4 000 60 30 1×10⁻³
3 400 4 000 120 60 5×10⁻⁴
4 400 4 000 240 120 2.5×10⁻⁴

2 结果

2.1 近惯性内波的产生与演变

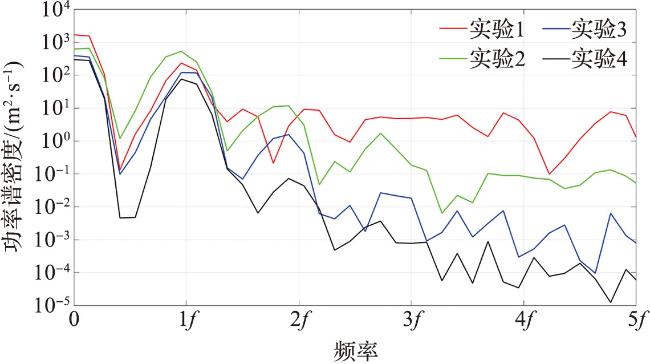
为了避免模型运行初期的瞬时扰动,选取了海山上方200 m(近惯性能量较强)的区域,2~9个惯性周期(Tf=2π/f)的数据进行功率谱分析(图2)。在图中可以看到,各数值实验在惯性频率为f时均出现明显的峰值,表明当地转流流过海山时,海山上方都产生了近惯性内波。随着海山宽度减小(χ值变大),低频流和近惯性内波的强度都有所增加,当海山宽度减小到一定程度时,近惯性内波的强度不再增加,而高频谐波的强度显著增加。
图2 2Tf~9Tf时间段内海山上方200 m范围内平均功率谱密度

Fig.2 The averaged power spectral density over the region within 200 m above the seamount at the 2Tf~9Tf periods

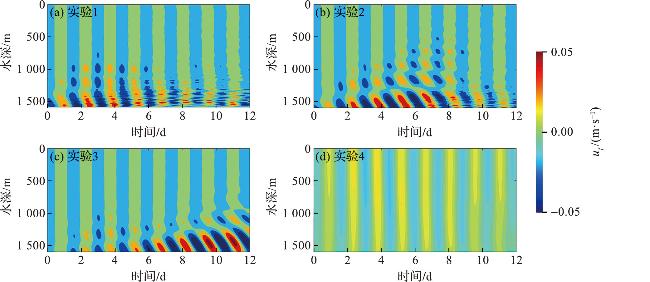
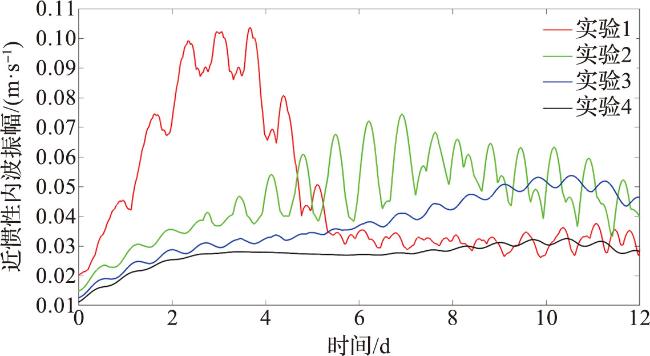
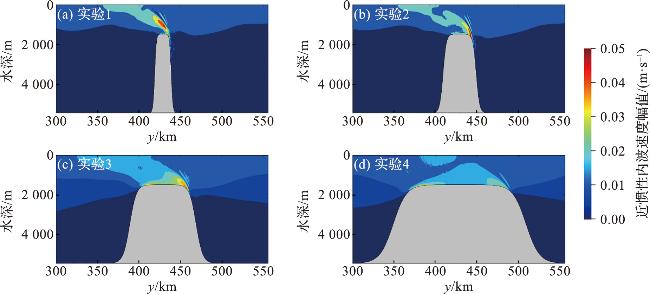
为研究海山周围近惯性内波的产生与传播,本文采用二阶巴特沃斯滤波,先使用截止周期为3 d的低通滤波器从原始速度场中提取低频速度([U,V]),再使用带通滤波提取出近惯性内波的速度分量([uf,vf]),截止频率设置为[0.8,1.2]f (f=2π/34.9)。滤波得到海山上方近惯性内波纬向速度的时间演化过程如图3所示。虽然模型在初始条件中未设置近惯性流,但在最初的24 h内,由于各实验对海山上方地转流的初始调整,弱正压惯性振荡流迅速发展,并扩展到整个海山上方区域(图3)。实验1~实验3,海山底部均出现向上(能量)传播的近惯性内波,增强了其在近底部的纬向速度uf。实验1中,从模拟一开始,底部就出现了近惯性内波增强的现象(图3a)。实验4,整个模拟阶段都以弱正压惯性振荡流为主(图3d)。实验1和实验2中,6~12 d期间,近惯性内波的强度明显减弱;实验3中,到第12天时,近惯性内波仍在不断发展增强。上述结果表明,随着海山宽度减小,近惯性内波的产生更迅速,衰减也更快。
图3 海山上方近惯性内波的纬向速度uf随时间的演变过程

Fig.3 Temporal evolution of the zonal velocity uf of near-inertial internal waves above the seamount

图4展示了各实验中近惯性内波振幅的时间演变过程。实验4中,第12天时,近惯性内波振幅几乎达到饱和(图4中黑线);实验1中,近惯性内波振幅在第3天达到最大,之后随时间推移逐渐衰减,最终振幅大小与实验4相近;而实验2和实验3中,近惯性内波振幅分别在第7天和第10天达到最大。在模拟的前期,近惯性内波的强度随海山宽度减小而不断增强,其中最窄海山产生的近惯性内波的强度增加幅度明显高于其他海山,一段时间后,强度迅速减小。从振幅极值来看,随着海山宽度减小,近惯性内波强度明显增强。
图4 近惯性内波振幅的时间演变

Fig.4 Temporal evolution of the near-inertial wave amplitude

2.2 近惯性内波的空间分布与非线性波-波相互作用
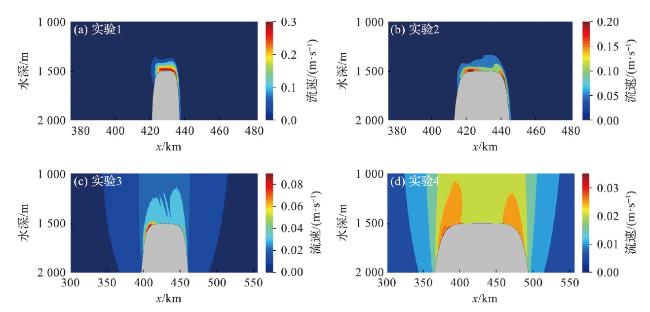
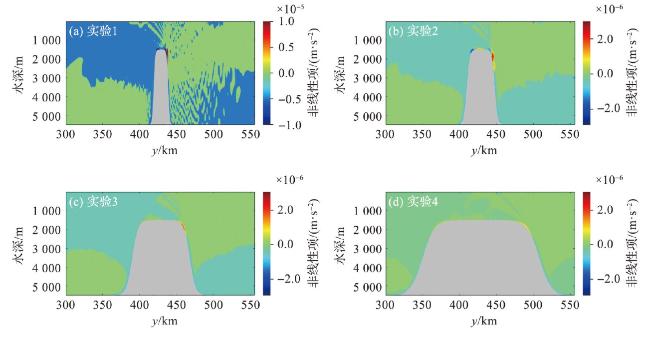
图5给出了各实验中,在两个惯性周期(4Tf和5Tf)内,近惯性内波速度幅值Uf= u f 2 + v f 2跨海山剖面分布的情况。图中显示,近惯性内波从海山顶部向上传播千米以上,可以直达海表。实验4中,近惯性内波速度幅值在海山两侧呈对称性分布,在海山顶上方的整块区域幅值都较大(图5d);而实验1~实验3中,近惯性内波从海山背流面顶部边缘处产生并向上传播,并且海山宽度越窄,能量越集中(图5a~5c)。
图5 两个惯性周期(4Tf和5Tf)内平均的近惯性内波速度幅值的空间分布

Fig.5 Spatial distribution of averaged near-inertial energy Uf over two inertial periods (4Tf and 5Tf)

先前的研究表明,在大尺度地形的近惯性内波的生成中,流动诱导的非线性项(-uf U x-uf U z)起了重要的作用[12],它被认为是地转流向近惯性内波进行能量输入的项。图6展示了各实验在两个惯性周期(4Tf和5Tf)内平均流速的跨海山剖面。图中显示,地转流经过大尺度地形时,由于障碍物的阻塞,在海山顶部边缘处产生了有限深度、相对高速(>0.01 m·s-1)的急流,海山宽度越小,急流的流速越大,流速梯度也越大。图7显示,各实验中,海山背流面顶部边缘的正非线性项值都很大,空间分布与能量(图5)相似,意味着该处是能量从地转流向近惯性内波输入的主要区域,即近惯性内波的产生区域。随着海山宽度逐渐减小,背流面的非线性项数值明显增大,与近惯性内波的流速与速度梯度变化一致(图6)。
图6 两个惯性周期(4Tf和5Tf)内的平均流速

Fig.6 Averaged velocity over two inertial periods (4Tf and 5Tf)

图7 两个惯性周期(4Tf和5Tf)内的平均非线性项空间分布

Fig.7 Spatial distribution of the averaged nonlinear term over two inertial periods (4Tf and 5Tf)

2.3 近惯性内波引起的湍流耗散

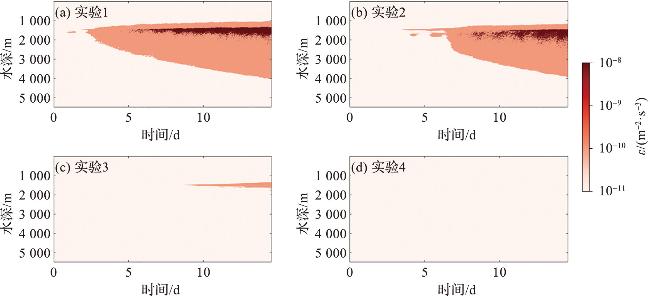
在湍流混合的研究中,常用Richardson数(简称Ri数,Ri=N2/S2,N2是背景层结值,S2=( u z)2,S2是垂直流速剪切的平方)判断内波是否发生破碎,Ri<0.25是发生剪切不稳定的必要条件之一。近惯性内波会产生较强的垂直切变,进而引发剪切不稳定。Ri数的空间分布(图8)验证了这一点。随着海山宽度减小,海山上方的Ri数显著减小,即剪切不稳定区向上方延伸,并且,剪切不稳定性在海山背流面强于迎流面。图9展示了湍流耗散率ε(ε=Av( u z)2+AH( u x)2 [24])的空间分布。从图中可见,ε值随海山宽度减小而增大,背流面既是近惯性内波产生及传播区,也是强湍流耗散区。实验1中的湍流耗散率比实验4的高了近3个量级,且海山迎流面和背流面的湍流混合明显不对称。近期研究表明,海山背流面的强湍流混合能够显著增强真光层的营养供给,为寡营养海区形成生态绿洲提供了有利条件[25]图10展示了海山周围水体中湍流耗散率ε随时间的演变过程。实验1中,湍流耗散随时间逐渐增强,强混合区从海山顶向海底延伸,最终达到近4 000 m的深处(图10a);实验2~实验4中,随着海山宽度的增加,湍流向深海的延伸迅速减弱(图10b~10d)。在真实大洋中遍布着大型海山,由地转流与海山相互作用诱发的近惯性内波导致的湍流混合,可能被显著低估。对南大洋的研究[26-28]发现,海山链能够起到阻尼地转流和中尺度涡旋的作用,而潜在的强湍流耗散对于估算全球深海湍流混合和全球海洋能量收支起着至关重要的作用。
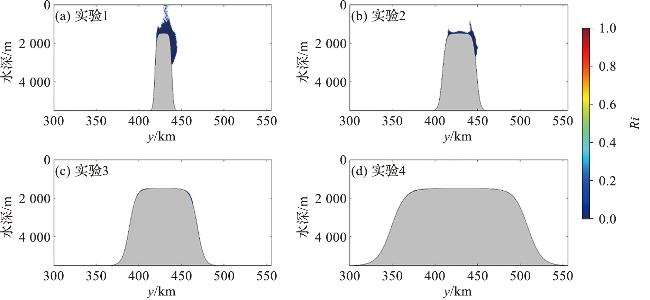
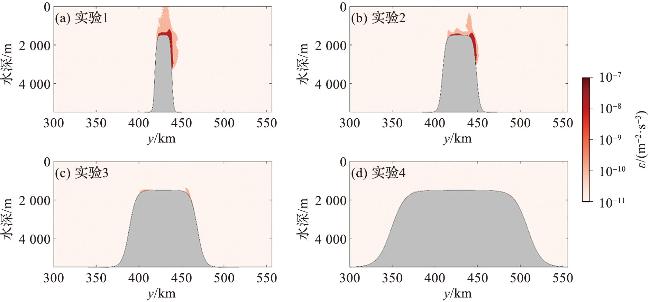
图8 Ri数的空间分布(t=5Tf)

Fig.8 Spatial distribution of the Ri number (t=5Tf)

图9 两个惯性周期(4Tf和5Tf)内的平均湍流耗散率ε的空间分布

Fig.9 Spatial distribution of the averaged turbulence dissipation rate ε over two inertial periods (4Tf and 5Tf)

图10 水平平均的湍流耗散率ε的时间演变(x=300~556 km)

Fig.10 Temporal evolution of the horizontally averaged turbulence dissipation rate ε (x=300-556 km)

3 小结

本文利用二维MITgcm模型探究了地转流与大尺度地形(海山)相互作用下近惯性内波产生、演变与耗散的过程。模拟结果表明,海山的阻塞作用导致海山顶部上方海流加速流动,破坏地转平衡,在海山山顶边缘产生了向上传播的近惯性内波。通过非线性波-波相互作用,能量从地转流转移至近惯性内波,随着输入能量增加,近惯性内波逐渐变强、发展更迅速。相对宽海山,窄海山产生的近惯性内波更强,引起湍流耗散的范围更大,并且迎流面和背流面不对称。前人常用陡度参数(J)来衡量流与地形产生的非线性作用的强弱,而本研究表明仅用J刻画非线性作用是不准确的,地形宽度(χ)同样能够影响非线性作用,在考虑真实的复杂地形时,需要考虑用地形宽度进行修正。
需要指出的是,本文使用理想的垂直二维数值模型模拟流与地形的相互作用,而在真实的海洋中,流体除了翻越海山,也会绕过地形障碍物。NIKURASHIN等[29]采用德雷克海峡地形参数对稳定流与地形相互作用产生内波的过程进行了二维和三维数值模拟,结果表明,对于中小尺度地形,三维模型产生的内波强度明显弱于二维模型。由于二维模拟的局限性,本研究对绕山流占优的小型海山的适用性有限,更适合用于跨山流主导的大尺度地形(如宽大海山、海脊、大陆坡等)。在真实的深海海底,常会出现多个海山或海山链,并且不同的海山之间可能相互影响,因此,在将来的研究中,需要使用更接近真实海洋的三维数值模型来模拟地转流与大尺度地形的相互作用。
[1]
ALFORD M H, MACKINNON J A, SIMMONS H L, et al. Near-inertial internal gravity waves in the ocean[J]. Annual Review of Marine Science, 2016, 8: 95-123.

DOI PMID

[2]
JOCHUM M, BRIEGLEB B P, DANABASOGLU G, et al. The impact of oceanic near-inertial waves on climate[J]. Journal of Climate, 2013, 26(9): 2833-2844.

[3]
HUMMELS R, DENGLER M, RATH W, et al. Surface cooling caused by rare but intense near-inertial wave induced mixing in the tropical Atlantic[J]. Nature Communications, 2020, 11(1): 3829.

DOI PMID

[4]
YANG B, HOU Y J. Near-inertial waves in the wake of 2011 Typhoon Nesat in the northern South China Sea[J]. Acta Oceanologica Sinica, 2014, 33(11): 102-111.

[5]
SIMMONS H, ALFORD M. Simulating the long-range swell of internal waves generated by ocean storms[J]. Oceanography, 2012, 25(2): 30-41.

[6]
MACKINNON J A, WINTERS K B. Subtropical catastrophe: Significant loss of low-mode tidal energy at 28.9°[J]. Geophysical Research Letters, 2005, 32(15): 2005GL023376.

[7]
ALFORD M H, SHCHERBINA A Y, GREGG M C. Observations of near-inertial internal gravity waves radiating from a frontal jet[J]. Journal of Physical Oceanography, 2013, 43(6): 1225-1239.

[8]
NIKURASHIN M, FERRARI R. Radiation and dissipation of internal waves generated by geostrophic motions impinging on small-scale topography: Theory[J]. Journal of Physical Oceanography, 2010, 40(5): 1055-1074.

[9]
ZEMSKOVA V E, GRISOUARD N. Near-inertial dissipation due to stratified flow over abyssal topography[J]. Journal of Physical Oceanography, 2021, 51: 2483-2504.

[10]
LABREUCHE P, STAQUET C, LE SOMMER J. Resonant growth of inertial oscillations from lee waves in the deep ocean[J]. Geophysical & Astrophysical Fluid Dynamics, 2022, 116(5/6): 351-373.

[11]
FURUICHI N, HIBIYA T, NIWA Y. Model-predicted distribution of wind-induced internal wave energy in the world’s oceans[J]. Journal of Geophysical Research, 2008, 113: C09034.

[12]
RAJA K J, BUIJSMAN M C, SHRIVER J F, et al. Near-inertial wave energetics modulated by background flows in a global model simulation[J]. Journal of Physical Oceano-graphy, 2022, 52(5): 823-840.

[13]
ZHAI X M, GREATBATCH R J, EDEN C, et al. On the loss of wind-induced near-inertial energy to turbulent mixing in the upper ocean[J]. Journal of Physical Oceanography, 2009, 39(11): 3040-3045.

[14]
ZHANG S W, XIE L L, ZHAO H, et al. Tropical storm-forced near-inertial energy dissipation in the southeast continental shelf region of Hainan Island[J]. Science China: Earth Sciences, 2014, 57(8): 1879-1884.

[15]
BREARLEY J A, SHEEN K L, NAVEIRA GARABATO A C, et al. Eddy-induced modulation of turbulent dissipation over rough topography in the Southern Ocean[J]. Journal of Physical Oceanography, 2013, 43(11): 2288-2308.

[16]
XIE X H, WANG Y, LIU Z Y, et al. Observation of near-inertial waves in the bottom boundary layer of an abyssal seamount[J]. Journal of Physical Oceanography, 2023, 53: 635-645.

[17]
KLYMAK J M, LEGG S M, PINKEL R. High-mode stationary waves in stratified flow over large obstacles[J]. Journal of Fluid Mechanics, 2010, 644: 321-336.

[18]
KUNZE E, SANFORD T B. Near-inertial wave interactions with mean flow and bottom topography near caryn seamount[J]. Journal of Physical Oceanography, 1986, 16(1): 109-120.

[19]
LIANG X F, THURNHERR A M. Eddy-modulated internal waves and mixing on a midocean ridge[J]. Journal of Physical Oceanography, 2012, 42(7): 1242-1248.

[20]
JIANG X L, DONG C M, JI Y X, et al. Influences of deep-water seamounts on the hydrodynamic environment in the northwestern Pacific Ocean[J]. Journal of Geophysical Research: Oceans, 2021, 126(12): e2021JC017396.

[21]
XIE X H, LIU X H, CHEN Z W, et al. Pure inertial waves radiating from low-frequency flows over large-scale topography[J]. Geophysical Research Letters, 2023, 50(4): e2022GL099889.

[22]
KLYMAK J M. Nonpropagating form drag and turbulence due to stratified flow over large-scale abyssal hill topography[J]. Journal of Physical Oceanography, 2018, 48(10): 2383-2395.

[23]
LEGG S, KLYMAK J. Internal hydraulic jumps and over-turning generated by tidal flow over a tall steep ridge[J]. Journal of Physical Oceanography, 2008, 38(9): 1949-1964.

[24]
KLYMAK J M, LEGG S M. A simple mixing scheme for models that resolve breaking internal waves[J]. Ocean Modelling, 2010, 33(3/4): 224-234.

[25]
WANG X Y, LI H L, ZHANG J J, et al. Seamounts generate efficient active transport loops to nourish the twilight ecosystem[J]. Science Advances, 2024, 10(26): eadk6833.

[26]
YANG L W, NIKURASHIN M, HOGG A M, et al. Energy loss from transient eddies due to lee wave generation in the Southern Ocean[J]. Journal of Physical Oceanography, 2018, 48(12): 2867-2885.

[27]
CUSACK J M, NAVEIRA GARABATO A C, SMEED D A, et al. Observation of a large lee wave in the drake passage[J]. Journal of Physical Oceanography, 2017, 47(4): 793-810.

[28]
WATERMAN S, NAVEIRA GARABATO A C, POLZIN K L. Internal waves and turbulence in the Antarctic circumpolar current[J]. Journal of Physical Oceanography, 2013, 43(2): 259-282.

[29]
NIKURASHIN M, FERRARI R, GRISOUARD N, et al. The impact of finite-amplitude bottom topography on internal wave generation in the Southern Ocean[J]. Journal of Physical Oceanography, 2014, 44(11): 2938-2950.

Outlines

/