
0 引言
随着工业化、城市化进程加快,人类活动排放的大量CO2引发了一系列环境和社会问题。实现碳中和已成为全球共识,对社会经济可持续发展至关重要。当前,各国的碳中和措施以减排为主,但仅靠减排仍难以实现目标,还需同步推进增汇措施[1]。海岸带蓝碳生态系统具有巨大的固碳增汇潜力,仅我国就储存了约1.18×10⁸ 吨碳[2]。我国无植被潮滩面积占潮间带总面积的75%,其年碳汇量占潮间带总碳汇量的73%,是海岸带蓝碳的重要组成部分[2]。然而,现有研究主要集中于盐沼湿地、红树林等具植被滩涂的固碳机制,无植被潮滩的碳汇贡献常被忽视[3-4]。无植被潮滩的高碳汇能力主要得益于其较高的沉积物埋藏速率[2,4]。沉积物中埋藏的碳主要包括生物残体、有机碎屑及结合态有机碳组分,而微藻在其中的贡献尤为显著。
生活在水体沿岸和沉积物表面的微型藻类,为淤泥质滩涂等无植被潮滩的重要生产者,其对生态系统初级生产力的贡献极大[5],在物质循环和能量流动中发挥关键作用,并能在一定程度上改变生境特征[6]。一方面微藻能够固定CO2,合成有机物,是底栖动物的重要食物来源[7],并可通过再悬浮作用参与水-底界面的物质输送与耦合[8],对近海次级生产具有重要影响[9]。另一方面微藻除自身为碳库的组分外,其分泌的胞外聚合物还能在沉积物表面形成生物膜,进一步增加碳储量[10]。此外,这种生物膜能增强沉积物的稳定性,减少潮水侵蚀[11-12],有利于碳在沉积物中的埋藏和封存。因此,淤泥质滩涂(潮间带)微藻的群落组成及其碳储量贡献,对蓝碳生态系统具有重要意义。
1 材料与方法
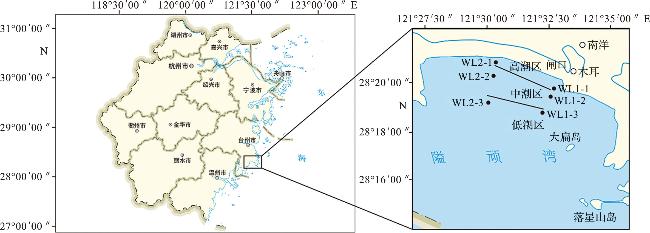
1.1 调查区域与站位布设
1.2 样品采集及处理
1.3 微藻群落结构分析
考虑到不同微藻种类的细胞大小不同,相同丰度下其对碳汇的贡献可能存在显著差异,基于微藻细胞碳含量换算的生物量,计算得到的多样性指数更能反映微藻群落结构。故分别基于细胞密度计算丰度多样性指数(H'a)和均匀度指数(J'a),基于生物量计算生物量多样性指数(H'b)和均匀度指数(J'b)。文中涉及到的群落结构分析计算公式如下
$H^{\prime}=-\sum_{i=1}^{S} P_{i} \times \ln \left(P_{i}\right)$
J'=
式中: H'为Shannon多样性指数,Pi为第i个种的细胞密度(或生物量)占总细胞密度(或总生物量)的比值,J'为均匀度指数,S为微藻的种类数。
1.4 生物量及碳库计算
生物量计算采用生物体积换算法。将镜检记录的每种微藻的长、宽、高(随机选取3个微藻细胞个体取平均值)按其大体几何形状换算为细胞体积。细胞体积根据几何图形和相应公式进行估算[27]。使用SPSS 25.0软件对不同断面和深度的微藻丰度及生物量差异进行Kruskal-Wallis检验。
根据微藻类群差异(硅藻和其他藻类),采用不同的转换系数将生物体积转换为细胞碳含量,转换公式如下[28]
硅藻:
log10C=0.76×(log10V)-0.352
其他藻类:
log10C=0.94×(log10V)-0.60
式中:C为每个细胞的碳含量(单位:×10-6μg),V为细胞体积(单位:μm3)。
将生物体积转换为细胞碳含量后,将样品中各微藻种群的碳含量累加,得到样品中以碳计的微藻总生物量,计算公式如下
$B=\sum_{i=1}^{N} C_{i} \times D_{i}$
式中:B为样品中以碳计的微藻总生物量(单位:μg/cm3);N为样品的总藻类数(无量纲);Ci为第i个种群微藻的个体细胞碳含量(单位:μg);Di为第i个种群微藻的细胞丰度(单位:cells/cm3)。
区域内淤泥质滩涂微藻碳库储量计算公式如下
$C_{\text {stock }}=\frac{\sum_{i=1}^{N} C_{i}}{n} \times A \times 10^{-5}$
$C_{i}=\sum_{j=1}^{N} B_{j} \cdot L_{j}$
式中:Cstock为淤泥质滩涂微藻碳储量(单位:kg),A为淤泥质滩涂总面积(单位:m2),Ci为第i个样芯的有机碳含量(单位:μg/cm2),n为样地数量(无量纲),Bj为样芯第j层分样微藻碳生物量(单位:μg/cm3),Lj为第j层分样厚度(单位:cm)。
2 结果与讨论
2.1 微藻的群落构成与生态类型
表1 隘顽湾泥滩微藻主要优势种丰度与生物量Tab.1 Abundance and biomass of the main species of microalgae in the mudflat of Aiwan Bay |
| 优势种 | 丰度/(×103 cells·cm-3) | 丰度占比/% | 生物量/(μg·cm-3) | 生物量占比/% | |
|---|---|---|---|---|---|
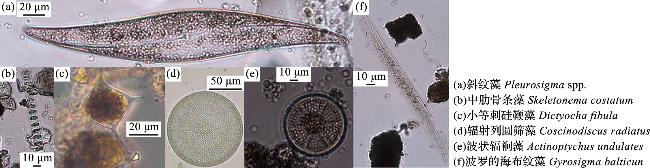
| 辐射列圆筛藻 Coscinodiscus radiatus | 0.84±0.54 | 10.43 | 1.00±0.64 | 13.32 | |
| 钝头菱形藻 Nitzschia obtusa | 钝头菱形藻 Nitzschia obtusa | 0.50±0.66 | 6.16 | 0.28±0.37 | 3.76 |
| 弯菱形藻 Nitzschia sigma | 0.42±0.34 | 5.21 | 0.06±0.05 | 0.84 | |
| 小眼圆筛藻 Coscinodiscus oculatus | 0.35±0.17 | 4.30 | 0.37±0.19 | 4.98 | |
| 长尾布纹藻 Gyrosigma macrum | 0.33±0.26 | 4.06 | 0.05±0.04 | 0.73 | |
| 长端节肋缝藻 Frustulia lewisiana | 0.32±0.37 | 4.01 | 0.26±0.29 | 3.45 | |
| 波状辐裥藻 Actinoptychus undulates | 0.27±0.19 | 3.38 | 0.12±0.08 | 1.64 | |
| 波罗的海布纹藻 Gyrosigma balticum | 0.28±0.17 | 3.48 | 0.45±0.27 | 6.06 | |
| 斜纹藻 Pleurosigma spp. | 0.24±0.18 | 2.97 | 0.26±0.20 | 3.56 | |
| 平片针杆藻 Synedra tabulata | 0.24±0.33 | 2.93 | 0.03±0.04 | 0.39 | |
| 星脐圆筛藻仿玟纹变种 Coscinodiscus asteromphalus var. subbuliens | 0.21±0.11 | 2.54 | 0.56±0.30 | 7.47 | |
| 小等刺硅鞭藻 Dictyocha fibula | 0.22±0.19 | 2.70 | 0.46±0.40 | 6.07 | |
| 流水双菱藻 Surirella fluminensis | 0.20±0.12 | 2.47 | 0.15±0.10 | 2.07 | |
| 中肋骨条藻 Skeletonema costatum | 0.58±1.18 | 7.23 | 0.02±0.05 | 0.31 | |
| 斯氏布纹藻 Gyrosigma spencerii | 0.20±0.19 | 2.54 | 0.03±0.03 | 0.46 |
2.2 微藻各类群的数量组成与分布
隘顽湾微藻各类群数量组成如表2所示,平均丰度为 (8.04±5.55)×103 cells/cm3,平均生物量为 (7.42±5.51)μg/cm3,其中硅藻的平均丰度和生物量均最高,其占比均超过89%。除绿藻由于细胞体积小导致低生物量外,其余类群的生物量组成与丰度组成基本对应。
表2 隘顽湾泥滩微藻各类群的平均丰度与生物量Tab.2 Average abundances and biomass among microalgal taxonomic groups in the mudflat of Aiwan Bay |
| 种类 | 平均丰度/(×103cells·cm-3) | 丰度占比/% | 平均生物量/(μg·cm-3) | 生物量占比/% |
|---|---|---|---|---|
| 硅藻 | 7.67±5.34 | 95.44 | 6.68±4.84 | 89.94 |
| 金藻 | 0.23±0.21 | 2.85 | 0.47±0.43 | 6.34 |
| 甲藻 | 0.05±0.05 | 0.65 | 0.27±0.28 | 3.60 |
| 绿藻 | 0.09±0.10 | 1.06 | 0.01±0.01 | 0.12 |
| 合计 | 8.04±5.55 | 100 | 7.42±5.51 | 100 |
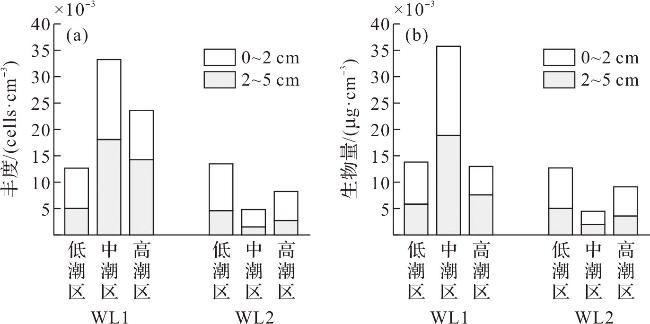
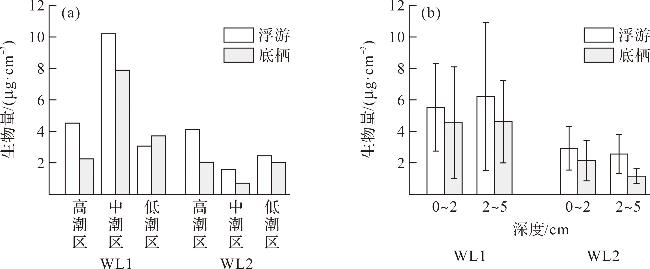
从区域内微藻丰度和生物量的组成来看,硅藻占据绝对优势。除WL1断面高潮区外,微藻丰度与生物量在平面分布和垂直分布上均表现出基本一致的分布态势(图3)。两条断面间的丰度和生物量均存在显著(p<0.05)差异,而不同深度的丰度和生物量均无显著差异。
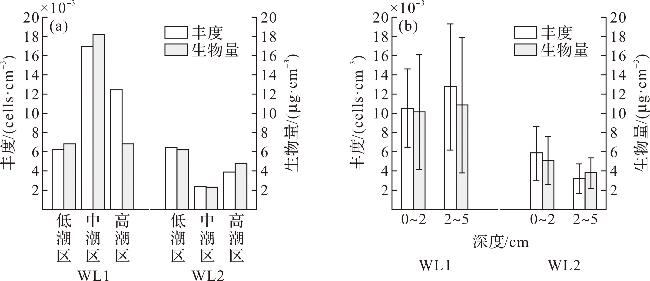
从平面分布看 (图3a), WL1 断面上中潮区的微藻平均丰度与生物量最高,分别为 16.94×10³ cells/cm3和18.10 μg/cm3;高潮区的平均丰度远高于低潮区,但两区的平均生物量却相近,这是因为贡献大部分丰度的骨条藻Skeletonema、直链藻Melosira和菱形藻Nitschia对生物量的贡献较小。与WL1断面不同,微藻在WL2 断面的低潮区出现最高的平均丰度与生物量,分别为 6.40×10³ cells/cm3和6.17 μg/cm3,而在WL2断面上中潮区的平均丰度与生物量最低,分别为2.36 cells/cm3和2.29 μg/cm3。
潮滩上不同潮区的微藻丰度和生物量除受潮水影响外,还受到陆源输入的影响。在受潮水控制显著的低潮区,两条断面的微藻丰度和生物量相近。而在高潮区和中潮区,WL1断面的微藻丰度和生物量均高于WL2断面,这与WL1断面更靠近闸口有关。隘顽湾岸边分布大量农田,其闸口排放水的陆源营养盐浓度可能较高。一方面闸口作为陆源输入的主要排放口,其富含营养盐的淡水渗流具有明显的局部效应,可增加微藻的丰度和生物量,提高底栖生物群落的总代谢和潮间带的初级生产力[31];另一方面,开闸放水时的大流量输入容易切割潮滩形成潮沟[32],改变了附近的水动力系统,而细胞粒级较大的硅藻伴随泥沙在靠近潮沟的位置容易沉降[33]。而且,在WL1断面还检出了淡水浮游绿藻四尾栅藻Scenedesmus quadricauda,表明其相对WL2断面受陆源影响更强烈。
2.3 多样性指数和均匀度指数
表3所示为基于丰度和生物量计算的隘顽湾不同潮区的多样性指数(H'a和H'b)和均匀度指数(J'a和J'b)。从水平分布上看,基于丰度计算的H'a和J'a均在WL1断面的中潮区出现最高值,在WL2断面的中潮区出现较低值(其中H'a为最低值),而两条断面高、低潮区的H'a和J'a数值接近。基于生物量计算的指数相较于基于丰度计算的指数,除在WL1断面的高潮区略微上升外,在其余各区域均下降。使得H'b和J'b的峰值转移至WL1断面的高潮区,谷值仍位于WL2断面的中潮区。有别于基于丰度的计算结果,在使用生物量计算多样性指数和均匀度指数时,WL1断面的结果整体上略高于WL2断面。
表3 隘顽湾泥滩不同潮区微藻的多样性指数和均匀度指数Tab.3 Diversity and evenness indices of microalgae in different tidal zones in the mudflat of Aiwan Bay |
| 指数 | WL1断面 | WL2断面 | |||||
|---|---|---|---|---|---|---|---|
| 高潮区 | 中潮区 | 低潮区 | 高潮区 | 中潮区 | 低潮区 | ||
| H'a | 3.24 | 3.46 | 3.23 | 3.32 | 2.95 | 3.14 | |
| H'b | 3.32 | 3.20 | 2.94 | 3.00 | 2.59 | 2.84 | |
| J'a | 0.84 | 0.89 | 0.86 | 0.87 | 0.84 | 0.83 | |
| J'b | 0.86 | 0.82 | 0.78 | 0.79 | 0.74 | 0.76 | |
表4所示为基于丰度和生物量计算的隘顽湾不同深度的多样性指数(H'a和H'b)和均匀度指数(J'a和J'b)。从垂直分布上看,相较基于丰度计算的多样性指数和均匀度指数,基于生物量计算的结果均出现明显下降。无论采用何种计算方法,WL1断面两个深度和WL2断面0~2 cm深度的均匀度指数相近,多样性指数在WL1断面略高,以WL1断面2~5 cm深度的多样性指数相对最高。H'a 、J'a 、H'b 和J'b的最低值均出现在WL2断面的2~5 cm深度。
表4 隘顽湾泥滩不同深度微藻的多样性指数和均匀度指数Tab.4 Diversity and evenness indices of microalgae at different depths in the mudflat of Aiwan Bay |
| 指数 | WL1断面 | WL2断面 | |||
|---|---|---|---|---|---|
| 0~2 cm | 2~5 cm | 0~2 cm | 2~5 cm | ||
| H'a | 3.47 | 3.51 | 3.41 | 3.10 | |
| H'b | 3.18 | 3.29 | 3.07 | 2.74 | |
| J'a | 0.87 | 0.87 | 0.89 | 0.82 | |
| J'b | 0.80 | 0.81 | 0.80 | 0.72 | |
2.4 微藻碳储量及来源
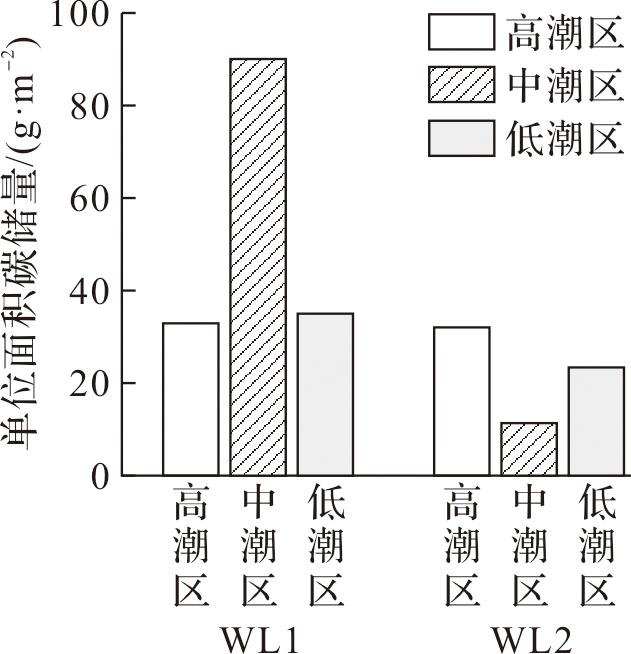
基于硅藻和其他类群的生物量估算,隘顽湾单位面积微藻碳储量平均为37.1 g/m2,按滩涂面积57.51 km2计算,隘顽湾微藻总碳储量为2 134 t。同步调查显示,隘顽湾沉积物有机碳总量为2.6×10⁵ t(未发表数据),微藻贡献占比约为0.82%。如图5所示,微藻碳储量的空间分布呈显著异质性:WL1 断面高潮区、中潮区和低潮区微藻单位面积碳储量分别为 32.8、89.5和34.8 g/m2,WL2断面高潮区、中潮区和低潮区微藻单位面积碳储量分别为31.9、11.6和23.1 g/m2,两个断面低潮区与高潮区的碳储量水平接近,而WL1断面的中潮区碳储量明显偏高。
将微藻来源分为浮游型和底栖型两类后,对其生物量构成进行分析,将微藻细胞生物体积转换成生物量进行表示,结果如图6所示。
虽然本次调查结果表明泥滩沉积物中的微藻碳储量相对沉积物碳储量较低,但其生态功能在滩涂碳通量和碳埋藏过程中起着重要作用。微藻的初级生产是泥滩生态系统中最主要的固碳过程,除去以个体形式沉积以及向下一营养级转移外,其分泌的胞外聚合物也是沉积物有机碳的重要组成部分,这一部分甚至可达光照期间固定碳的40%~73%[40]。另外,本研究在估算微藻碳储量时仅计算了较完整的个体,没有考虑破碎部分和样品前处理中被滤掉的小型个体(<10 μm),可能低估了微藻碳储量。
3 结论
微藻碳库是淤泥质滩涂碳储量的重要组成部分,也是连通各生物碳库的重要纽带。本次调查结果显示,隘顽湾泥滩潮间带微藻种类丰富,多样性较高,其中硅藻在丰度和生物量上均占据绝对优势。受陆源输入影响,两条断面在生物量和丰度方面表现出明显的空间异质性,但其浮游型微藻的沉降输入占比相似。根据微藻生物量估算,调查期间隘顽湾微藻碳储量为2 134 t,约占隘顽湾总碳储量的0.82%。值得注意的是,微藻碳储量中浮游型微藻的沉降输入占比约为60%,表明外源碳输入很可能在淤泥质滩涂的碳储量中占据重要地位。需要说明的是,受调查方案限制,单季度数据不能准确代表隘顽湾的全年情况,且站位设置不够充足,两条断面差异较大,可能对其碳储量估算产生影响,但本次调查结果仍可为微藻碳储量的研究提供参考。