
0 引言
1 三角洲-陆架沉积体系有机碳来源及沉积通量
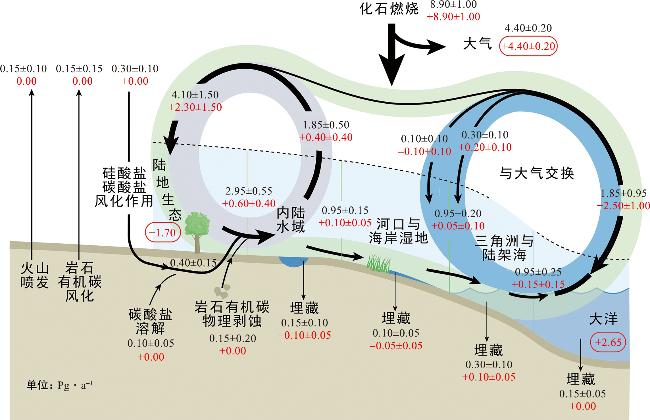
图1 综合考虑了陆地-海洋水生连续体(LOAC)碳循环通量的全球碳收支(图件改绘自文献[22]。图中黑色数字为现代碳循环通量估算值,红色数字是现代碳循环通量与工业革命前对应值对比的结果,+(-)分别代表增加或减少。) Fig.1 The global carbon budget incorporating carbon cycle fluxes of the land-to-ocean aquatic continuum (LOAC) (The figure is redrawn from reference [22]. The black numbers in the figure represent the estimated values of modern carbon cycle fluxes, while the red numbers represent the comparison results between modern carbon cycle fluxes and their corresponding values before the Industrial Revolution. The symbols “+” and “-” indicate an increase and a decrease, respectively.) |
2 陆源有机碳源汇过程示踪与再矿化作用
2.1 陆源有机碳源汇过程示踪
2.2 陆源有机碳再矿化作用
2.3 陆源有机碳再矿化效率或埋藏效率
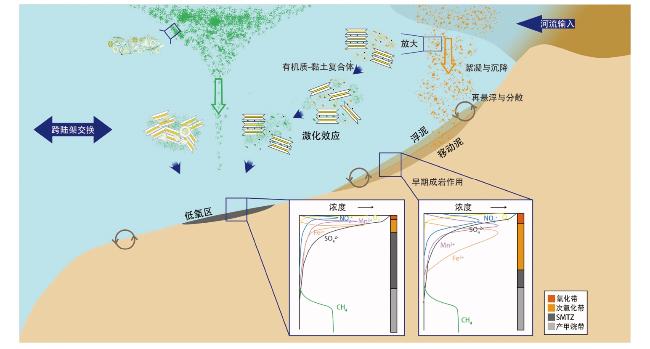
表1 大陆边缘陆源有机碳埋藏效率计算方法与结果Tab.1 Calculation methods and results of burial efficiency of terrigenous organic carbon in continental margins |
| 研究区 | 计算方法 | 保存率 | 参考文献 |
|---|---|---|---|
| 全球性 | (∑SOC×OCterr%)/∑OCterr | 9%~17% | 文献[7] |
| 全球性 | 埋藏通量/沉积通量 | 20%~44% | 文献[11] |
| 东海陆架 | 沉积总量/河流输入总量 | 10% | 文献[48] |
| 东海陆架 | 沉积总量/河流输入总量 | 23% | 文献[49] |
| 黄海陆架 | 沉积总量/河流输入总量 | 68% | 文献[49] |
| 亚马孙河口 | OC/SA比较 | 30%~52% | 文献[51] |
| 飞河三角洲 | OC/SA比较 | 43% | 文献[47] |
| 东海内陆架 | OC/SA比较 | 24.7% | 文献[34] |
| 东海外陆架 | OC/SA比较 | 10.7% | 文献[34] |
| 东海陆架 | OC/SA比较 | 16% | 文献[49] |
| 黄海陆架 | OC/SA比较 | 76% | 文献[49] |
| 南黄海柱状样 | OC/SA比较 | 97% | 文献[38] |
3 大陆边缘陆源有机碳循环过程与再矿化的主控机制
3.1 河流源POC输入变化
3.2 入海后陆源POC选择性吸附、沉降和再矿化作用
3.3 早期成岩作用下的有机碳再矿化及影响因素
3.4 人类活动影响
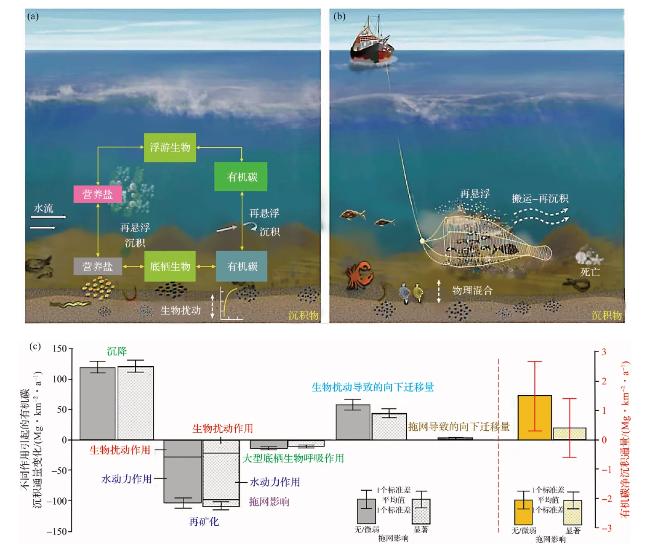
图6 底拖网对海洋沉积有机碳保存及通量的影响[a:自然情景下海洋底栖与浮游生物耦合作用对有机碳保存的影响;b:叠加底拖网作用下的情景;c:北海有/无底拖网作用两种情景下,模拟计算得到的不同作用(沉降、再矿化、大型底栖生物呼吸作用、生物扰动和底拖网)引起的有机碳沉积或丢失通量(左侧),和它们累计作用的有机碳净沉积通量(右侧)。图件改绘自文献[97]。] Fig.6 Impacts of bottom trawling on the preservation and flux of marine sedimentary organic carbon [a: Benthic-pelagic coupling in a natural system; b: Processes involved in bottom trawling; c: Model-estimated source and sink terms of OC in surface sediments in the No-trawling and trawling scenarios of the North Sea through different processes including deposition, remineralization, macrobenthos respiration, bioturbation and trawling-induced downward transport (left), and their cumulative OC deposition fluxes. The figure is redrawn from reference [97].] |