
0 引言
1 材料与方法
1.1 研究海域概况
1.2 数据与预处理
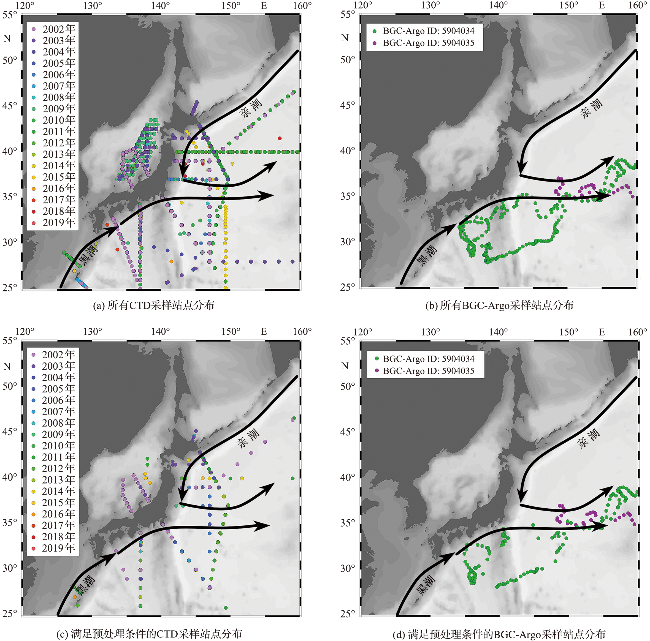
表1 BGC-Argo和CTD站位数据统计Tab.1 Data statistics of BGC-Argo and CTD sampling sites |
| 数据类型 | 时间范围 | 总站位数/个 | 预处理后站位数/个 | 数据利用率/% |
|---|---|---|---|---|
| CTD | 2002-01-18—2019-08-02 | 3 526 | 383 | 10.86 |
| BGC-Argo | 2013-03-01—2017-02-24 | 427 | 159 | 37.24 |
1.3 计算方法
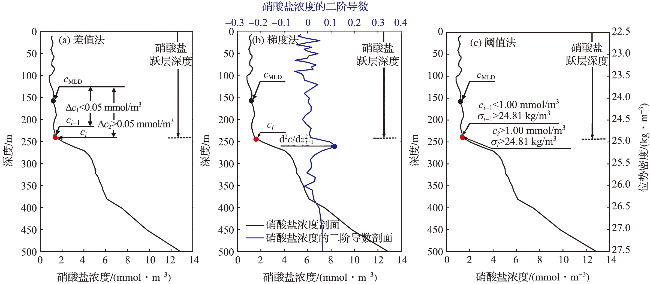
图2 三种硝酸盐跃层深度的计算方法示意图(cMLD为剖面中混合层深度的硝酸盐浓度,ci为剖面上第i个数据点的硝酸盐浓度,ci-1为剖面上第i-1个数据点的硝酸盐浓度,Δc1为ci-1与cMLD的差值,Δc2为ci与cMLD的差值,d2c/d 为硝酸盐浓度的二阶导数剖面上第i+1个点对应数值,σi和 分别为剖面上第i个和第i-1个点的位势密度。) Fig.2 Schematic diagrams of three nitracline depth calculation methods (cMLD represents the nitrate concentration of the MLD point of the profile, ci represents the nitrate concentration of the ith data point of the profile, ci-1 is the nitrate concentration of the (i-1)th data point, Δc1 is the difference between ci-1 and cMLD, Δc2 is the difference between ci and cMLD, d2c/d is the (i+1)th data point on the second derivative profile of nitrate concentration, σi and σi-1 represent the potential density of the ith and (i-1)th point, respective.) |
1.3.1 差值法
1.3.2 梯度法
1.3.3 阈值法
1.3.4 误差评估
2 结果与验证
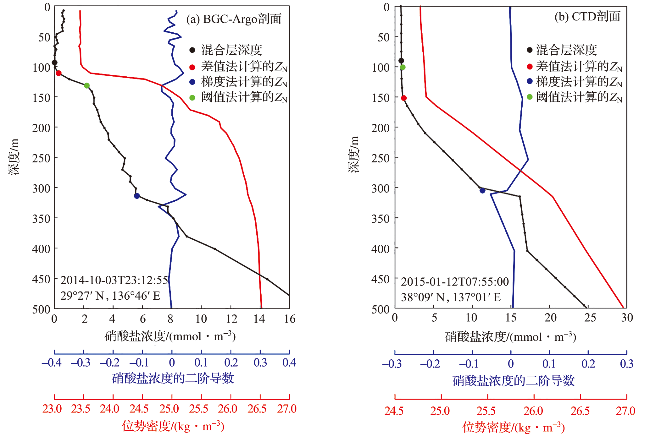
图3 针对单一剖面三种方法计算得到的硝酸盐跃层深度Fig.3 The nitracline depth calculated by the three methods for a single profile |
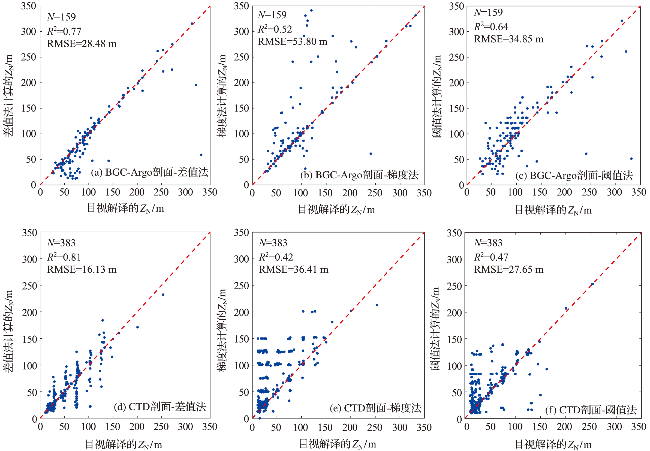
2.1 差值法结果
2.2 梯度法结果
2.3 阈值法结果
2.4 辅助验证
表2 JOO模型计算的硝酸盐跃层深度与目视解译以及其他三种方法计算结果的对比统计Tab.2 Comparison of the ZN calculated by the JOO model with the results of observed and other three methods calculated |
| 统计参数 | 目视解译法 | 差值法 | 阈值法 | 梯度法 |
|---|---|---|---|---|
| R2 | 0.82 | 0.78 | 0.71 | 0.68 |
| RMSE/m | 14.06 | 15.12 | 19.05 | 20.06 |