
0 引言
设计波高推算时有两个关键环节,一是选取波高极值样本,二是针对样本确定波高的分布模型[5]。独立性标准是选取波高极值样本的标准之一。为保证样本独立性,取样时需尽量避免选取相关性较强的波高,降低特例情形对样本统计特征造成的影响。常用的取样方法有年极值法和阈值法[6⇓-8]。年极值法是从原始波高序列中选取每年的最大值作为极值样本,这些最大值可以认为是相互独立的,但由于原始波高序列通常观测年限较短,使用年极值法取出的样本数量较少,可能导致外推结果不稳定。阈值法是选取序列中超过某一阈值的独立波高作为极值样本(即波高过阈样本),从而达到扩充样本数量、提高预测稳定性的目的。然而,波高极值通常伴随风暴出现,若直接选取波高超出量序列(即原始波高序列中超过某一阈值的全部波高)作为样本,则样本中很可能存在由同一场风暴引起的多个波高,即存在“聚类”现象,导致选取的样本不符合独立性标准。因此在使用阈值法取样时需要使用“去聚类”方法处理波高超出量序列[9]。
常用的“去聚类”方法有固定窗法、双阈值法、移动窗法、Runs法和标准风暴长度(standard storm length, SSL)法等。其中,固定窗法[10]是取固定的时间窗中的最大波高作为极值样本,认为不同时间窗的最大波高之间是独立的。然而,固定窗法中,由同一场风暴导致的波高可能被划分在两个不同的时间窗内,导致对独立事件的错误划分。双阈值法[11]使用一个小阈值区分不同的风暴过程,这种方法除了需要确定一个较高的阈值之外,还需要确定四个参数:小阈值、风暴最小持续时间、峰值间隔以及风暴过程首尾间隔,在实际应用中较为复杂。移动窗法、Runs法和SSL法[12⇓-14]具有准确性较高、应用简便的优势。移动窗法是改进的固定窗法,通过移动时间窗使窗内的最大波高位于时间窗中心,同时限制两个相邻极值之间的波高不得大于较小极值的75%;Runs法认为,如果两个相邻的极值之间至少有连续k个低于阈值的波高,则这两个极值是独立的;SSL法定义标准风暴长度$\tau$为风暴的平均最短持续时间,认为两个相邻波高极值的发生时间至少应相差一个标准风暴长度。然而,这三种方法中,关键参数(时间窗的长度、k值或$\tau$值)的选取目前没有确定的标准,通常根据经验或图形诊断选定[15⇓-17]。其中,SSL法通过绘制设计波高-标准风暴长度图,观察图形中的稳定区间,人为地选择标准风暴长度。受研究经验的影响,不同研究者选择的标准风暴长度可能不同,导致选取的样本具有不确定性。因此,需要研究自动的标准风暴长度估计方法。
设计波高推算的另一关键环节是针对极值样本选取适当的分布模型。当阈值相对较低时,波高过阈样本通常具有尖峰、厚尾的统计特征[18-19]。极值理论已经证明区间最大值的极值分布为广义极值分布(GEV)[20-21]。GEV的尾部厚度由形状参数决定,对于厚尾的波高过阈样本,若要准确地拟合样本的峰值部分,必然会牺牲尾部拟合的准确度。特别地,GEV的形状参数趋近于0时的极限分布为Gumbel分布,Gumbel分布具有指数型尾部(也称轻尾),此类尾部趋近于0的速度过快,难以准确拟合样本的厚尾。广义Pareto分布(GPD)对样本的尾部具有很强的适应性[22],然而GPD的概率密度函数是单调递减的无峰函数,难以拟合样本的尖峰部分。因此,现有模型无法准确地描述波高过阈样本在整个定义域上的统计特性,有必要开发一种能同时拟合样本的尖峰和厚尾的新模型。一种常用的方法是建立混合模型[23],通过将某种概率密度函数(如GPD)的尾部缝合到有峰的密度函数中,构建新的分布模型,如混合极值模型[24]和混合Pareto模型[25],其中混合Pareto模型可以同时反映样本的尖峰和厚尾的特征,已应用于降雨[26]、径流[27]等样本的拟合。然而,混合Pareto模型的密度函数为分段函数,需要强制密度函数和密度函数的导数在连接点处连续;另外,在估计混合Pareto模型的参数时,GPD的位置参数需要手动选取[28],导致混合Pareto模型的灵活性较低。因此,仍需构建新的分布模型,以期能够灵活、准确地拟合波高过阈样本的尖峰和厚尾。
本文对多年一遇设计波高的推算做了两方面的研究:其一,针对目前SSL法中的标准风暴长度需要人为选取的问题,提出了一种自动的标准风暴长度估计方法;其二,针对现有模型不能同时拟合波高过阈样本的尖峰和厚尾的问题,基于组合模型原理构建了一种新的分布模型——Gumbel-Pareto分布模型。基于这两方面的研究,本文选取了粤西海域的波高过阈样本,检验了Gumbel-Pareto分布对样本的拟合优度,并计算了该海域的多年一遇设计波高。
1 波高过阈样本选取
1.1 SSL法介绍
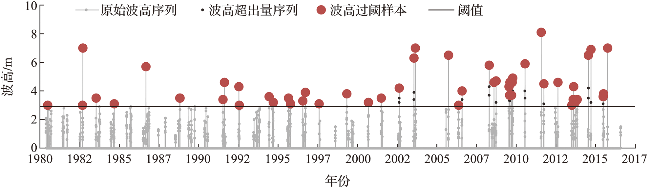
为了提取出符合独立性标准的波高过阈样本,本文使用SSL法对波高超出量序列进行“去聚类”。假设由不同风暴引起的波浪是独立的,那么不同风暴引起的最大波高必然也是独立的。因此,由大到小依次取每个风暴期间的最大波高为样本点,直至某个风暴的最大波高小于阈值为止,即可得到一系列独立的波高过阈样本。SSL法假设所有风暴的持续时间相同,称这个统一的风暴持续时间为标准风暴长度$\tau$,并且假设风暴只发生在最大值前后$\tau$/2的历时内,即以每场风暴中最大波高的发生时刻为风暴历时的中心。当$\tau$已知时,SSL法按照以下步骤选取独立的波高过阈样本:
1)从原始波高序列中挑选出最大波高作为样本点;
2)以最大波高的发生时刻为中心,丢弃发生在该时刻前后$\tau$/2时间内的波高;
3)对剩余序列重复进行步骤1)~2),直到提取的下一个最大波高不超过设定的阈值。
可以看出,在SSL法中,标准风暴长度$\tau$的选择十分关键,如果$\tau$太小,那么提取出的样本可能不符合独立性标准;如果$\tau$太大,那么独立的波高可能被排除在样本之外,造成数据浪费,外推的稳定性和精度降低。然而目前的研究中,标准风暴长度需要通过图形诊断人为选取,受研究者研究经验的影响较大,导致样本的不确定性增加。针对当前SSL法中标准风暴长度的选择问题,本文基于极值指数提出了一种自动的标准风暴长度估计方法。
1.2 自动的标准风暴长度估计方法
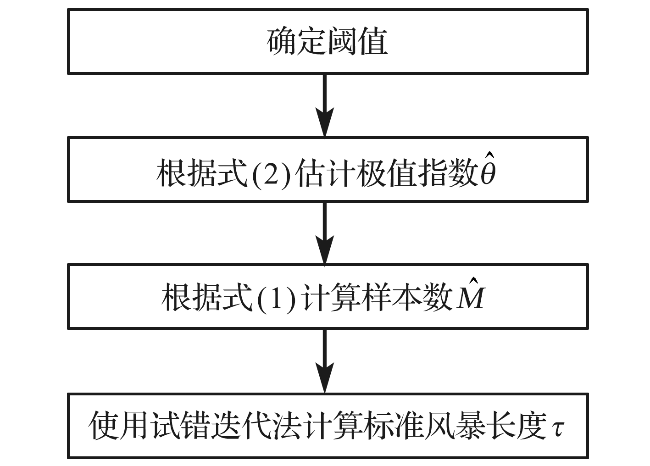
在随机过程理论中,极值指数与序列中“簇”的数量相关,能够描述数据的“聚类”趋势。LEADBETTER[29]证明,极值指数的倒数为超出量序列中簇的平均大小,即极值指数具有如下性质:
式中: 表示当阈值为u时极值指数的估计值, 为第j个超出量与第j+1个超出量之间的时间间隔。对于一个确定的阈值u,可根据式(2)估计超出量序列的极值指数, 再由式(1)确定簇数的估计值 。
在伴随风暴发生的波高序列中,可以认为“簇”表示风暴,因此簇数 即为波高超出量序列中独立风暴的个数,也即独立的波高过阈样本数。使用SSL法选取波高过阈样本时仅有一个可变参数——标准风暴长度,因此,可使用试错迭代法计算标准风暴长度,当SSL法取出的样本数逼近 时停止迭代。自动的标准风暴长度估计方法的主要步骤如图1所示。
2 Gumbel-Pareto分布模型
为了更为准确地拟合尖峰、厚尾的波高过阈样本,本文基于ALZAATREH等[31]提出的组合模型原理构建了Gumbel-Pareto分布模型,以综合Gumbel分布和GPD在拟合样本峰值和尾部时的优势,提升分布模型对样本的拟合优度。
设H(x)和h(x)分别是随机变量X的累积密度函数(cumulative distribution function,c.d.f.)和概率密度函数(probability density function,p.d.f.)。W[H(x)]是H(x)的函数,且满足以下条件:
式中:a和b为常数,-∞≤a<b≤∞。
设G(t)和g(t)分别是随机变量T∈[a,b]的c.d.f.和p.d.f.,则可构建组合分布模型,组合分布模型的c.d.f.如式(4)所示:
当T∈[a,∞)时,积分上限W[H(x)]取H(x)的对数函数表达式-log[1-H(x)]即可满足公式(3)所示的条件[31],此时组合分布模型的c.d.f.如式(5)所示:
本文取组合分布模型中的H(x)为Pareto分布(即GPD-II型分布的标准形式[23]),G(t)为位置参数为0的Gumbel分布函数,以构建新的分布模型。Pareto分布和Gumbel分布的c.d.f.分别为式(6) 和式(7):
式中:α为形状参数,α≥0;σ为尺度参数,σ>0。
式中:t为自变量,β为尺度参数,β>0。
将式(6)、式(7)代入式(5),可得新模型的c.d.f.,如式(8)所示:
式中:β,α和σ为大于0的参数。将新模型记为Gumbel-Pareto分布模型。Gumbel-Pareto分布模型的p.d.f.可由c.d.f.求导得出,如式(9)所示:
Gumbel-Pareto分布模型的p分位数Q(p)如式(10)所示:
选取不同的参数组合,绘制Gumbel-Pareto分布的p.d.f.曲线,如图2所示。可以看出,Gumbel-Pareto分布的p.d.f.定义域为x>0,在不同的参数组合下均有单峰、右偏的特征。参数β和α影响着变量的总体标准差,随着β和α增大,随机变量在众数附近的概率密度增大,也即p.d.f.曲线的峰值变高,尾部变薄,表明新分布具有较为灵活的尾部;参数σ主要影响p.d.f.曲线峰值所在的位置,σ越大,峰值对应的自变量越大。
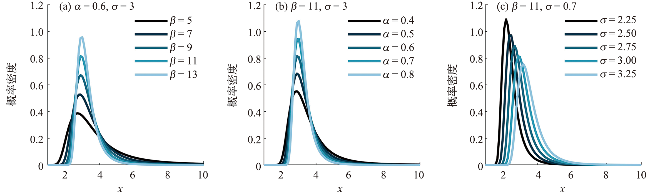
从图2可以看出,Gumbel-Pareto分布结合了Gumbel分布和GPD的优势。相对于Gumbel分布来说,Gumbel-Pareto分布引入了额外参数,使p.d.f.曲线的尾部更灵活;相对于GPD来说,Gumbel-Pareto分布是对GPD在整个定义域上的拓展,它的p.d.f.曲线同时具有尖峰和厚尾,因此Gumbel-Pareto分布能够用于拟合尖峰、厚尾的波高过阈样本。
3 工程算例
工程算例数据来自南海粤西海域国家海洋局硇洲海洋环境监测站(20.90°N,110.55°E),选取1980—2016年(2004年与2007年数据缺失)的风浪观测资料,使用日最大波高作为研究的特征波高。
3.1 样本选取
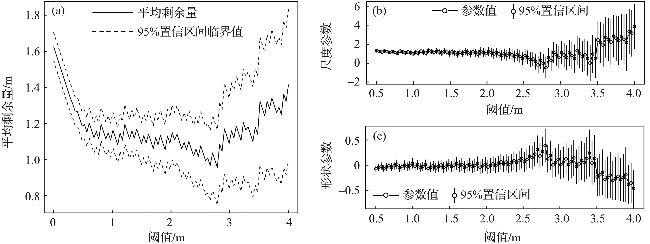
阈值对于波高过阈样本的选取十分重要[32-33],如果阈值过高,大于阈值的超出量较少,选取的波高过阈样本无法完全反映波高的总体分布特征,可能导致结论不合理或不稳定,同时也造成了观测资料的浪费;如果阈值过低,则过阈样本不符合极值理论的要求,难以使用极值分布模型拟合样本。平均剩余量是阈值的线性函数,且合适的阈值应当使样本的GPD参数估计值保持稳定,因此阈值可以根据平均剩余量图和GPD参数图(图3)确定[11]。由日最大波高数据的平均剩余量图可以看出,当阈值处于2.1~2.8 m及2.9~3.4 m区间内时,平均剩余量近似呈线性,其中,2.9~3.4 m的阈值区间对应的形状参数和尺度参数更稳定。为使样本数尽可能多,选择此范围内的较小值(2.9 m)作为阈值。
3.2 分布拟合与检验
表1 样本的主要统计特征量Tab.1 Main statistical characteristics of samples |
| 样本 | 尾部指数 | 均值/m | 方差/m2 | 偏度/m3 | 峰度/m3 |
|---|---|---|---|---|---|
| 波高过阈样本 | 3.059 | 4.351 | 1.798 | 1.092 | 3.124 |
| 波高年极值样本 | 9.958 | 4.610 | 2.611 | 0.437 | 2.354 |
分别使用Gumbel-Pareto分布、Gumbel分布和GPD拟合两组样本,采用数值方法[35]进行参数的极大似然估计,通过K-S(Kolmogorov-Smirnov)检验评估分布模型对样本的拟合优度。K-S检验是一种非参数假设检验,通过计算样本的经验分布与待测分布的误差统计量,检验该样本是否来自于待测分布。可使用p值进行统计决策,若p值>0.05则认为样本符合该分布有95%的可信度,p值越大则分布模型对样本的拟合优度越高。各分布模型的参数估计值及K-S检验的p值如表2所示。可以看出,Gumbel-Pareto分布用于拟合波高过阈样本时的K-S检验的p值最高,即Gumbel-Pareto分布对波高过阈样本的拟合优度高于Gumbel分布和GPD;另外,Gumbel-Pareto分布用于拟合年极值样本时,K-S检验的p值大于0.05,说明Gumbel-Pareto分布可以用于拟合尾部较轻的样本,具有灵活的尾部曲线。
表2 分布参数估计及K-S检验结果Tab.2 Results of parameters’ estimation and K-S tests |
| 样本 | 分布模型 | 参数 | 参数估计值 | K-S检验的p值 |
|---|---|---|---|---|
| 波高过阈 样本 | Gumbel-Pareto 分布 | β | 2.839 | 0.807 |
| α | 1.695 | |||
| σ | 3.677 | |||
| Gumbel 分布 | 尺度 | 0.894 | 0.419 | |
| 位置 | 3.772 | |||
| GPD | 形状 | 0.076 | 0.322 | |
| 尺度 | 2.120 | |||
| 位置 | 2.900 | |||
| 波高年极值 样本 | Gumbel-Pareto 分布 | β | 2.497 | 0.305 |
| α | 0.970 | |||
| σ | 3.584 | |||
| Gumbel 分布 | 尺度 | 1.362 | 0.689 | |
| 位置 | 3.855 | |||
| GPD | 形状 | 0.268 | 0.272 | |
| 尺度 | 3.110 | |||
| 位置 | 1.500 |
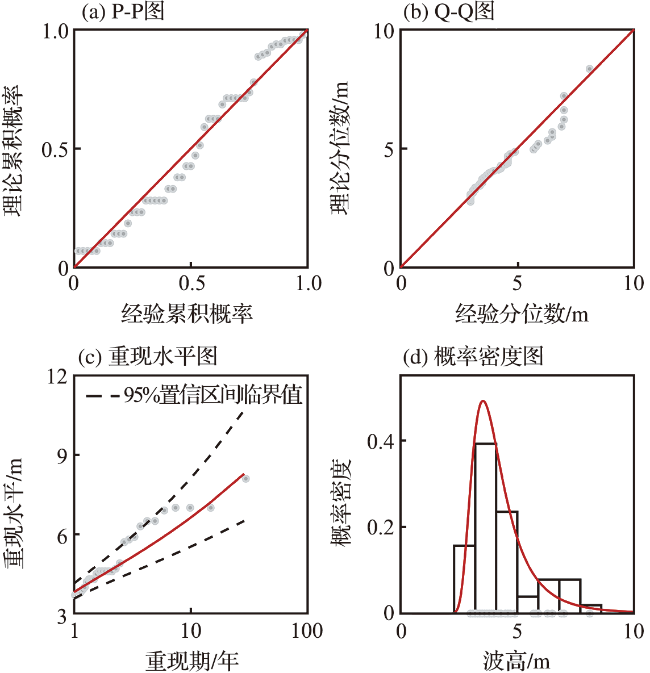
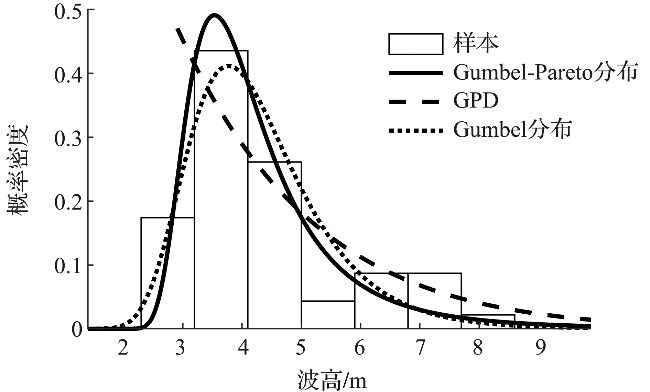
图7对比了Gumbel-Pareto分布、Gumbel分布和GPD的p.d.f.曲线对波高过阈样本直方图的拟合情况。可以看出,Gumbel分布的p.d.f.曲线的尖峰部分对样本的拟合较准,但其尾部趋于0的速度过快,对波高过阈样本的尾部拟合不足。GPD的p.d.f.曲线尾部最厚,但其p.d.f.曲线呈单调递减趋势,无法拟合样本直方图的峰值部分。Gumbel-Pareto分布的尾部厚度介于Gumbel分布和GPD之间,且对样本直方图的峰值部分拟合良好,表明Gumbel-Pareto分布能够同时反映样本尖峰和厚尾的统计特征。
3.3 设计波高推算
基于粤西海域的波高过阈样本,分别用Gumbel-Pareto分布、Gumbel分布和GPD计算了当地的20年、50年、100年和500年一遇的设计波高,计算方法见式(11):
式中:T为重现期, 表示T年一遇设计波高, 为分布函数的逆函数,λ为年均样本数。
设计波高计算结果列于表3。可以看出,当重现期为20~500年时,Gumbel-Pareto分布计算出的设计波高介于Gumbel分布和GPD之间,比Gumbel分布提高了2%~35%,比GPD降低了21%~30%,说明新模型的尾部厚度适中。另外,当重现期分别为20年、50年、100年和500年时,Gumbel-Pareto分布的设计波高比Gumbel分布的设计波高分别提高了2%、9%、15%和35%,二者之差呈递增趋势,即重现期越大,Gumbel-Pareto分布提高设计波高的作用越显著,说明Gumbel-Pareto分布体现了波高过阈样本的厚尾特性,能够为使用年限较长的大型海洋建筑物提供更安全的设计波高。
表3 不同分布模型计算的20年、50年、100年和500年一遇设计波高Tab.3 20-, 50-,100-, 500-year return levels of design wave height calculated by different distribution models |
| 重现期/年 | 设计波高/m | ||
|---|---|---|---|
| Gumbel-Pareto分布 | Gumbel分布 | GPD | |
| 20 | 6.037 | 5.904 | 7.646 |
| 50 | 7.346 | 6.748 | 10.060 |
| 100 | 8.500 | 7.376 | 11.990 |
| 500 | 11.890 | 8.821 | 16.910 |
4 结论
本文从极值样本的选取与极值分布模型的确定两方面研究了设计波高的推算方法。针对当前SSL法中标准风暴长度需要人为选取的问题,基于极值指数提出了一种自动的标准风暴长度估计方法;针对现有极值分布模型不能准确拟合尖峰、厚尾的波高过阈样本的问题,基于组合模型原理建立了一种新的分布模型——Gumbel-Pareto分布模型。基于这两方面的研究,选取了粤西海域的波高过阈样本,检验了Gumbel-Pareto分布对波高过阈样本的拟合优度,并计算了粤西海域的多年一遇设计波高,得到以下结论。
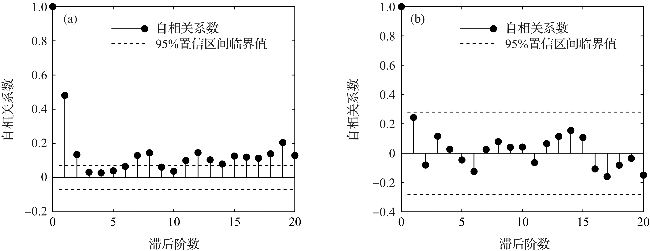
1)本文提出的自动的标准风暴长度估计方法是可行的,基于该方法选取的波高过阈样本符合独立性标准。
2)相较于年极值样本,波高过阈样本具有更大的样本容量;相较于过程极值样本,波高过阈样本更符合极值理论的要求。
3)Gumbel-Pareto分布模型结合了Gumbel分布和GPD的优势,可以同时反映波高过阈样本的尖峰和厚尾,与Gumbel分布和GPD相比,Gumbel-Pareto分布对波高过阈样本的拟合优度更高。
4)Gumbel-Pareto分布比Gumbel分布的尾部更厚。重现期越大,Gumbel-Pareto分布与Gumbel分布计算出的设计波高之间的差异越显著,即Gumbel-Pareto分布能够为使用年限较长的大型海洋建筑物提供更安全的设计波高。