Journal of Marine Sciences ›› 2025, Vol. 43 ›› Issue (1): 79-89.DOI: 10.3969/j.issn.1001-909X.2025.01.008
Previous Articles Next Articles
Seasonal variation and controlling factors of air-sea CO2 flux in tropical mangrove estuary: A case study of Dongzhai Harbor, Hainan
WANG Yang1,2( ), QUAN Xin1,3, ZHUANG Ya1,2, ZHAO Huade1, SU Jianzhong1,4,*()
- 1. State Key Laboratory of Marine Resources Utilization in South China Sea, Hainan University, Haikou 570228, China
2. School of Marine Biology and Fisheries, Hainan University, Haikou 570228, China
3. School of Ecology, Hainan University, Haikou 570228, China
4. School of Marine Science and Engineering, Hainan University, Haikou 570228, China
-
Received:2024-11-19Revised:2025-01-12Online:2025-03-15Published:2025-05-30 -
Contact:SU Jianzhong
CLC Number:
Cite this article
WANG Yang, QUAN Xin, ZHUANG Ya, ZHAO Huade, SU Jianzhong. Seasonal variation and controlling factors of air-sea CO2 flux in tropical mangrove estuary: A case study of Dongzhai Harbor, Hainan[J]. Journal of Marine Sciences, 2025, 43(1): 79-89.
share this article
Add to citation manager EndNote|Ris|BibTeX
URL: http://hyxyj.sio.org.cn/EN/10.3969/j.issn.1001-909X.2025.01.008
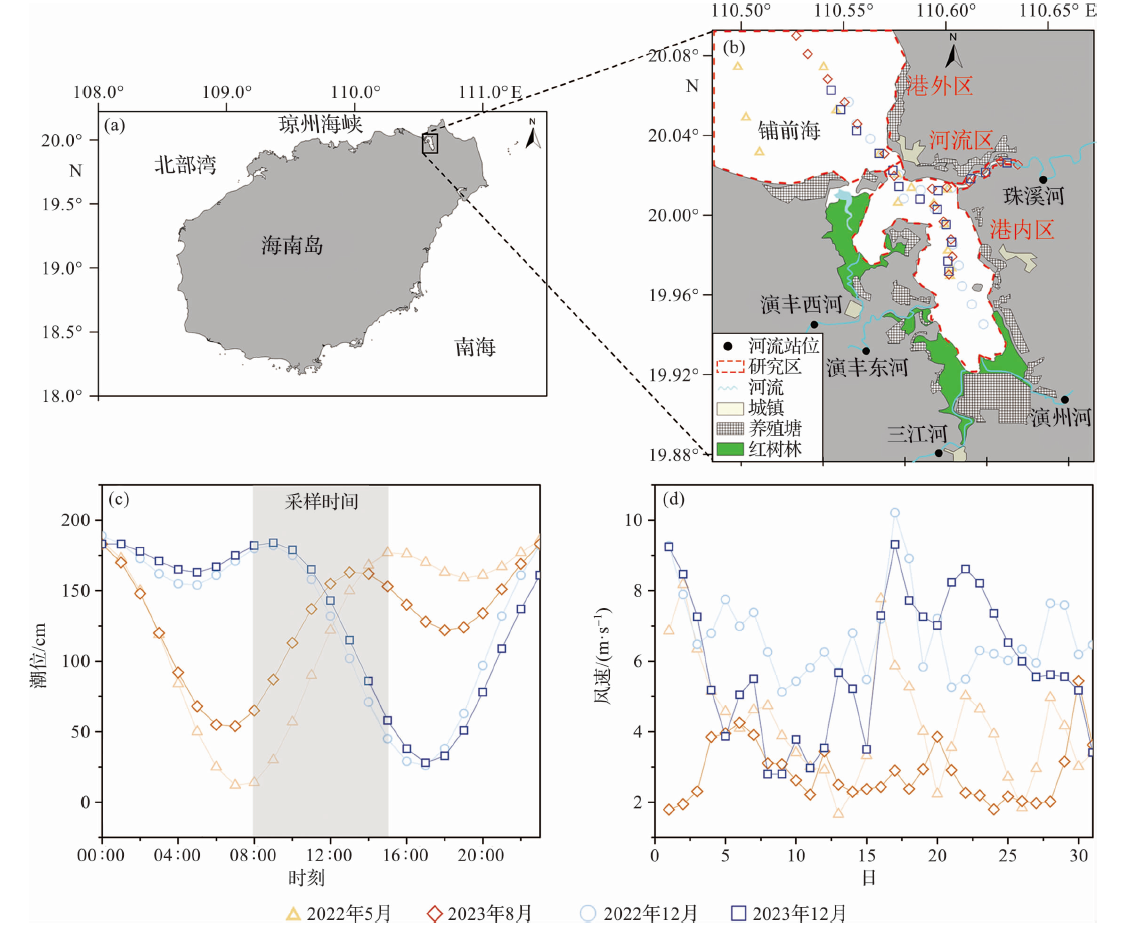
Fig.1 Location of the study area (a), sampling stations (b), tidal height at sampling days (c) and daily averaged wind speed at sampling month (d)
| 河流 | 季节 | 温度/℃ | 盐度 | pH | DIC /(μmol·kg-1) | TA /(μmol·kg-1) | DO /(μmol·kg-1) | DO饱和度/% | AOU /(μmol·kg-1) | pCO2 /μatm |
|---|---|---|---|---|---|---|---|---|---|---|
| 演丰西河 | 干季 | 18.1 | 0.10 | 6.89 | 1 126 | 1 048 | 234 | 79 | 62 | 2 941 |
| 湿季 | 27.9 | 0.03 | 6.58 | 877 | 757 | 192 | 78 | 54 | 2 761 | |
| 演丰东河 | 干季 | 18.3 | 0.09 | 6.81 | 854 | 730 | 224 | 76 | 71 | 3 657 |
| 湿季 | 29.0 | 0.02 | 6.34 | 750 | 600 | 168 | 68 | 74 | 4 318 | |
| 三江河 | 干季 | 18.7 | 0.06 | 6.85 | 749 | 618 | 259 | 90 | 29 | 3 501 |
| 湿季 | 29.4 | 0.01 | 6.34 | 689 | 549 | 183 | 75 | 57 | 4 511 | |
| 演州河 | 干季 | 19.0 | 0.06 | 6.78 | 672 | 535 | 226 | 77 | 69 | 2 990 |
| 湿季 | 30.0 | 0.04 | 6.27 | 640 | 520 | 143 | 59 | 95 | 4 939 | |
| 珠溪河 | 干季 | 18.1 | 0.10 | 6.94 | 661 | 544 | 224 | 75 | 76 | 2 113 |
| 湿季 | 28.8 | 0.10 | 6.26 | 780 | 693 | 178 | 73 | 64 | 3 900 |
Tab.1 The average values of various physical and chemical parameters of major rivers around Dongzhai Harbor
| 河流 | 季节 | 温度/℃ | 盐度 | pH | DIC /(μmol·kg-1) | TA /(μmol·kg-1) | DO /(μmol·kg-1) | DO饱和度/% | AOU /(μmol·kg-1) | pCO2 /μatm |
|---|---|---|---|---|---|---|---|---|---|---|
| 演丰西河 | 干季 | 18.1 | 0.10 | 6.89 | 1 126 | 1 048 | 234 | 79 | 62 | 2 941 |
| 湿季 | 27.9 | 0.03 | 6.58 | 877 | 757 | 192 | 78 | 54 | 2 761 | |
| 演丰东河 | 干季 | 18.3 | 0.09 | 6.81 | 854 | 730 | 224 | 76 | 71 | 3 657 |
| 湿季 | 29.0 | 0.02 | 6.34 | 750 | 600 | 168 | 68 | 74 | 4 318 | |
| 三江河 | 干季 | 18.7 | 0.06 | 6.85 | 749 | 618 | 259 | 90 | 29 | 3 501 |
| 湿季 | 29.4 | 0.01 | 6.34 | 689 | 549 | 183 | 75 | 57 | 4 511 | |
| 演州河 | 干季 | 19.0 | 0.06 | 6.78 | 672 | 535 | 226 | 77 | 69 | 2 990 |
| 湿季 | 30.0 | 0.04 | 6.27 | 640 | 520 | 143 | 59 | 95 | 4 939 | |
| 珠溪河 | 干季 | 18.1 | 0.10 | 6.94 | 661 | 544 | 224 | 75 | 76 | 2 113 |
| 湿季 | 28.8 | 0.10 | 6.26 | 780 | 693 | 178 | 73 | 64 | 3 900 |
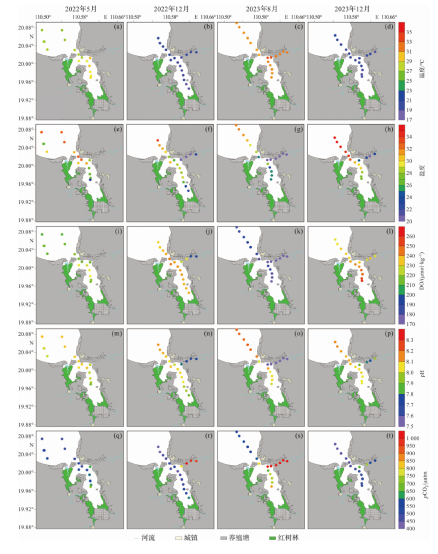
Fig.2 Spatial distributions of temperature (a-d), salinity (e-h), dissolved oxygen (i-l), pH (m-p) and pCO2(q-t) for each cruise at Dongzhai Harbor
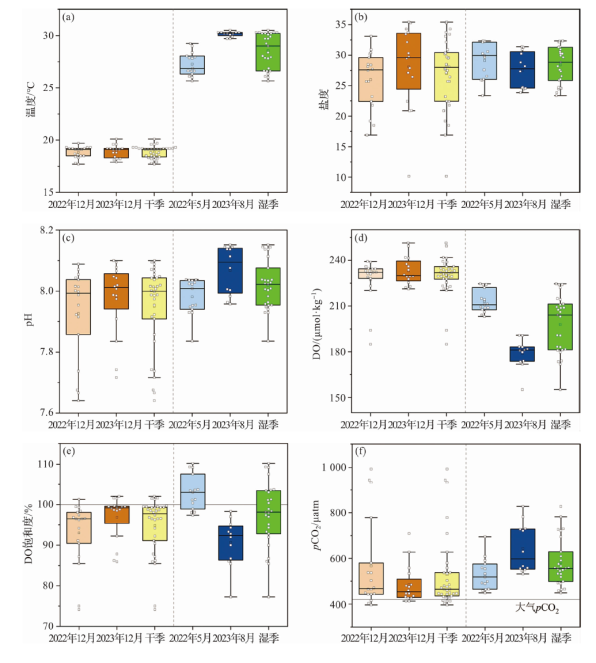
Fig.3 Water temperature (a), salinity (b), pH (c), dissolved oxygen (d), dissolved oxygen saturation (e), and pCO2 (f) in the inner and outer Dongzhai Harbor during the cruises
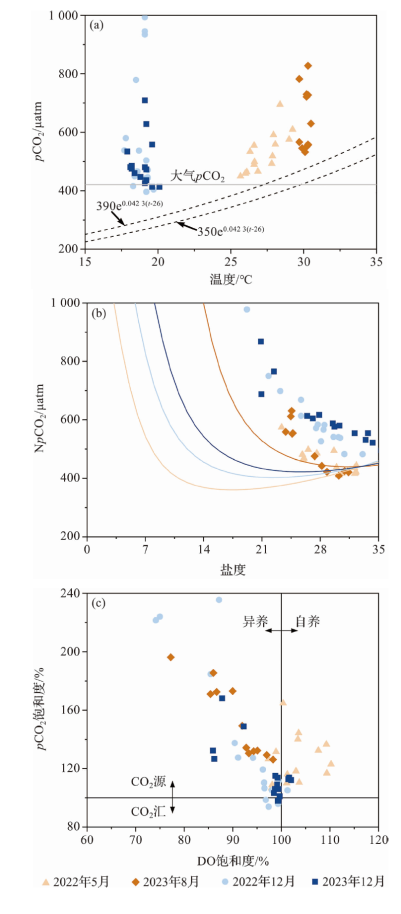
Fig.4 Distributions of temperature and pCO2 (a), salinity and NpCO2 (b), and dissolved oxygen saturation and pCO2 saturation (c) (Curves in Fig.b show the distribution of NpCO2 with salinity when only physical mixing occurs.)
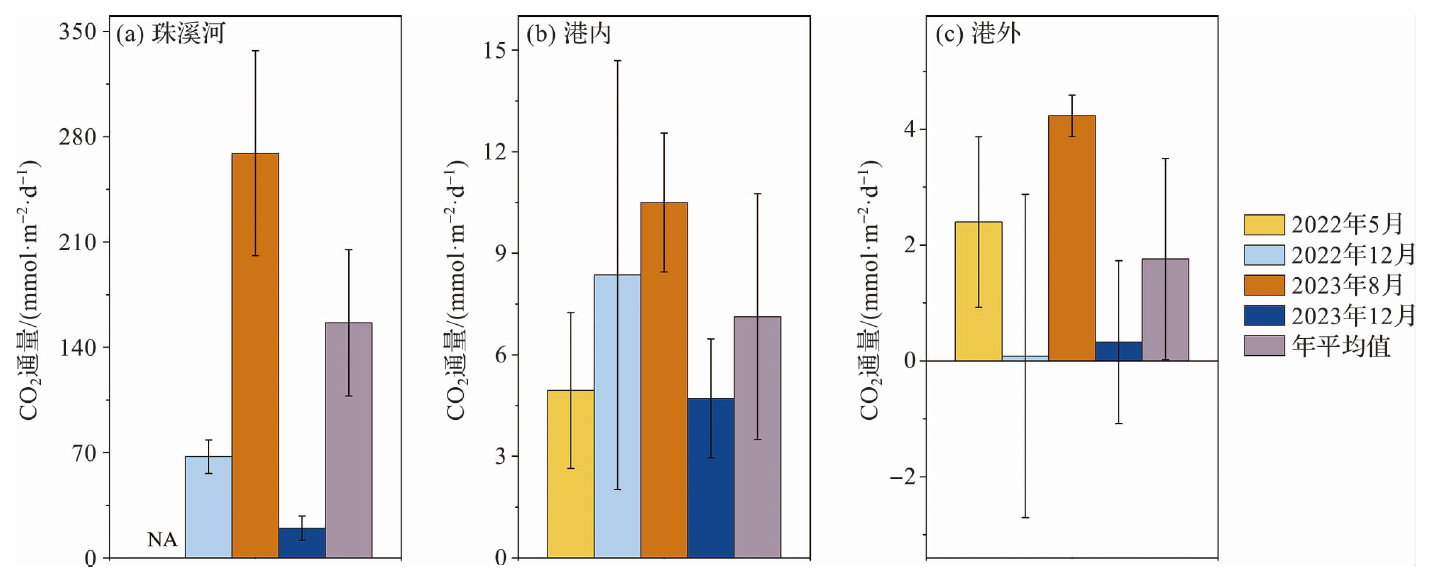
Fig.5 Average CO2 fluxes in different areas at Dongzhai Harbor during the cruises
| 国家/地区 | 河口 | 水体pCO2 /μatm | CO2通量 /mmol·m-2·d-1 |
|---|---|---|---|
| 安达曼群岛 | Kalighat | 1 574~7 888 | 70.8 |
| 安达曼群岛 | Wright Myo | 1 246~7 703 | 61.1 |
| 澳大利亚 | Moreton Bay | 9 513~27 188 | 201.6 |
| 澳大利亚 | Constant Creek Estuary | 449~1 632 | 21.5~50.5 |
| 澳大利亚 | Burdekin Estuary | 617~13 031 | 221.0 |
| 澳大利亚 | Fitzroy Estuary | 699~7 947 | 139.2 |
| 澳大利亚 | Johnstone Estuary | 387~9 744 | 110.6 |
| 澳大利亚 | Korogoro Creek | 869.0 | |
| 澳大利亚 | Evans Head | 997±317 | 63.0±166.0 |
| 澳大利亚 | Darwin | 622~1 263 | 40.0 |
| 澳大利亚 | Hinchinbrook Island | 1 341~3 304 | 30.0 |
| 澳大利亚 | Jacobs Well | 531~5 036 | 19.0 |
| 澳大利亚 | Newcastle | 404~3 224 | 46.0 |
| 澳大利亚 | Seventeen Seventy | 314~1 399 | 10.0 |
| 澳大利亚 | Barwon Heads | 0.4 | |
| 巴布亚新 几内亚 | Nagada Creek | 540~1 680 | 43.6 |
| 巴哈马 | Norman’s Pond | 395~690 | 13.8 |
| 巴西 | San Francisco Estuary | 298~2 007 | 0.7 |
| 巴西 | Itacuraca Creek | 660~7 700 | 113.5 |
| 百慕大群岛 | Mangrove Bay | 268~4 823 | 65.0 |
| 肯尼亚 | Tana River Delta | 230~5 300 | 58.0 |
| 肯尼亚 | Gazi Bay | 575~6 435 | 54.3 |
| 马达加斯加 | Betsiboka | 270~1 530 | 9.1±14.2 |
| 美国 | Shark River | 975~6 016 | 102.0 |
| 坦桑尼亚 | Ras Dege | 400~5 050 | 33.7 |
| 坦桑尼亚 | Mtoni | 400~1 700 | 18.0 |
| 印度 | Malta Estuary | 358~3 033 | 2.3 |
| 印度 | Dhamra Estuary | 146~751 | 0.6~218.0 |
| 印度 | Thakuran Estuary | 160~737 | 0.3 |
| 印度 | Sundarbans | 376~561 | 4.7 |
| 印度 | Gaderu Creek | 2 215±864 | 56.0±100.9 |
| 印度 | Gautami Godavari Estuary | 430~4 770 | 43.4 |
| 印度 | Mooriganga Estuary | 152~1 530 | 7.7 |
| 印度 | Saptamukhi Estuary | 193~4 000 | 28.5 |
| 印度 | Cochin | 1 500~3 800 | 55.1 |
| 印度 | Hooghly Estuary | 70~1 530 | -2.8~84.4 |
| 越南 | Kien Vang | 713~8 136 | 93.5 |
| 越南 | Tam Giang | 528~11 481 | 135.0 |
| 中国 | 漳江口云霄溪 | 1 733±605 | 57.6~115.2 |
| 中国 | 东寨港 | 426~8 910 | 12.1(港内+河道) |
| 中国 | 东寨港 | 396~8 910 | 6.1(整个区域) |
Tab.2 Comparison of CO2fluxes among Dongzhai Harbor and other mangrove estuaries[21?-23]
| 国家/地区 | 河口 | 水体pCO2 /μatm | CO2通量 /mmol·m-2·d-1 |
|---|---|---|---|
| 安达曼群岛 | Kalighat | 1 574~7 888 | 70.8 |
| 安达曼群岛 | Wright Myo | 1 246~7 703 | 61.1 |
| 澳大利亚 | Moreton Bay | 9 513~27 188 | 201.6 |
| 澳大利亚 | Constant Creek Estuary | 449~1 632 | 21.5~50.5 |
| 澳大利亚 | Burdekin Estuary | 617~13 031 | 221.0 |
| 澳大利亚 | Fitzroy Estuary | 699~7 947 | 139.2 |
| 澳大利亚 | Johnstone Estuary | 387~9 744 | 110.6 |
| 澳大利亚 | Korogoro Creek | 869.0 | |
| 澳大利亚 | Evans Head | 997±317 | 63.0±166.0 |
| 澳大利亚 | Darwin | 622~1 263 | 40.0 |
| 澳大利亚 | Hinchinbrook Island | 1 341~3 304 | 30.0 |
| 澳大利亚 | Jacobs Well | 531~5 036 | 19.0 |
| 澳大利亚 | Newcastle | 404~3 224 | 46.0 |
| 澳大利亚 | Seventeen Seventy | 314~1 399 | 10.0 |
| 澳大利亚 | Barwon Heads | 0.4 | |
| 巴布亚新 几内亚 | Nagada Creek | 540~1 680 | 43.6 |
| 巴哈马 | Norman’s Pond | 395~690 | 13.8 |
| 巴西 | San Francisco Estuary | 298~2 007 | 0.7 |
| 巴西 | Itacuraca Creek | 660~7 700 | 113.5 |
| 百慕大群岛 | Mangrove Bay | 268~4 823 | 65.0 |
| 肯尼亚 | Tana River Delta | 230~5 300 | 58.0 |
| 肯尼亚 | Gazi Bay | 575~6 435 | 54.3 |
| 马达加斯加 | Betsiboka | 270~1 530 | 9.1±14.2 |
| 美国 | Shark River | 975~6 016 | 102.0 |
| 坦桑尼亚 | Ras Dege | 400~5 050 | 33.7 |
| 坦桑尼亚 | Mtoni | 400~1 700 | 18.0 |
| 印度 | Malta Estuary | 358~3 033 | 2.3 |
| 印度 | Dhamra Estuary | 146~751 | 0.6~218.0 |
| 印度 | Thakuran Estuary | 160~737 | 0.3 |
| 印度 | Sundarbans | 376~561 | 4.7 |
| 印度 | Gaderu Creek | 2 215±864 | 56.0±100.9 |
| 印度 | Gautami Godavari Estuary | 430~4 770 | 43.4 |
| 印度 | Mooriganga Estuary | 152~1 530 | 7.7 |
| 印度 | Saptamukhi Estuary | 193~4 000 | 28.5 |
| 印度 | Cochin | 1 500~3 800 | 55.1 |
| 印度 | Hooghly Estuary | 70~1 530 | -2.8~84.4 |
| 越南 | Kien Vang | 713~8 136 | 93.5 |
| 越南 | Tam Giang | 528~11 481 | 135.0 |
| 中国 | 漳江口云霄溪 | 1 733±605 | 57.6~115.2 |
| 中国 | 东寨港 | 426~8 910 | 12.1(港内+河道) |
| 中国 | 东寨港 | 396~8 910 | 6.1(整个区域) |
| [1] | WMO温室气体公报第20期[R]. 2024. https://library.wmo.int/viewer/69466/. |
| WMO Greenhouse Gas Bulletin No.20[R]. 2024. https://library.wmo.int/viewer/69466/. | |
| [2] | CHEN C T A, HUANG T H, CHEN Y C, et al. Air-sea exchanges of CO2 in the world’s coastal seas[J]. Biogeo-sciences, 2013, 10(10): 6509-6544. |
| [3] | DAI M H, ZHAI W D, CAI W J, et al. Effects of an estuarine plume-associated bloom on the carbonate system in the lower reaches of the Pearl River estuary and the coastal zone of the northern South China Sea[J]. Continental Shelf Research, 2008, 28(12): 1416-1423. |
| [4] | WANG F M, SANDERS C J, SANTOS I R, et al. Global blue carbon accumulation in tidal wetlands increases with climate change[J]. National Science Review, 2021, 8(9): nwaa296. |
| [5] | ALONGI D M, MUKHOPADHYAY S K. Contribution of mangroves to coastal carbon cycling in low latitude seas[J]. Agricultural and Forest Meteorology, 2015, 213: 266-272. |
| [6] | TWILLEY R R, CHEN R H, HARGIS T. Carbon sinks in mangroves and their implications to carbon budget of tropical coastal ecosystems[J]. Water, Air, and Soil Pollution, 1992, 64: 265-288. |
| [7] | SIPPO J Z, MAHER D T, TAIT D R, et al. Are mangroves drivers or buffers of coastal acidification? Insights from alkalinity and dissolved inorganic carbon export estimates across a latitudinal transect[J]. Global Biogeochemical Cycles, 2016, 30(5): 753-766. |
| [8] | 国家林业局草业局. 国际重要湿地|海南东寨港国际重要湿地:我国红树林连片面积最大保护区[R]. 2022. http://www.fnrrc.com/hangyedongtai/7241.html. |
| National Forestry and Grassland Adminstration. Wetlands of international importance|dongzhaigang wetland of international importance, Hainan Province: The largest mangrove contiguous area in China [R]. 2022. http://www.fnrrc.com/hangyedongtai/7241.html. | |
| [9] | 石彭兰, 王强俊, 谭佐莉, 等. 冬季东寨港微微型浮游植物丰度、分布及影响因素[J]. 海洋与湖沼, 2023, 54(4):1058-1069. |
| SHI P L, WANG Q J, TAN Z L, et al. Abundance, distribution and environmental control of picophytoplankton in the winter Dongzhai harbor[J]. Oceanologia et Limnologia Sinica, 2023, 54(4): 1058-1069. | |
| [10] | 邢孔敏, 陈石泉, 蔡泽富, 等. 海南东寨港表层沉积物重金属分布特征及污染评价[J]. 海洋科学进展, 2018, 36(3):478-488. |
| XING K M, CHEN S Q, CAI Z F, et al. Distribution characteristics and pollution evaluation of heavy metals in surface sediment of Dongzhai Harbor, Hainan Province[J]. Advances in Marine Science, 2018, 36(3): 478-488. | |
| [11] | 李伟光, 张京红, 刘少军, 等. 海南岛干旱的气象特征及监测指标[J]. 热带生物学报, 2022, 13(4):324-330. |
| LI W G, ZHANG J H, LIU S J, et al. Meteorological characteristics and monitoring index of drought in Hainan Island[J]. Journal of Tropical Biology, 2022, 13(4): 324-330. | |
| [12] | KNAP A H, MICHAELS A F, CLOSE A R, et al. Protocols for the Joint Global Ocean Flux Study (JGOFS) Core Mea-surements[C]. Paris, France, UNESCO-IOC, 1996: 18-32. |
| [13] | TAKAHASHI T, OLAFSSON J, GODDARD J G, et al. Seasonal variation of CO2 and nutrients in the high-latitude surface oceans: A comparative study[J]. Global Biogeo-chemical Cycles, 1993, 7(4): 843-878. |
| [14] | YANG W, GUO X H, CAO Z M, et al. Carbonate dynamics in a tropical coastal system in the South China Sea featuring upwelling, river plumes and submarine groundwater discharge[J]. Science China Earth Sciences, 2022, 65: 2267-2284. |
| [15] | JIANG L Q, CAI W J, WANG Y C. A comparative study of carbon dioxide degassing in river- and marine-dominated estuaries[J]. Limnology and Oceanography, 2008, 53(6): 2603-2615. |
| [16] | ZHAI W D, DAI M H, CAI W J, et al. The partial pressure of carbon dioxide and air-sea fluxes in the northern South China Sea in spring, summer and autumn[J]. Marine Chemistry, 2005, 96(1/2): 87-97. |
| [17] |
GUEST M A, CONNOLLY R M, LEE S Y, et al. Mechanism for the small-scale movement of carbon among estuarine habitats: Organic matter transfer not crab movement[J]. Oecologia, 2006, 148(1): 88-96.
PMID |
| [18] | VACHON D, SADRO S, BOGARD M J, et al. Paired O2-CO2 measurements provide emergent insights into aquatic ecosystem function[J]. Limnology and Oceanography Letters, 2020, 5(4): 287-294. |
| [19] | 杨旭锋, 于培松, 潘建明, 等. 2019年夏末长江口及其邻近海域走航pCO2变化及控制机制[J]. 海洋学研究, 2021, 39(4):63-72. |
| YANG X F, YU P S, PAN J M, et al. Spatial variation of underway surface pCO2 and its controls in the Changjiang (Yangtze River) Estuary and adjacent sea area in late summer of 2019 [J]. Journal of Marine Sciences, 2021, 39(4): 63-72. | |
| [20] | JIANG Z P, CAI W J, LEHRTER J, et al. Spring net community production and its coupling with the CO2 dynamics in the surface water of the northern Gulf of Mexico[J]. Biogeosciences, 2019, 16(18): 3507-3525. |
| [21] | ROSENTRETER J A, MAHER D T, ERLER D V, et al. Methane emissions partially offset “blue carbon” burial in mangroves[J]. Science Advances, 2018, 4(6): eaao4985. |
| [22] | SWAIN S, PATTANAIK S, CHANDA A, et al. Multi-annual variability of pCO2(aq) and air-water CO2 flux in the mangrove-dominated Dhamra Estuary draining into the Bay of Bengal (India)[J]. Environmental Science and Pollution Research International, 2023, 30(51): 111021-111038. |
| [23] | LU Z Y, WANG F F, XIAO K, et al. Carbon dynamics and greenhouse gas outgassing in an estuarine mangrove wetland with high input of riverine nitrogen[J]. Biogeo-chemistry, 2023, 162(2): 221-235. |
| [24] | MARTÍNEZ CASTELLÓN S E, CATTANIO J H, BERRÊDO J F, et al. Spatial and temporal variability of carbon dioxide and methane fluxes in an Amazonian estuary[J]. International Journal of Hydrology, 2021, 5(6): 327-336. |
| [25] | HO D T, LAW C S, SMITH M J, et al. Measurements of air-sea gas exchange at high wind speeds in the Southern Ocean: Implications for global parameterizations[J]. Geophysical Research Letters, 2006, 33(16): 2006GL026817. |
| [26] | KREMER J N, REISCHAUER A, D’AVANZO C. Estuary-specific variation in the air-water gas exchange coefficient for oxygen[J]. Estuaries, 2003, 26(4): 829-836. |
| [27] | 2013 Supplement to the 2006 IPCC guidelines for national greenhouse gas inventories:Wetlands[R]. Geneva, IPCC, 2014. |
| [28] | 李翠华, 蔡榕硕, 颜秀花. 2010—2018年海南东寨港红树林湿地碳收支的变化分析[J]. 海洋通报, 2020, 39(4):488-497. |
| LI C H, CAI R S, YAN X H. Analysis on the changes of carbon budget of mangrove wetland in Hainan Dongzhaigang during 2010-2018[J]. Marine Science Bulletin, 2020, 39(4): 488-497. |
| Viewed | ||||||
|
Full text |
|
|||||
|
Abstract |
|
|||||